Volatility Explosion
- Indicators
-
Evgenii Sutulov
 I build trading indicators, strategies, and dashboards that don't repaint.
Seven years doing this. MetaTrader 4, MetaTrader 5, TradingView.
Closed bars only. What you see is what happened.
The bar being formed never changes a published value. - Version: 1.3
It stays silent until something actually happens. Volatility Explosion MTF measures the change in momentum bar by bar and reports it only when it clears two thresholds at once: the width of a Bollinger band and a dead zone built from a hundred bar true range. A bar that clears both is a real expansion of volatility with a side, and everything below them is nothing at all. It is free: no trial, no locked features, no upgrade page.
The burst is the difference between this bar's MACD and the previous bar's, multiplied by a sensitivity that puts it on the price scale. The explosion threshold is the width of a Bollinger band on the closes, that is twice the multiplier times the deviation. The dead zone is a Wilder smoothed true range over one hundred bars times its own multiplier, taken from the second version of the method.
A bar counts as explosive when the size of the burst is above both the threshold and the dead zone, and the sign of the burst says which way. The signal is the start of an explosion, the bar on which it first clears both. The strength multiple only grades it two instead of one; the threshold itself is the only thing that filters, exactly as in the original.
What is on the chart
In its own sub window: the explosion threshold and the dead zone as two lines, and the burst as a histogram whose side is its sign and whose shade says whether it is expanding or fading. Divergence is looked for on the burst series rather than on the threshold, because a threshold has no direction and a divergence on it would be meaningless.
The panel
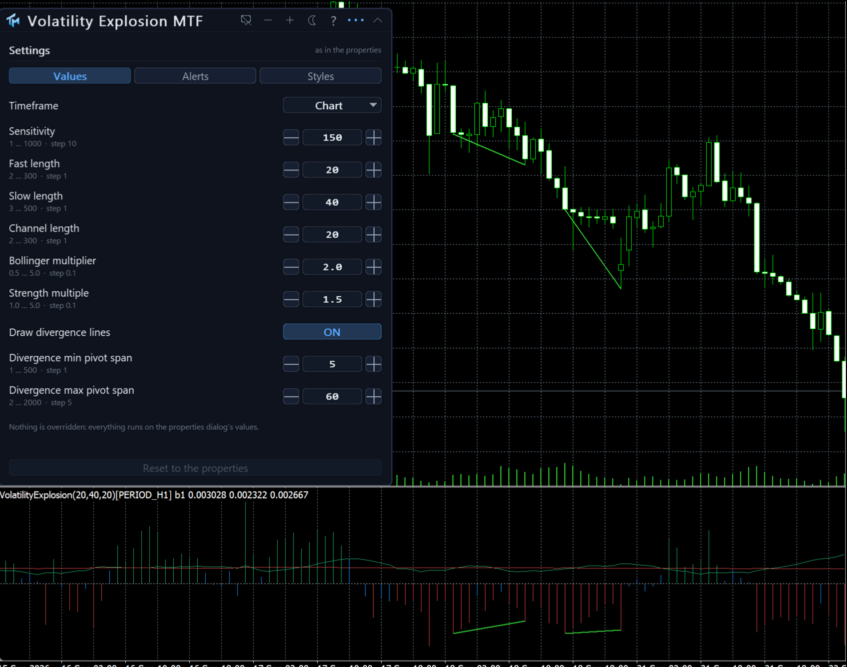
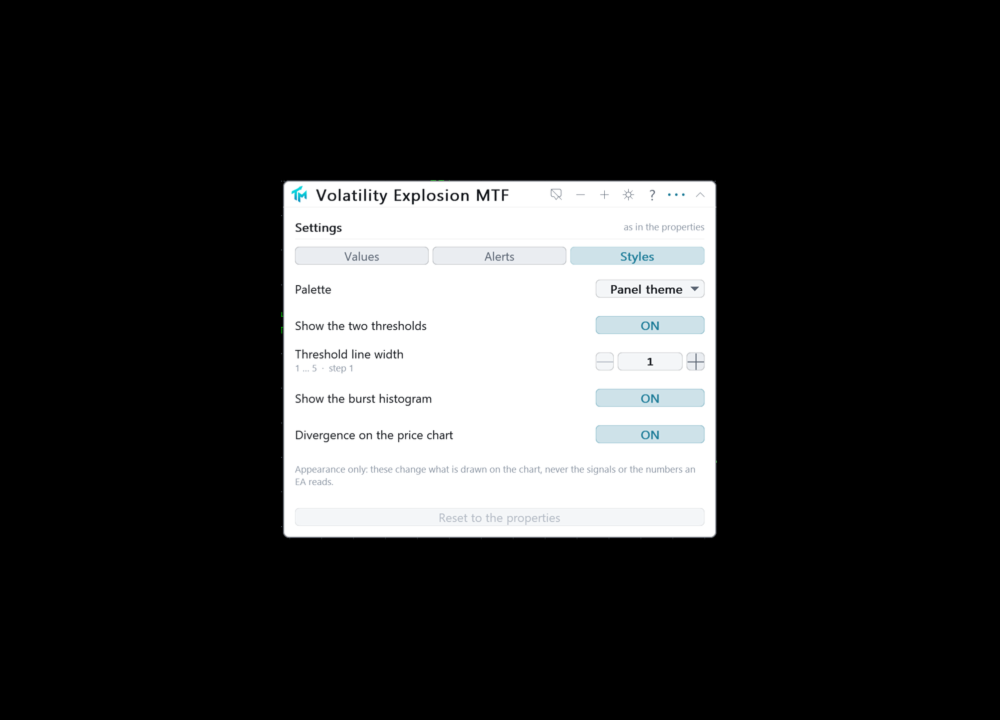
A canvas panel on the price chart, draggable, collapsible, closeable. It shows the timeframe in force and the setting values actually being used. It says what the last closed bar was: a BUY signal, a SELL signal, or neither. And it says whether the numbers on screen came from the properties dialog or from the panel, and how many of them were changed by hand.
Below that sit the settings the panel can move, with their current values. The gear opens a three-tab sheet.
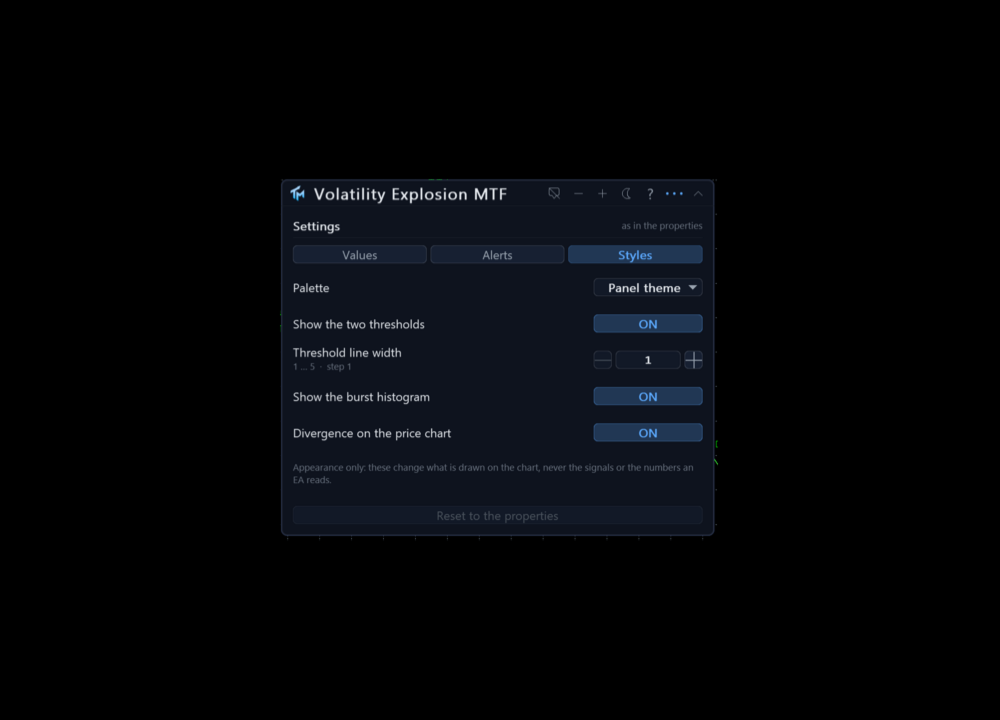
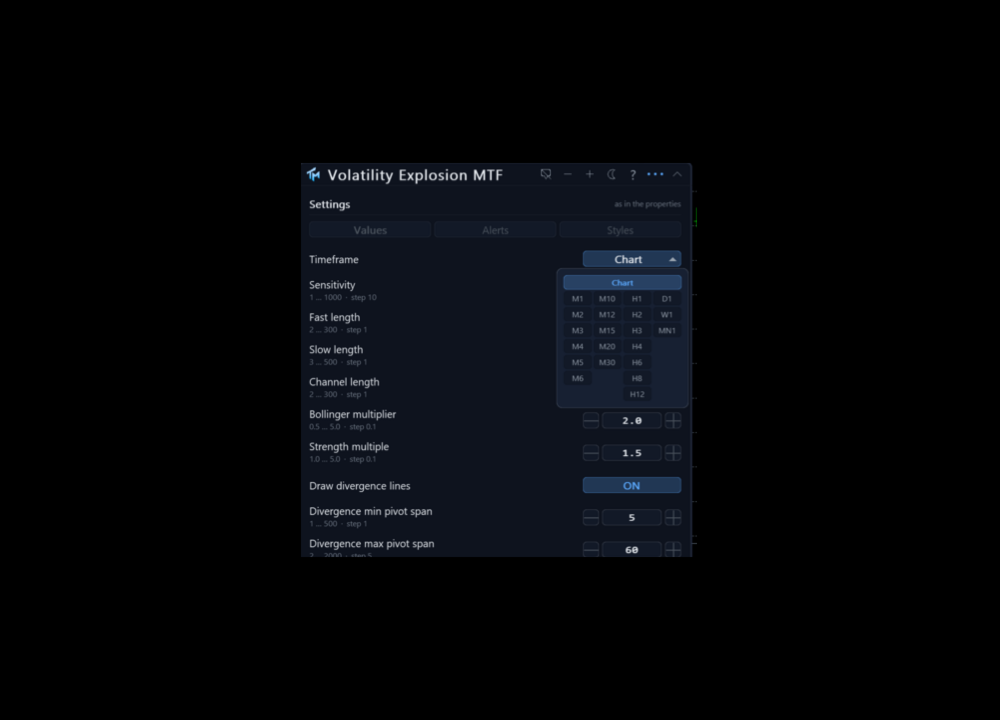
Values covers the timeframe, the sensitivity of one hundred and fifty, the fast and slow lengths of twenty and forty behind the momentum, the channel length of twenty and the Bollinger multiplier of 2.0 behind the threshold, the dead zone multiplier of 3.7, the strength multiple of 1.5 that grades a burst two, and the three divergence rows. Styles covers the palette, the two threshold lines and their width, and the burst histogram. Every Values row has steppers, a range and a sentence of help.
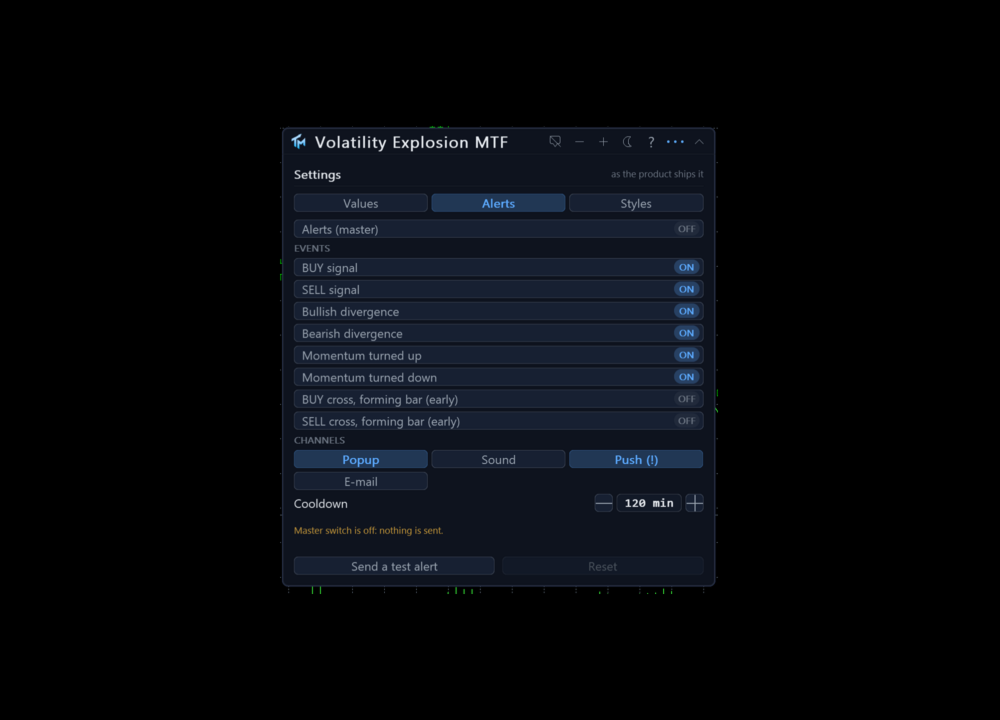
The Alerts tab covers the master switch, the per event switches, the channels, the cooldown in minutes and a test alert.
Three colour schemes: dark, light, and a colour-blind safe one that uses blue and orange rather than red and green. Everything about the panel, including every value changed on the sheet, is stored per chart and survives a timeframe change and a terminal restart. The interface is English.
Alerts
Off out of the box. Six events: a BUY signal, a SELL signal, a bullish divergence, a bearish divergence, momentum turning up, and momentum turning down. Each has a switch of its own.
Channels: a popup window, a sound, a push to the mobile terminal and e-mail. There are per-event and per-channel switches, and a cooldown that defaults to two hours.
Alerts fire on the last closed bar. Two further alerts, off by default, speak on the forming bar within a chosen number of seconds of its close, and they are labelled early because a flip that exists mid-bar can un-happen. Telegram is not part of this product.
Multi-timeframe
The Timeframe setting computes on a higher timeframe and draws the result here. Only closed senior bars are read: a chart bar shows the newest senior bar that had already closed by that chart bar's own close, so the flip lands on the bar that closes together with the senior bar, and nothing is drawn that could not have been known in real time.
The foreign series is built in the background. The first read of it can come back empty, the indicator retries, and the panel says whether it is waiting for a download or looking at a genuine shortage of history. It never fails initialisation over missing bars.
Reading it from an EA
Nine buffers, all readable through iCustom and CopyBuffer. Buffer 0 is the explosion threshold, the width of a Bollinger band on the closes and buffer 1 is the dead zone, a smoothed true range over one hundred bars times its multiplier. Buffer 2 is the burst itself, the change in the MACD scaled by the sensitivity, drawn as a histogram whose sign gives the side, and buffer 3 is the colour index that paints it. Buffer 4, Signal, is +1 on a BUY bar, -1 on a SELL bar and 0 otherwise. Buffer 5 is the grade of that signal. Buffer 6 carries the divergence marks, +1 bullish and -1 bearish. Buffer 7 is the zero line and buffer 8 is Override.
This product has no separate Buy and Sell price buffers, because there is no price to put an arrow at in a sub window. The signal is buffer 4 and it is the contract: filled on every pass whatever the Styles tab says, and present in the Data Window. Hiding a plot is done by taking its colour away and never by emptying a buffer, so every index above stays readable with the display switches off.
An instance created by iCustom is read only and always uses the parameters you passed. The Override buffer lets a strategy detect that a chart instance is running on numbers changed by hand from the panel.
Provenance
This is a port of "Waddah Attar Explosion", from LazyBear's openly published Pine and the second version with the automatic dead zone, which makes a port by formula admissible. The author's name is deliberately not carried into the product name; the reference belongs here in the provenance. Three deviations are declared: Pine writes the second term as the same function called on a shifted series, which after the warm up is identical to the previous bar's MACD and is written that way here; the deviation window and both averages are progressive on the first bars where Pine returns nothing; and divergence is looked for on the burst series, because the first plot slot holds the threshold and a threshold cannot diverge.
The product is called Volatility Explosion MTF because that is the name of the method, not because authorship of the method is claimed here. The original work belongs to its author.
Honest limits
The oscillator is live on the forming bar. A cross that exists mid-bar can be absent at the close, and the panel line and the grade go with it. Closed bars do not change.
This product measures the size of a move, not its rightness. An explosion is a statement that volatility expanded in a direction, and volatility expands at the end of moves as often as at the start of them.
The sensitivity puts the burst on the price scale, which means the height of the histogram is not comparable between symbols. The board compares them by grade and by freshness instead.
Two thresholds mean two ways to be silent. A genuine move that never clears the dead zone is simply not reported, and lowering the dead zone multiplier to catch it also lets the noise back in.
The settings move every signal the product will ever show. Two configurations produce two different sets of signals, and neither of them is the true one.
No profit figure, win rate or backtest result is claimed here.