Fibonacci Arcs MT4
- Indicators
-
Agus Santoso
 DISCLAIMER ON : The author of EA will not be held responsible for your losses or problems of any kind if the EA is directly or indirectly responsible for any losses.
Our software is provided “as is”, without any warranty or condition of any kind, express, implied or statutory. - Version: 1.0
- Activations: 5
MQL5 Blogs = https://www.mql5.com/en/blogs/post/775739
MT4 Version = https://www.mql5.com/en/market/product/195514
MT5 Version = https://www.mql5.com/en/market/product/ 195515
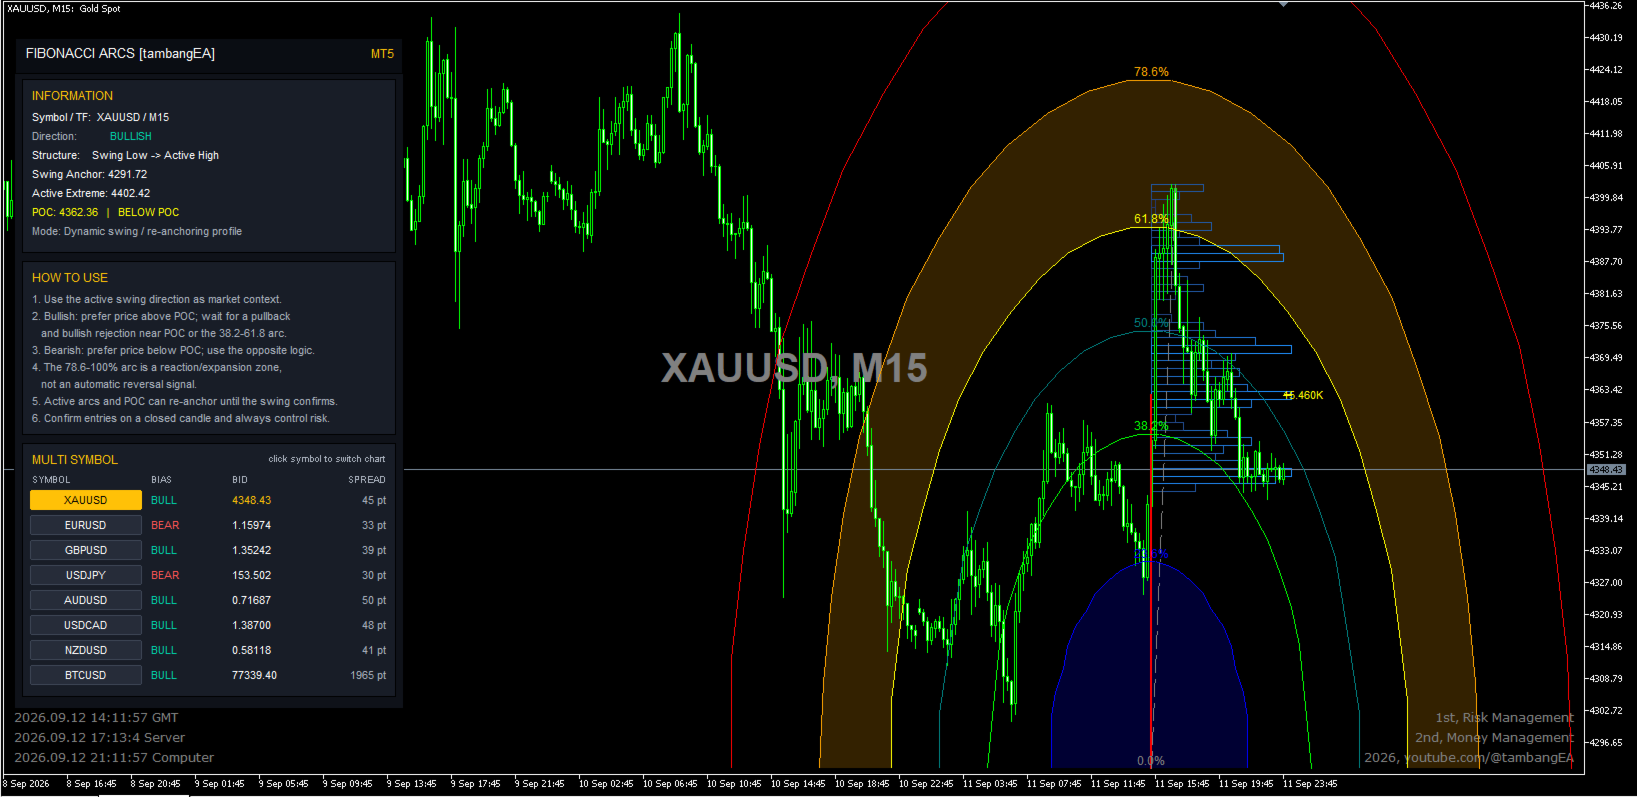
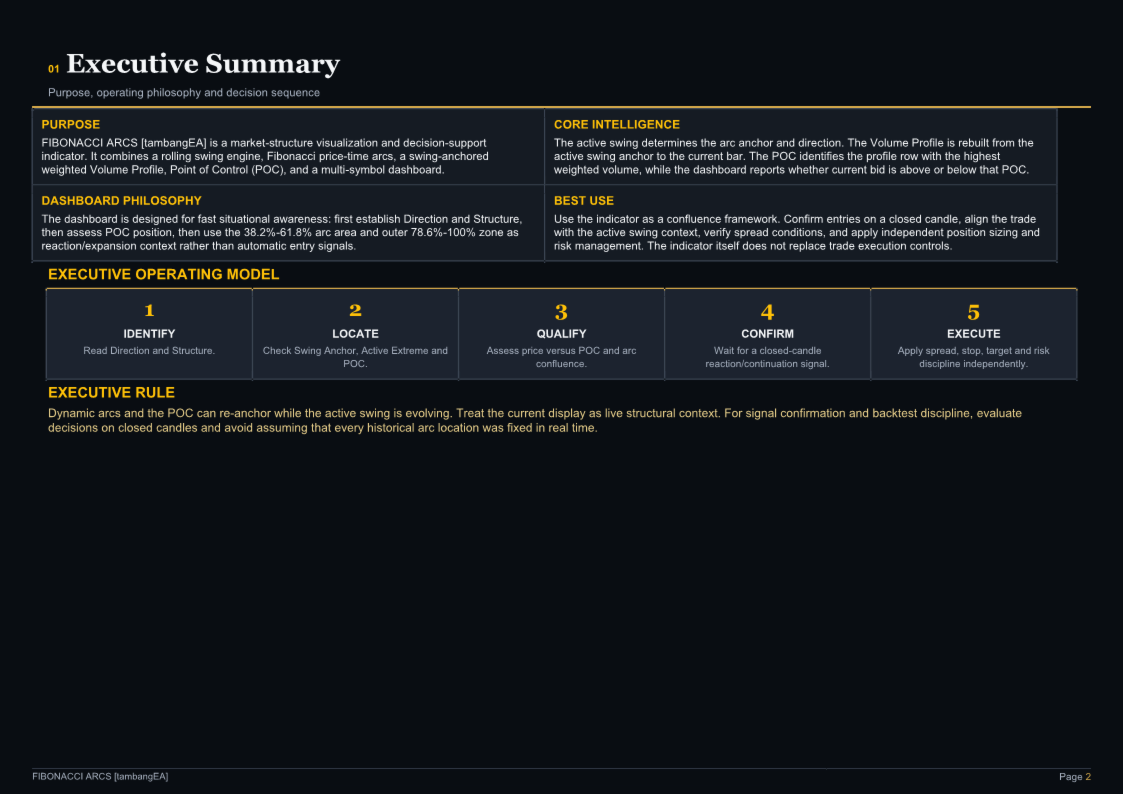
FIBONACCI ARCS [tambangEA] is an advanced market-structure indicator designed to visualize the relationship between price, time, swing geometry, and volume concentration directly on the chart.
Unlike a conventional Fibonacci retracement that displays static horizontal levels, Fibonacci Arcs project curved Fibonacci zones from the active market swing. This allows traders to evaluate how price develops not only vertically, but also through time.
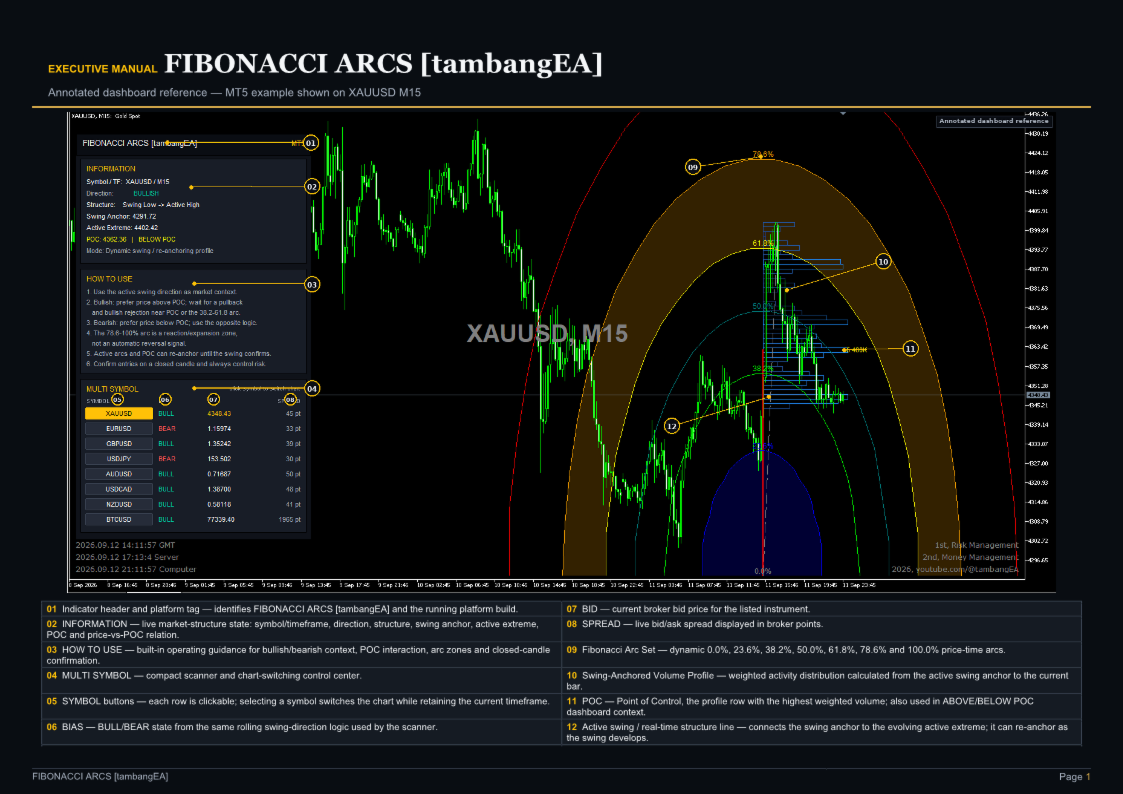
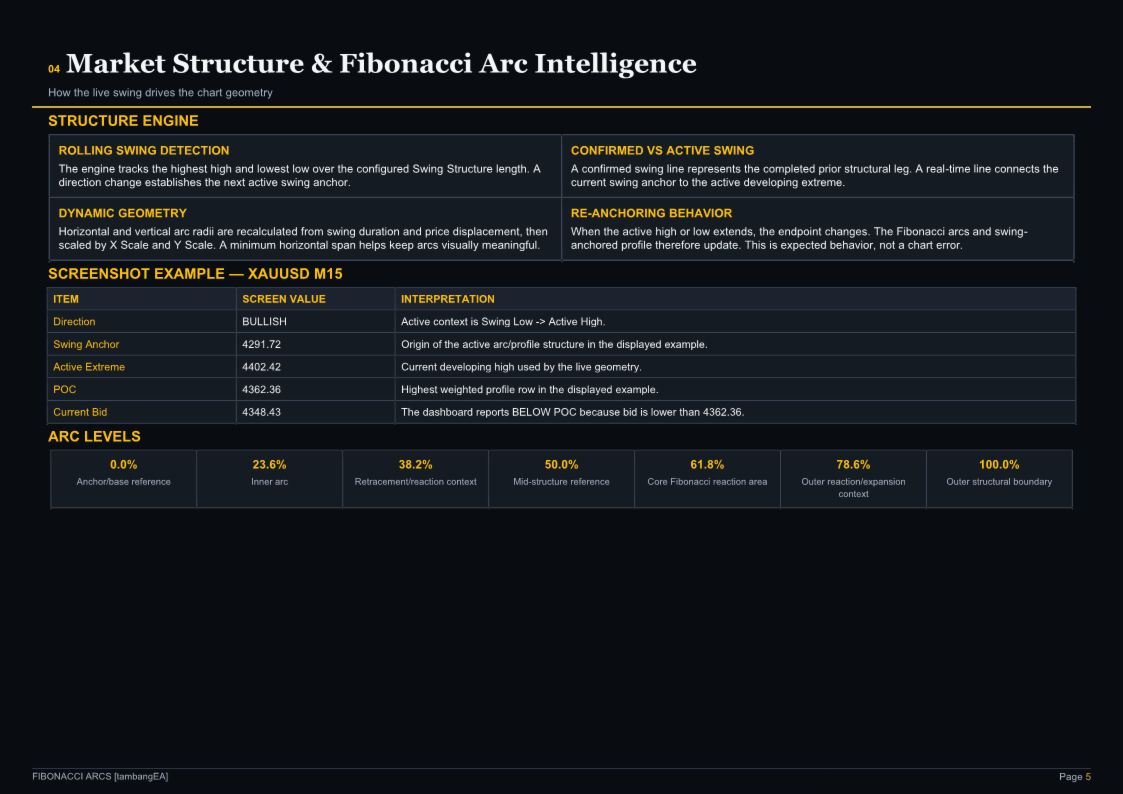
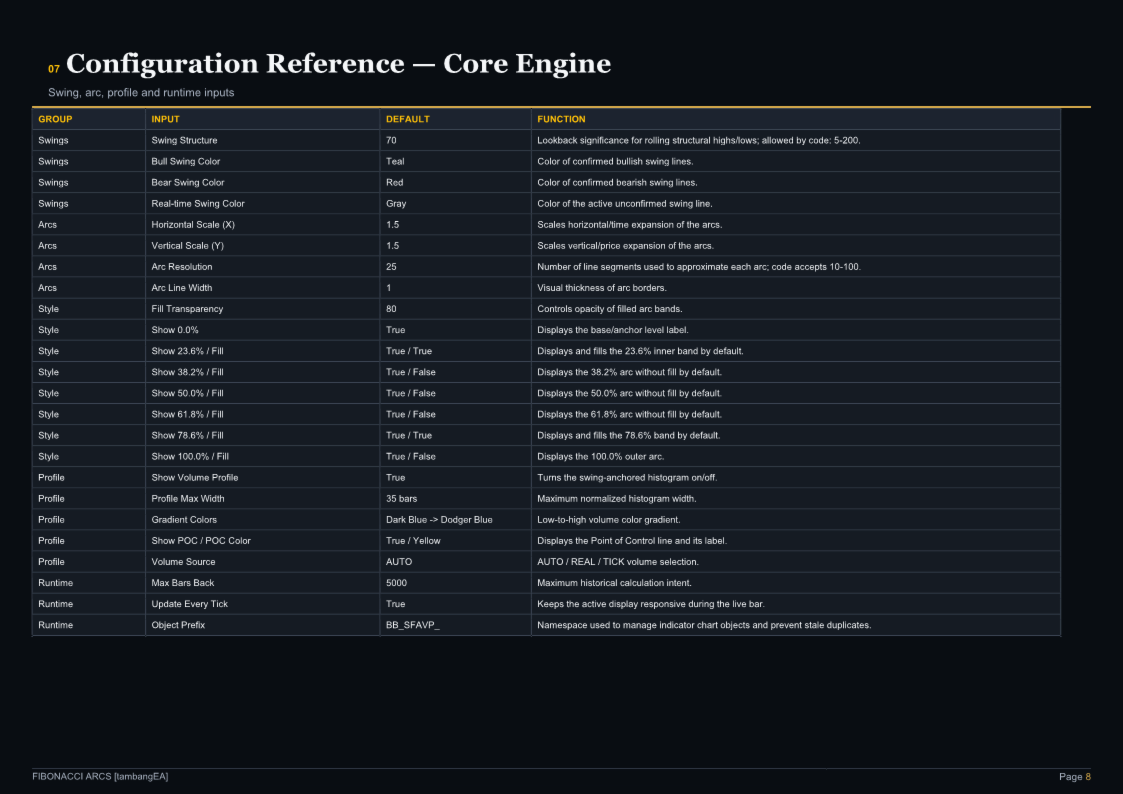
The indicator combines dynamic swing analysis with Fibonacci Arc levels at 0.0%, 23.6%, 38.2%, 50.0%, 61.8%, 78.6%, and 100.0%, together with a swing-based Volume Profile and Point of Control.
Key Features
Dynamic bullish and bearish swing detection
Fibonacci Arc structure based on the active market swing
Fibonacci levels:
0.0 / 23.6 / 38.2 / 50.0 / 61.8 / 78.6 / 100.0
Adjustable horizontal and vertical Arc scaling
Configurable Arc resolution and line width
Optional colored Fibonacci zone fills
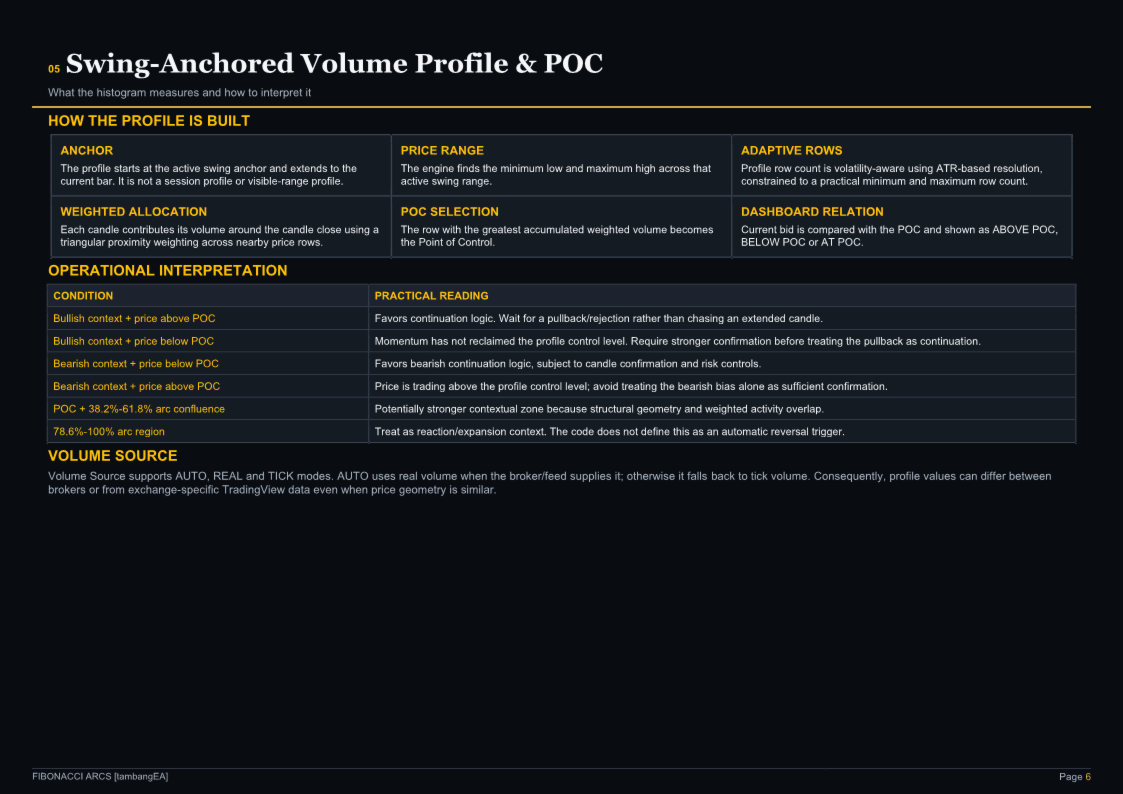
Dynamic Volume Profile anchored to the active swing
Point of Control (POC) identification
Real-time active swing line
Confirmed swing structure visualization
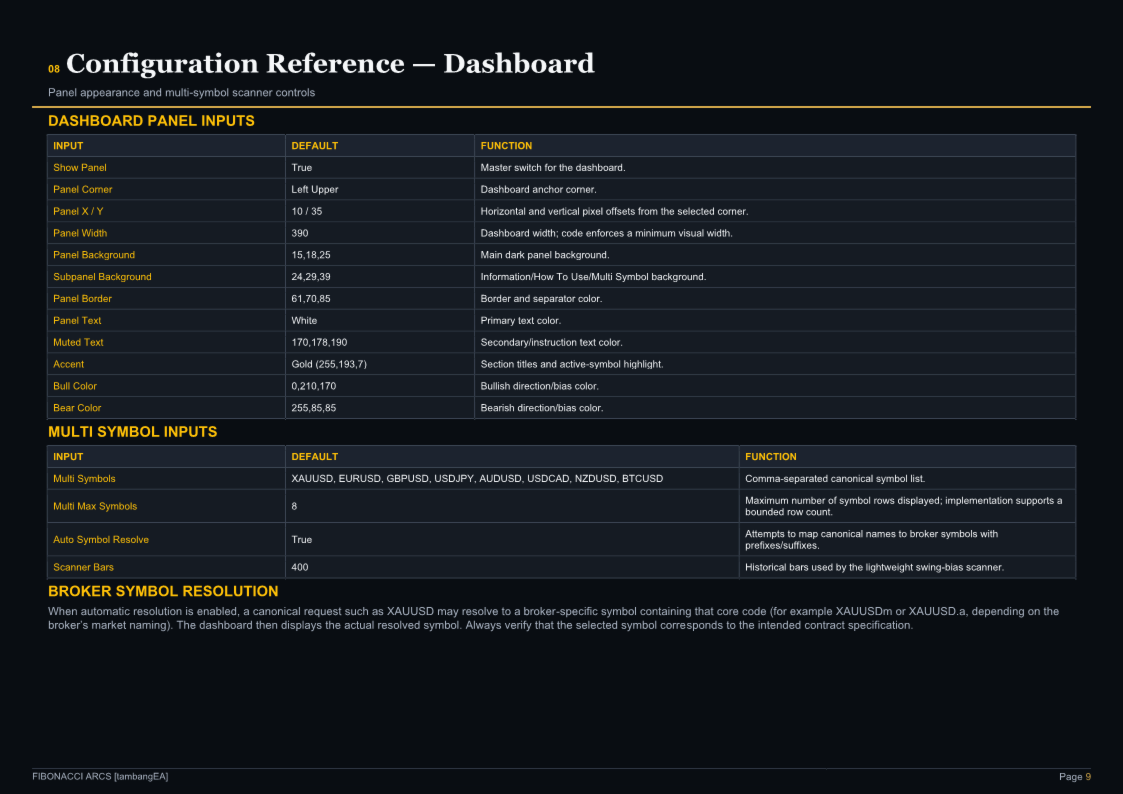
Professional dashboard
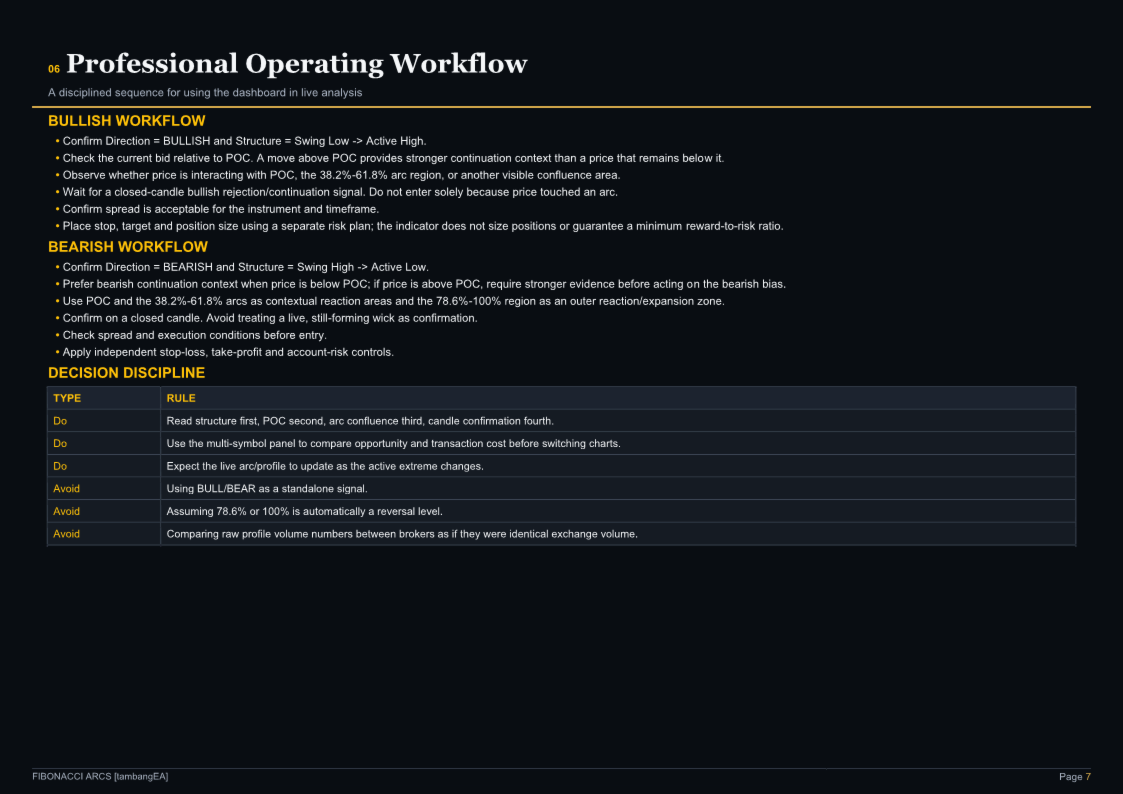
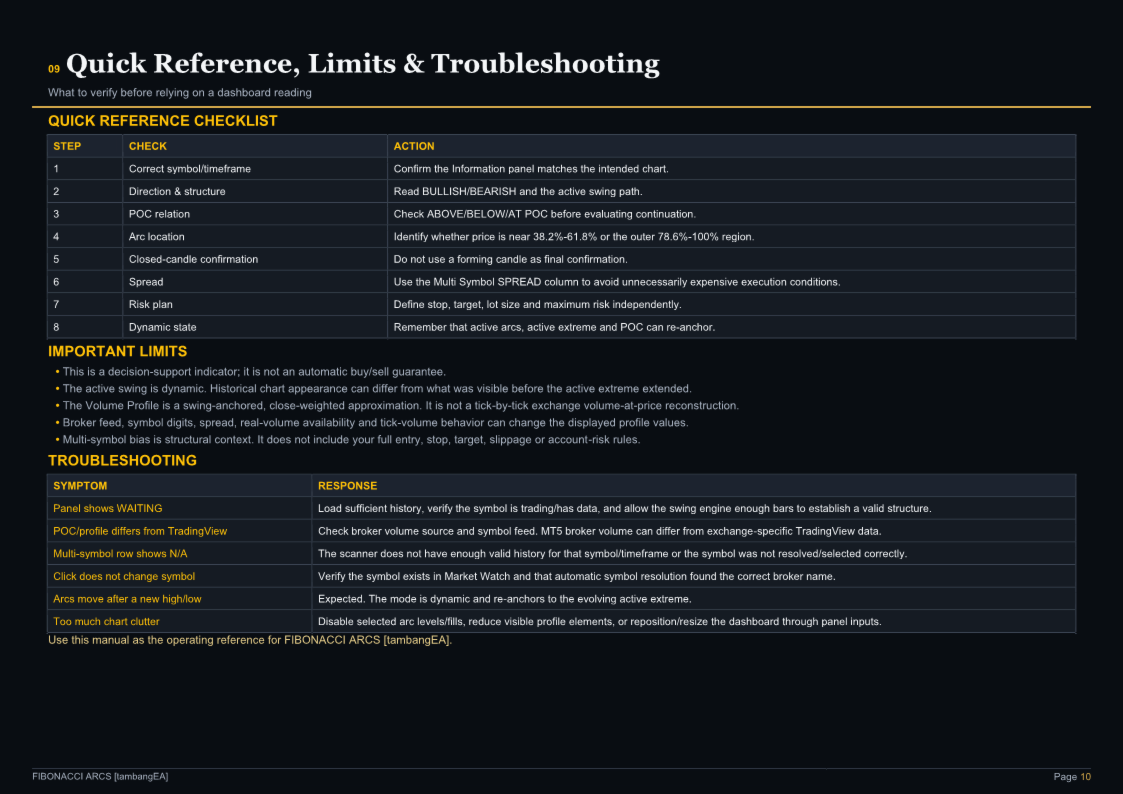
Built-in usage guidance
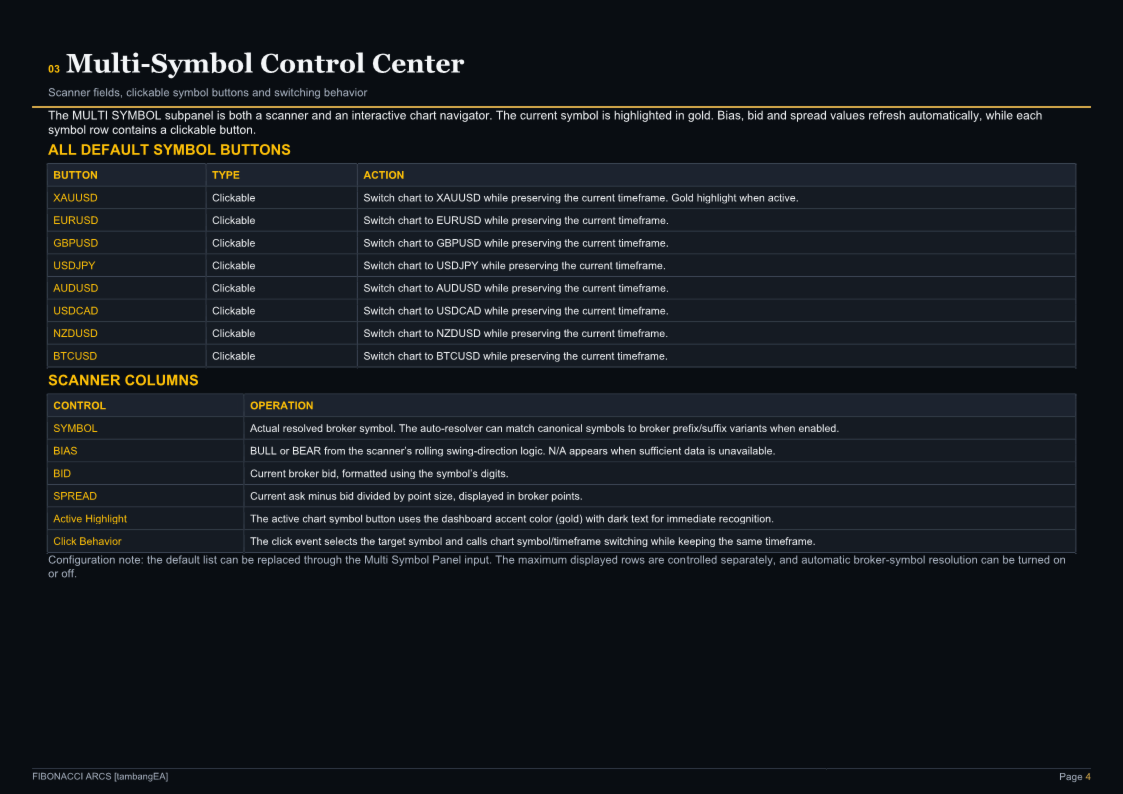
Multi-symbol market scanner
Bullish / Bearish structural bias
Live Bid and Spread information
Clickable symbol buttons for fast chart navigation
Automatic broker symbol prefix/suffix handling
Active-symbol highlighting
The original calculation uses rolling highest/lowest structures to determine market direction and continuously tracks the active swing extreme. As the current swing develops, its endpoint can update dynamically.
Professional Dashboard
The dashboard is divided into three dedicated sections.
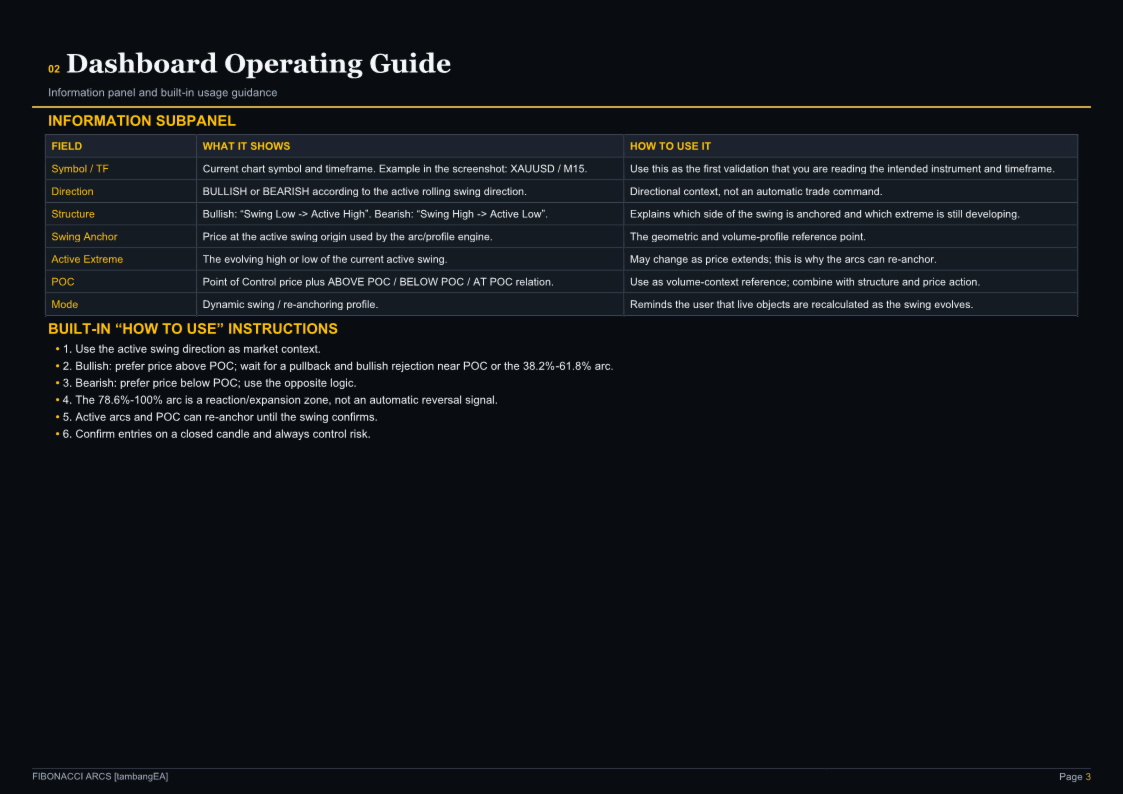
INFORMATION
Provides a real-time overview of the current chart, including:
Symbol and timeframe
Market direction
Current swing structure
Swing Anchor
Active Extreme
Point of Control
Price position relative to POC
Dynamic swing status
Example:
Direction: BULLISH
Structure: Swing Low → Active High
Swing Anchor: 4291.72
Active Extreme: 4402.42
POC: 4362.36 | BELOW POC
This provides an immediate structural overview without requiring the trader to manually identify the current swing.