• Overview
  • Reviews
  • Comments
  • What's new

Market Shaver

Market Shaver


Market Scalper

This indicator is part of the RPTrade Pro Solutions systems.

Market Scalper is a daily trend indicator using Price Action, Dynamic Support and Resistances.
It's designed to be used by anyone, even the absolute beginner in trading can use it.
NEVER repaints.
Indications are given from close to close.
Designed to be used alone, no other indicators are required.
Gives you Clear and simple indications


    How does it work

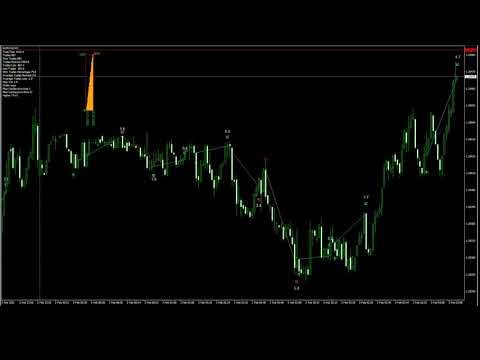
    Market Shaver is using Dual TimeFrames system.
    The main trend is taken by the higher TF while the faster one is used to close the trade
    Trades are indicated one by one, there are never two trades at the same time.

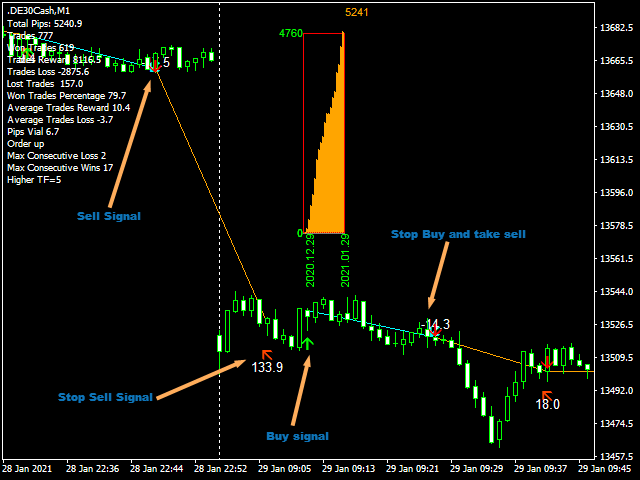
      Market Shaver indicates:

      When to take a trade
      When to stop it, in profit or loss.
      The trade rewards
      Many statistics to help you setting the right Period end TF

        Market Shaver works

        With any instrument like FX pairs, indexes, metals, futures or any other.
        From M1 to H1. 
        With any broker. (Lower spread will leave you more pips)


          Market Shaver  Features

          Reliable Buy / Sell signals.
          Very simple inputs. (Default ones should work for almost every instruments)
          On Screen Alert + Push notifications + Email Notifications
          All notifications are very detailed and give also Take Profit, it allows to trade from a mobile device.
          A profit chart to help you in correct settings


            How to use Market Shaver

            Just put it on your chart(s).
            Simply follow the arrows.


              Inputs

              1. Period: [Integer] Period of the indicator; from 2 to .....
              2. Period 2: [Integer] Period of the indicator; from 1 to ..... The lower value = more multi trades
              3. Higher TF: [TIME FRAME] Choose the slower TF used to enter trades. Always input a higher TF than the Indicator's one.
              4. Show Profit Chart: [Bool] true will show the profit chart, false will hide.
              5. UsePush: [bool] true will send Push notifications
              6. SendAlert: [bool] true will send Alerts

              SPECIAL Warranty of proof:

              Market shaver works without loop and data storage. Means that there are no pre-calculations done. It only works live or in the tester, when you put it on your chart you won't see any indication before the very moment you started it.
              This is the ultimate warranty of proof that the software does not use known data and cannot cheat.


              Recommended products
              Noize Absorption Index MT4
              Ekaterina Saltykova
              5 (1)
              Noize Absorption Index - is the manual trading system that measures the difference of pressure between bears forces and bulls forces. Green line - is a noize free index that showing curent situation. Zero value of index shows totally choppy/flat market.Values above zero level shows how powerfull bullish wave is and values below zero measures bearish forces.Up arrow appears on bearish market when it's ready to reverse, dn arrow appears on weak bullish market, as a result of reverse expectation. S
              Daily Candle Predictor is an indicator that predicts the closing price of a candle. The indicator is primarily intended for use on D1 charts. This indicator is suitable for both traditional forex trading and binary options trading. The indicator can be used as a standalone trading system, or it can act as an addition to your existing trading system. This indicator analyzes the current candle, calculating certain strength factors inside the body of the candle itself, as well as the parameters of
              Blahtech Market Profile
              Blahtech Limited
              4.61 (18)
              Was: $249  Now: $99   Market Profile defines a number of day types that can help the trader to determine market behaviour. A key feature is the Value Area, representing the range of price action where 70% of trading took place. Understanding the Value Area can give traders valuable insight into market direction and establish the higher odds trade. It is an excellent addition to any system you may be using. Blahtech Limited presents their Market Profile indicator for the MetaTrader community. Ins
              The Th3Eng PipFinite indicator is based on a very excellent analysis of the right trend direction with perfect custom algorithms. It show the true direction and the best point to start trading. With StopLoss point and Three Take Profit points. Also it show the right pivot of the price and small points to order to replace the dynamic support and resistance channel, Which surrounds the price. And Finally it draws a very helpful Box on the left side on the chart includes (take profits and Stop loss
              Forex Gump
              Andrey Kozak
              2.83 (6)
              Forex Gump is a fully finished semi-automatic trading system. In the form of arrows, signals are displayed on the screen for opening and closing deals. All you need is to follow the instructions of the indicator. When the indicator shows a blue arrow, you need to open a buy order. When the indicator shows a red arrow, you need to open a sell order. Close orders when the indicator draws a yellow cross. In order to get the most effective result, we recommend using the timeframes H1, H4, D1. There
              Owl smart levels
              Sergey Ermolov
              4.63 (54)
              MT5 version  |  FAQ The Owl Smart Levels Indicator  is a complete trading system within the one indicator that includes such popular market analysis tools as  Bill Williams' advanced fractals , Valable ZigZag which builds  the correct wave structure  of the market, and  Fibonacci levels  which mark the exact levels of entry into the market and places to take profits. Detailed description of the strategy Instructions for working with the indicator Advisor-assistant in trading Owl Helper Private
              Gold Bricks FX USES THE TREND WAVE INDICATOR AND IT CAN IDENTIFY THE BEGINNING AND THE END OF A NEW WAVE TREND MOVEMENT. AS AN OSCILLATOR, THE INDICATOR IDENTIFIES THE OVERBOUGHT AND OVERSOLD ZONES. IT WORKS GREAT TO CATCH THE SHORT TERM PRICE REVERSALS AND USES A MARTINGALE STRATEGY TO CLOSE ALL TRADES IN PROFIT. USE DEFAULT SETTINGS ON H1 OR HIGHER TIME FRAME ON ANY PAIR FOR MORE ACCURATE TRADES WHY THIS EA : Smart entries calculated by 4 great strategies The EA can be run on even a
              Fibonacci retracement and extension line drawing tool Fibonacci retracement and extended line drawing tool for MT4 platform is suitable for traders who use  golden section trading Advantages: There is no extra line, no too long line, and it is easy to observe and find trading opportunities Trial version: https://www.mql5.com/zh/market/product/35884 Main functions: 1. Multiple groups of Fibonacci turns can be drawn directly, and the relationship between important turning points
              Cosmic Diviner X Planet
              Olena Kondratenko
              4 (2)
              This unique multi-currency strategy simultaneously determines the strength of trends and market entry points, visualizing this using histograms on the chart. The indicator is optimally adapted for trading on the timeframes М5, М15, М30, Н1. For the convenience of users, the indicator renders the entry point (in the form of an arrow), recommended take profit levels (TP1, TP2 with text labels) and the recommended Stop Loss level. The take profit levels (TP1, TP2) are automatically calculated for
              Master Scalping M1 is an innovative indicator that uses an algorithm to quickly and accurately determine the trend.The indicator calculates the time of opening and closing positions, the indicator's algorithms allow you to find the ideal moments to enter a deal (buy or sell an asset), which increase the success of transactions for most traders. Benefits of the indicator: Easy to assemble, does not overload the chart with unnecessary information. Can be used as a filter for any strategy. Works on
              Intraday Levels shows intraday levels grid for intraday trading Shows a grid for the day levels, gives you a guide to know the trend and to measure intraday trades (stop-loss and take-profit). Parameters are: Levels Mode: Basic mode: Shows highest, lowest and middle levels. Advanced mode: Shows highest, lowest, middle and intermediate levels. Fibonacci mode: Shows session Fibonacci retracements levels. Momentum mode: Shows delayed Advanced levels to identify momentum. Smooth Period (Momentum
              Heiken Ashi candle chart is an improved version of The Japanese candle chart, which can effectively filter the market "noise" of the Japanese candle chart. It is favored by many traders for its simplicity and intuition. For trend traders, the HA candle chart is a magic tool. Unlike the traditional Japanese candle chart, Heikenashi does not reflect the opening price, high price, low price and closing price of the market. Instead, Heikenashi calculates the value of a single K line in the dominant
              For sure, this indicator has become very popular amongst traders. Through coding this indicator will give you the most accurate levels possible for your trading analysis. We have also added in the ability for you to receive alerts when the price breaks above or below a Support or Resistance lines! HOW TO USE The red rectangles represent your resistance/supply zone. The green rectangles represent your support/demand zone.  BONUS FEATURES We coded this indicator with the ability to switch between
              Point61 Indicator
              Evgeniy Machok
              5 (1)
              The Point61 indicator is the result of many years of monitoring of price behavior of currency pairs and metals. It is not a secret, that in times of uncertainty, traders are looking for possible levels of support and resistance - the point, where price should stop its movement. There are 2 possible scenarios at these points: 1. Reverse (correction) to the opposite direction; 2. Breakthrough to continue movement. Very often these points are used to set stop orders - TakeProfit or
              Title : Market Bias Indicator - Oscillator-Based Trading Tool Introduction : Discover the potential of the "Market Bias Indicator," a revolutionary oscillator-based trading tool designed for precise market analysis. If you're in search of a robust alternative to traditional bias indicators, your quest ends here. Market Bias Indicator offers unparalleled accuracy in identifying market sentiment and is your gateway to confident trading decisions. Recommended Trading Pairs : Market Bias Indicator i
              PZ Trend Trading
              PZ TRADING SLU
              4.75 (4)
              Trend Trading is an indicator designed to profit as much as possible from trends taking place in the market, by timing pullbacks and breakouts. It finds trading opportunities by analyzing what the price is doing during established trends. [ Installation Guide | Update Guide | Troubleshooting | FAQ | All Products ] Trade financial markets with confidence and efficiency Profit from established trends without getting whipsawed Recognize profitable pullbacks, breakouts and early reversals The ind
              The indicator automatically calculates and plots Fibonacci support and resistance levels - one of the most effective tools for market analysis. The calculation uses the averaged price data for the selected period and timeframe. The minimum and maximum for this period are taken as the beginning and end of the movement. Fibonacci levels allow you to see potential reference points, around which the price movement can slow down or reverse, that is, they are used to predict further movement, as well
              This is the FXTraderariel-TakeProfit - Stop Loss Indicator . It provides you 3 potential Take Profits and 1 Stop Loss. These potential targets are computed based on several methods . The indicator can be used on every time frame, but we advise to use it on H1, H4 and D1. Especially if you are a novice trader. Pro Traders can also you use it for scalping in smaller time frames (M1, M5 and M15). This indicator is not a complete trading system. It doesn't provide you a Signal nor can predict the m
              Infinity Trend Pro
              Yaroslav Varankin
              1 (1)
              This is a trend indicator without redrawing Developed instead of the binary options strategy (by the color of the Martingale candlestick) Also works well in forex trading When to open trades (binary options) A signal will appear in the place with a candle signaling the current candle It is recommended to open a deal for one candle of the current timeframe M1 and M5 When a blue dot appears, open a deal up When a red dot appears, open a trade down. How to open trades on Forex. When a signal is rec
              Shark Deal Book
              Philip Pankaj Suthagar
              4 (3)
              Term  "shark"  in the business world denotes a high volume investor who just made a good investment in a highly Potential business deal.So, sharks are the ones who make the market move. In our case, if an American shark bought a Japanese company, he/she has to convert American dollars into Japanese yen to make the deal. So, the demand for the Japanese yen will increase sharply. Thus USD/JPY will go short rapidly if the deal was from the shark. Another example, In the case of forex, if fed increa
              HMA Trend Professional MT4
              Pavel Zamoshnikov
              4.63 (8)
              Improved version of the free HMA Trend indicator (for MetaTrader 4) with statistical analysis. HMA Trend is a trend indicator based on the Hull Moving Average (HMA) with two periods. HMA with a slow period identifies the trend, while HMA with a fast period determines the short-term movements and signals in the trend direction. The main differences from the free version: Ability to predict the probability of a trend reversal using analysis of history data. Plotting statistical charts for analyz
              The indicator displays the data of the Stochastic oscillator from a higher timeframe on the chart. The main and signal lines are displayed in a separate window. The stepped response is not smoothed. The indicator is useful for practicing "manual" forex trading strategies, which use the data from several screens with different timeframes of a single symbol. The indicator uses the settings that are identical to the standard ones, and a drop-down list for selecting the timeframe. Indicator Parame
              Trade with Gann on your side!! MASTER CIRCLE 360 CIRCLE CHART, originally created by Gann admitted that this is “The Mother of all charts”. It is one of the last studies that this great trader left for us. The numeric tab le is apparently quite simple like all the tables and is based on square numbers, the SQUARE OF 12 and is by evolution, one of the most important square numbers. Here we can find CYCLE, PRICE AND TIME thanks to angles and grades, to show past and future support and resistance.
              TWO PAIRS SQUARE HEDGE METER INDICATOR Try this brilliant 2 pairs square indicator It draws a square wave of the relation between your two inputs symbols when square wave indicates -1 then it is very great opportunity to SELL pair1 and BUY Pair2 when square wave indicates +1 then it is very great opportunity to BUY pair1 and SELL Pair2 the inputs are : 2 pairs of symbols         then index value : i use 20 for M30 charts ( you can try other values : 40/50 for M15 , : 30 for M30 , : 10 for H1 ,
              VR Cub
              Vladimir Pastushak
              VR Cub is an indicator for getting high-quality entry points. The indicator was developed to facilitate mathematical calculations and simplify the search for entry points into a position. The trading strategy for which the indicator was written has been proving its effectiveness for many years. The simplicity of the trading strategy is its great advantage, which allows even novice traders to successfully trade with it. VR Cub calculates position opening points and Take Profit and Stop Loss targe
              How to use Pair Trading Station Pair Trading Station is recommended for H1 time frame and you can use it for any currency pairs. To generate buy and sell signal, follow few steps below to apply Pair Trading Station to your MetaTrader terminal. When you load Pair Trading Station on your chart, Pair Trading station will assess available historical data in your MetaTrader platforms for each currency pair. On your chart, the amount of historical data available will be displayed for each currency pai
              What are Heiken Ashi Candles? Heiken Ashi, derived from the Japanese term 'Heikin Ashi,' translates to average price bars. It's an indicator depicting price bars on a chart. Formula for Heiken Ashi candles: - Heiken Ashi opening price: (previous candle's opening + closing price) / 2 - Closing price Heiken Ashi: (opening + high + low + closing) / 4 - Heiken Ashi peak: Max of high, opening, or closing price - Heiken Ashi bottom price: Min of low, opening, or closing price How to Read Heik
              Advanced Trend Regime
              Shellard Securities (Pty) Ltd
              The indicator has been designed to function on any time-frame and any pair.   This regime filter will help the trader better evaluate whether the current market is trending, and in which direction. It quickly reacts to changes in market dynamics using a series of advanced calculations. The user is able to select whether the calculation remains standard, or if a further filter constraint is added to the calculation.   A Yellow moving average of the signal has been included for the trader to smoot
              Price Breakout pattern Scanner is the automatic scanner for traders and investors. It can detect following patterns automatically from your chart. Head and Shoulder - Common tradable pattern. Reverse Head and Shoulder - This pattern is the reverse formation of the Head and Shoulder. Double Top - When the price hits resistance level twice and decline toward the support level, the trader can anticipate sudden bearish breakout through the support level. Double Bottom - The double bottom pattern is
              Stepping Trend
              Mpendulo Chiliza
              The Stepping Trend Indicator     The Steppi ng Trend indicator uses the  average true range  (ATR indicator) in its calculation. This gives you control to set your own average true range period, I set the Default as 10.   Indicator Details. Green Arrow Up: This means you are at the starting point of a new bullish trend, it’s time to buy.   Red  Arrow  Down : This means you are at the starting point of a new  bearish  trend, it’ s time to sell .   What if you miss the Arrow Signal?   No
              Buyers of this product also purchase
              Introducing the Miraculous Forex Indicator: Unleash the Power of Precision Trading Are you tired of searching for the perfect forex indicator that truly delivers exceptional results across all time frames? Look no further! The Miraculous Forex Indicator has arrived to revolutionize your trading experience and propel your profits to new heights. Built upon a foundation of cutting-edge technology and years of meticulous development, the Miraculous Forex Indicator stands as the pinnacle of str
              TrendMaestro
              Stefano Frisetti
              5 (2)
              note: this indicator is for METATRADER4, if you want the version for METATRADER5 this is the link: TRENDMAESTRO recognizes a new TREND in the bud, he never makes mistakes. The certainty of identifying a new TREND is priceless. DESCRIPTION TRENDMAESTRO identifies a new TREND in the bud, this indicator examines the volatility, volumes and momentum to identify the moment in which there is an explosion of one or more of these data and therefore the moment in which prices have strong probability of f
              Gann Signal
              Kirill Borovskii
              Gann Signal is a very simple indicator at first glance, but hidden inside is many years of experience in studying W.D.Ganna methods. The indicator gives accurate BUY/SELL signals, without redrawing. The indicator is very easy to use. All you need to do is attach it to your chart and follow its recommendations. The indicator constantly analyzes the market for entry opportunities. When such an opportunity appears, the indicator gives a signal in the form of an arrow. I repeat, all signals are NOT
              Gann Swing Structure
              Kirill Borovskii
              5 (1)
              This indicator is based on the mathematics of the great trader W.D. Ganna. With its help, you can easily find strong levels by analyzing swings to find the optimal entry point. The indicator works on all instruments and all timeframes. The indicator is fully manual and has control buttons. All you need to do is press the NEW button, a segment will appear, which you can place on any movement, swing or even 1 candle that you want to analyze. By placing the segment, press the OK button. A grid (th
              ON Trade Optuma Astro
              Abdullah Alrai
              5 (4)
              This is an astronomy indicator for the MT4 platform like optuma program that performs a variety of functions. It uses complex algorithms to perform its own calculations, which are so accurate. The indicator has a panel that provides astronomical information such as planets' geo/heliocentric cords, distance of sun/earth, magnitude, elongation, constellation, ecliptic cords, equatorial cords, and horizontal cords depending on  the vertical line that generated by the indicator depend on the time va
              Weis Wave with Alert
              Trade The Volume Waves Single Member P.C.
              4.79 (19)
              Rental/Lifetime Package Options and Privileges' * For optimum results the yearly or lifetime package is suggested due to live training and Discord  channel trading with the  creator! Rent Monthly Six Months   Yearly/Lifetime Weis Wave with Speed with Alert+Speed Index x x x Manual  x x x Quick Set up Video x x x Blog x x x Lifetime Updates x x x Setup and Training Material x x Free Rectangle Break Alert Tool      x Discord Access Channel "The SI traders" x 2-hour live methodology traini
              The indicator is designed to work on any trading platform. The program is based on proprietary algorithms and W.D.Ganna's mathematics, allowing you to calculate target levels of price movement based on three points with the highest degree of certainty. It is a great tool for stock trading. The indicator has three buttons: NEW - call up a triangle for calculation. DEL - delete the selected triangle. DELS - completely remove all constructions. The probability of achieving the goals is more than 80
              Please send me Direct message on MQL5 CHAT after purchasing the Indicator for Training and Installation Support There are some additional files that is important to use with the Indicator . So be sure to contact me after purchasing the Indicator So that I can add you for training and support . If you find any difficulty with installation then send me Direct message here So that I can connect with you via Anydesk or Teamview for the product installation. " Smart Order Block Indicator " to find
              The BB Reversal Arrows technical trading system has been developed to predict reverse points for making retail decisions. The current market situation is analyzed by the indicator and structured for several criteria: the expectation of reversal moments, potential turning points, purchase and sale signals. The indicator does not contain excess information, has a visual understandable interface, allowing traders to make reasonable decisions. All arrows appear to close the candle, without redr
              The breakout algorithm is a technique based on price, price features, to shape a breakout strategy. The strategy in this indicator will not be redrawn (none-repaint indicator), it is suitable for short or long term traders In the screenshot is the EURUSD pair, these currency pairs, commodities or stocks, it have similar strength *Non-Repainting (not redrawn) *For Metatrader4 Only *Great For Scalping *Great For Swing Trading *Arrow Entry, Green is Long, Red is Short *Works On Any Timeframe *Work
              Indicator : RealValueIndicator Description : RealValueIndicator is a powerful tool designed specifically for trading on the EURUSD pair. This indicator analyzes all EUR and USD pairs, calculates their real currency strength values, and displays them as a single realistic value to give you a head start on price. This indicator will tell you moves before they happen if you use it right. RealValueIndicator allows you to get a quick and accurate overview of the EURUSD currency pair tops and bottoms,
              IA Trendx3 PRO
              Marco Aurelio Santos Costa
              What if God Created a Trade System? No miracles... Just see how mathematics can be effective in the market. We managed to combine technical analysis / price action into indicators, creating the best setup for trading, be it in Forex, Indices, or stocks. It took us 2 years to create something that really works, and now it's time for you to discover it. TrendX3 is a revolution in trend analysis. Based on advanced algorithms and real-time data, it provides valuable insights so that you can make inf
              System Trend Pro
              Aleksandr Makarov
              System Trend Pro - This is the best trend trading indicator!!! The indicator no repaint!!!   The indicator has   MTF   mode, which adds confidence to trading on the trend (   no repaint   ). How to trade? Everything is very simple, we wait for the first signal (big arrow), then wait for the second signal (small arrow) and enter the market in the direction of the arrow. (See screens 1 and 2.) Exit on the opposite signal or take 20-30 pips, close half of it, and keep the rest until the oppo
              Full Forex Market View Dashboard
              Opengates Success International
              5 (2)
              FULL FOREX MARKET VIEW Dashboard Indicator This is a custom indicator created to give Traders a full view of what is going on in the market. It uses a real time data to access the market and display every bit of information needed to make successful trading. INSTALLATION : Before attaching this Indicator to your window chart, go to your MT4's Market Watch panel and HIDE all the Currency pairs you don't need or trade and leave the rest there. The reason is that FFMV Dashboard will DISPLAY ALL the
              A. What is A2SR ?   * It's a leading technical indicator (no repaint, no lagging). -- Guidance : -- at   https://www.mql5.com/en/blogs/post/734748/page4#comment_16532516 -- and  https://www.mql5.com/en/users/yohana/blog A2SR has a special technique in determining the levels of Support ( demand ) and Resistance ( supply ) . Unlike the ordinary way that we seen on the net, A2SR has a original concept in determining actual SR levels. The original technique was not taken from the internet,
              SMCpro VIP MT4  Original Price  $620   ---  Currently Price 20% OFF ( for unlimited use )   BONUS  AUX VIP Club 2024 : Include  EA Airbag  and  Load Data History  to enhance the performance of this tool to its maximum potential  Click Here to Download Files   ( for users only )   Hello World! Introducing.. SMCpro VIP tool and Indicator for MetaTrader 4, designed to revolutionize your trading experience with the ICT Smart Money Concept. This system is meticulously crafted to empower trad
              Candle Power Pro
              Thushara Dissanayake
              4.33 (6)
              Unlock the power of real volume information with the Candle Power Pro indicator. This dynamic tool captures the actual volume data for each candle and presents it as a percentage of the total volume. By doing so, it empowers you to discern the ongoing struggle between buyers and sellers in the market. The Candle Power Pro displays the battle between buyers and sellers as a percentage of the total volume, giving you valuable insights into market dynamics. You can easily confirm breakouts by anal
              Market Breaker Updated version 3
              Allistair Kabelo Mandow
              1 (1)
              Features for software Main functions: Accurate entry signals WITHOUT REPAINTING! Once a signal appears, it remains valid! This is a significant distinction from repainting indicators that might provide a signal and then alter it, potentially leading to deposit losses. Now, you can enter the market with higher probability and precision. There's also a function to colour candles after an arrow appears until the target (take profit) is reached or a reversal signal appears . Display of STOP LOSS
              Gold Channel is a volatility-based indicator, developed with a specific timing algorithm for the XAUUSD pair, which consists of finding possible corrections in the market. This indicator shows two outer lines, an inner line (retracement line) and an arrow sign, where the theory of the channel is to help identify overbought and oversold conditions in the market. The market price will generally fall between the boundaries of the channel. If prices touch or move outside the channel it is a tra
              Connect Indicator
              Sukunthakan Ngernbamrung
              Connect Indicator is a tool used for connecting indicators between the MQL market and MT4. The connected indicators are made by our group and can be used for other applications, such as sending messages to the Line application or Telegram application. If you have any questions, please don't hesitate to ask us to receive support. Function and indicator buffer Buffer one is the high price of the previous candle. Buffer two is the high price of the previous candle. Usage To connect indicators to fu
              Idea: RSI ( Relative Strength Index) and CCI ( Commodity Channel Index ) are powerfull to solved the market.  This indicator has Smoothed Algorithmic signal of RSI and CCI. So that, it separates the market into buy and sell zones, these areas are marked with arrows, red for downtrend, green for uptrend. This algorithm has the effect of predicting the next trend based on the historical trend, so users need to be cautious when the trend has gone many candles. Please visit screenshots
              Chaos Indicator
              Stefano Frisetti
              DESCRIPTION The CHAOS INDICATOR has been developed to be used for the TRADING STRATEGY OF CHAOS, as described in the book. The book is in italian language only and can be obtained only on my website indicated below. DATAS COLLECTED AND SHOWN ON GRAPHS The CHAOS INDICATOR apply easily to any graph and any asset, and it is a TRADING FACILITATOR, as it identify immediately the following items on any graph: - The GP (= RIGHT PRICE) i.e. the price to which the asset should be attracted within 24
              Unleash the Power of Profitable Binary Option Trading with the "Eagle Eye Indicator" for MT4 Prepare to embark on a game-changing journey in the realm of binary option trading with the awe-inspiring "Eagle Eye Indicator" for MetaTrader 4 (MT4). This revolutionary tool is poised to revolutionize your trading experience, infusing it with laser-focused precision and unrivaled profitability. Step into a world where the boundaries of potential are shattered and profits are maximized, thanks to t
              PZ Swing Trading
              PZ TRADING SLU
              5 (4)
              Swing Trading is the first indicator designed to detect swings in the direction of the trend and possible reversal swings. It uses the baseline swing trading approach, widely described in trading literature. The indicator studies several price and time vectors to track the aggregate trend direction and detects situations in which the market is oversold or overbought and ready to correct. [ Installation Guide | Update Guide | Troubleshooting | FAQ | All Products ] Profit for market swings with
              PZ Divergence Trading
              PZ TRADING SLU
              5 (3)
              Tricky to find and scarce in frequency, divergences are one of the most reliable trading scenarios. This indicator finds and scans for regular and hidden divergences automatically using your favourite oscillator. [ Installation Guide | Update Guide | Troubleshooting | FAQ | All Products ] Easy to trade Finds regular and hidden divergences Supports many well known oscillators Implements trading signals based on breakouts Displays suitable stop-loss and take-profit levels Configurable oscill
              Full STO
              Roman Smoroda
              Full STO indicator (includes all versions of three STO indicators: Premium, Gold, Silver) - STABLE TRADE OPTION is designed for automatic binary options trading.  READ CAREFULLY!!!!! IMPORTANT In one terminal create two templates with different expirations, a template for 18:01, 18:02 with expirations from 1 to 15 minutes and a template for 22:00 with expirations from 10 to 20 minutes. Winrate: 71% over the past 5 years Money management: 0.3% from the deposit This version of the indic
              Gann Zone Pro
              Kirill Borovskii
              This indicator identifies and displays zones, as it were areas of strength, where the price will unfold. The indicator can work on any chart, any instrument, at any timeframe. The indicator has two modes. The indicator is equipped with a control panel with buttons for convenience and split into two modes. Manual mode: To work with manual mode, you need to press the NEW button, a segment will appear. This segment is stretched over the movement and the LVL button is pressed. The level is displayed
              EZT Trend
              Tibor Rituper
              4 (1)
              The EZT Trend indicator will show you the trend, the pullback and the entry opportunities. Optional filtering and all type of alerts are available. E-mail and push notification alerts are added. We are also developing an EA based on this indicator, which will be available soon. It is a multi-functional indicator consisting of two color histograms and a line. It is a visual representation of a trend direction and strength, also you will find divergence many times, either on the line or on the his
              This is a trend Predictor. Honestly I have to give some credit to some few developers I know personally because they helped pulled this off.  The trend indicator uses special optics to direct the flow of price . it detects where the trend is moving into  It uses price action and a few other embedded custom indicator. You can use it in all timeframes and will be available at a much cooler price.  Please test this Indicator before buying to make sure you like what you see. I can't guarantee th
              The 5X target indicator is an indicator that plots the optimal entry zone and the target for the trading day. It also plots a level where the stoploss can be moved to breakeven for a risk free trade which is 2X. This indicator has time window inputs. The default settings are from 02:00 to 19:00 CET+1 time zone. This indicator is based used with a direction bias for the day. I post the direction bias for several pairs in the comments section. Added a new feature Time Zone to help trade the highes
              More from author
              Netting Scalper
              Remi Passanello
              5 (2)
              This robot is part of the   RPTrade Pro Solutions  systems. Netting Scalper  is a fast trading robot using ticks dynamics and netting system.  It's designed to be used by anyone, even the absolute beginner in trading can use it. Designed for M1 ONLY Uses Takes Profit, Stop Loss and Trailing stop. Can also work as a switch without SL/TP Works with any pairs How does it work Netting Scalper is a fast M1 scalper.  It's not using any indicator. It follows brokers' ticks distribution. Tra
              TrendSwift
              Remi Passanello
              TrendSwift   It's designed to be used by anyone, even the absolute beginner in trading can use it. NEVER repaints . Indications are given   from close to close . Designed to   be used alone , no other indicators are required. How does it work TrensSwift is using an internal trend indicator combined with a price action and Fibonacci system. The strategy is stricly applied without any post recalculations, smoothing or interpolation. The "success" of the strategy can be checked inst
              PipsMinerFast
              Remi Passanello
              3 (2)
              PipsMinerFast is mainly a trend follower with a bit of price action. At first sight, you will think: "Oh well, one more indi showing everything I've missed today but not giving a clue about what will happen..." Okay, you can believe this when just looking at it but start a test it and you will see that PipsMinerFast: Shows you the trend immediately Is not repainting Has minimum lagging Counts pips immediately Adapts to your spread level Works from M1 to H1 Is heading in the right direction 90% o
              Scalp Tool
              Remi Passanello
              5 (1)
              Scalp Tool is a very efficient counter trend indicator. It's designed to be used by anyone, even the complete newbie in trading can use it. Scalp Tool does not repaint . Indications are given from close to close or from close to a visible level. Scalp tool can be used alone , no other indicators are required. Scalp Tool indicates Where to open your trades. When to close them. Where to place stop orders. With an accuracy over 80% during live testing. Scalp Tool works With any instrume
              Trend Wave
              Remi Passanello
              5 (5)
              Trend Wave is an advanced trading tool; trend and counter trade indicator based on Supports and Resistances. Trend Wave is designed to have an active trading at any time Trend Wave is not lagging Indications are given at the beginning of a new candle Trend Wave indicates The Indicator's window shows you the actual count of S and R to get the overall trend The white line shows the instant trend. On the main chart window, colored arrows are displayed to show the last valid S and R. This a
              Trend Compound
              Remi Passanello
              3 (2)
              Trend Compound is a trend indicator using a mix of 3 internal other indicators. Please have a look at "how to test in the tester" at the bottom of this page before to test. It's designed to be used by anyone, even the complete newbie in trading can use it. Trend Compound does not repaint . Indications are given from close to close. Trend Compound can be used alone , no other indicators are required. Trend Compound indicates Where to open your trades. When to close them. The potential quantity
              Breakout Pro Scalper Solution This indicator is part of the   RPTrade Pro Solutions  systems. Breakout Pro Scalper Solution   is a daily trend indicator using Price Action, Dynamic Support and Resistances. It's designed to be used by anyone, even the absolute beginner in trading can use it. NEVER repaints . Indications are given  from close to close . Designed to  be used alone , no other indicators are required. Gives you the trend and potential Take Profit at the beginning of the day.
              Waxter D1
              Remi Passanello
              WAXTER D1 This robot is part of the   RPTrade Pro Solutions  systems. WAXTER   is a robot using trend indicators, oscillator and price action. It's designed to be used by anyone, even the absolute beginner in trading can use it. Mainly Designed for D1, can also eventually be used in H4 Uses Takes Profit, Stop Loss and Trailing stop. Can also work as a switch without SL/TP Features a Martingale and Anti Martingale system for the players. Works with any pairs Lot of .Set files available.
              BPSPanel
              Remi Passanello
              BPS Panel Breakout Pro Scalper Solution Panel This indicator is part of the   RPTrade Pro Solutions  systems. BPS Panel   is a daily trend indicator using Price Action, Dynamic Support and Resistances. It's designed to be used by anyone, even the absolute beginner in trading can use it. NEVER repaints . Indications are given   from close to close . Designed to   be used alone , no other indicators are required. Gives you the trend and potential Take Profit at the beginning of the day. How
              Daily Trend Scalper (DTS) This indicator is part of the   RPTrade Pro Solutions  systems. DTS  is a daily trend indicator using Price Action, Dynamic Support and Resistances. It's designed to be used by anyone, even the absolute beginner in trading can use it. NEVER repaints . Indications are given  from close to close . Designed to  be used alone , no other indicators are required. Gives you the trend and potential Take Profit at the beginning of the day. How does it work DTS   is us
              The Daily Trader   This indicator is part of the   RPTrade Pro Solutions  systems. The daily Trader  is a daily indicator using only statistics. It's designed to be used by anyone, even the absolute beginner in trading can use it. NEVER repaints . Indications are given  from close to close . Designed to  be used alone , no other indicators are required. Gives you Clear and simple indications How does it work The statistical system analyses the history to find redundancy in symbols behav
              GannRS Trend Scalper   GannRS is an advanced trading tool based on Gann Law and Supports and Resistances. designed to have an   active trading at any time not lagging Indications are given at the beginning of a new candle Please watch the full tutorial video. How to use GannRS Very easy to set up... Put it on your chart Adjust inputs Inputs Show Resistance and support : [bool]  true = Shows R/S on chart false = does not show Show Levels :[bool]  true = Shows levels on the chart false = doe
              This indicator is part of the   RPTrade Pro Line   systems. Trendy scalper a short trend indicator using Price Action. It's designed to be used by anyone, even the absolute beginner in trading can use it. NEVER repaints . Indications are given   from close to close . Designed to   be used alone , no other indicators are required. A specific graph shows you the profit and eventual drawdown according to history data. How does it work Scalper Pro Line is using an internal trend indicator co
              UniversalTrader
              Remi Passanello
              4.64 (11)
              Universal Trader (UT) This EA is part of the  RPTrade Pro Solutions  systems. UT  is a trading robot using a trend and oscillator indicators.  It's designed to be used by anyone, even the absolute beginner in trading can use it. Designed for every TimeFrames Uses Takes Profit, Stop Loss and Trailing stop. Can also work as a switch without SL/TP Works with any pairs How does it work UT is a trend follower.  It's using A build in Supertrend Indicator to find trades entries and Parabolic SAR to
              GannRS Trend Scalper   GannRS is an advanced trading tool based on Gann Law and Supports and Resistances. designed to have an   active trading at any time not lagging Indications are given at the beginning of a new candle Please watch the full tutorial video. How to use GannRS Very easy to set up... Put it on your chart Adjust inputs Inputs Show Resistance and support : [bool]  true = Shows R/S on chart false = does not show Show Levels :[bool]  true = Shows levels on the chart false = doe
              Straddle Scalper
              Remi Passanello
              Overview: Straddle scalper is an EA opening straddles at particular hours and /or days. The Take Profit is dynamically generated using ATR ratio. Requirements: A hedging account is needed in order to open straddles. A strict optimization (in open prices) is mandatory. What is a straddle ? A straddle is the action to open a Buy and a Sell at the same time. How does this EA works ? After being successfully optimized, the EA will open a straddle at each new bar (H1 Timeframe) designated by optimi
              Filter:
              No reviews
              Reply to review
              Version 3.0 2021.06.15
              Bug solved.
              New Multi trades feature added.
              Version 2.0 2021.05.27
              Arrows Bug Fixed