Dual Regression
- Indicators
-
Agus Santoso
 DISCLAIMER ON : The author of EA will not be held responsible for your losses or problems of any kind if the EA is directly or indirectly responsible for any losses.
Our software is provided “as is”, without any warranty or condition of any kind, express, implied or statutory. - Version: 1.0
- Activations: 5
MQL5 Blogs : https://www.mql5.com/en/blogs/post/771566
MT4 Version : https://www.mql5.com/en/market/product/181554
MT5 Version : https://www.mql5.com/en/market/product/181555
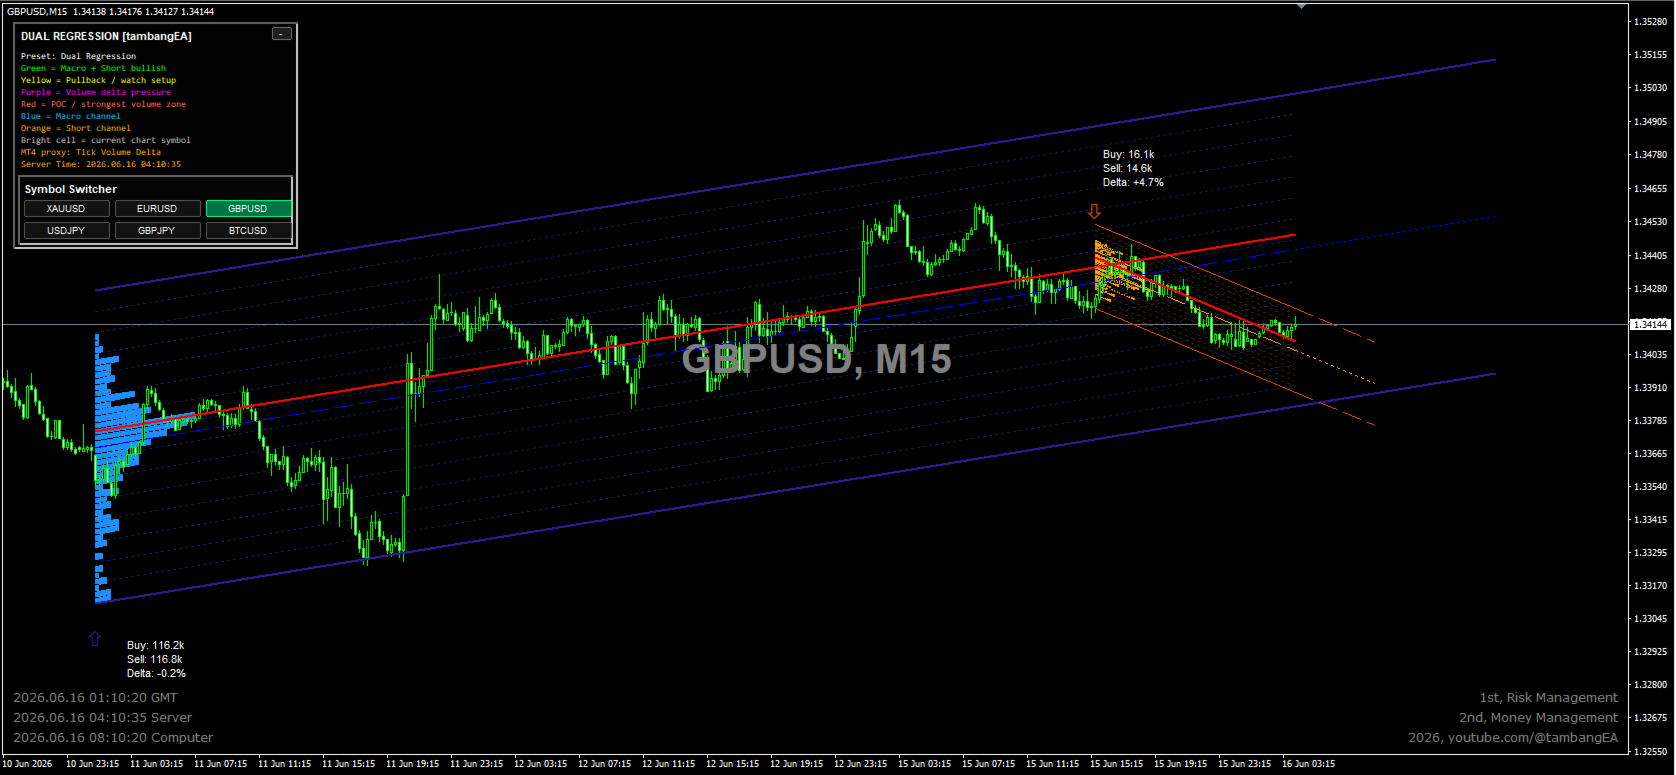
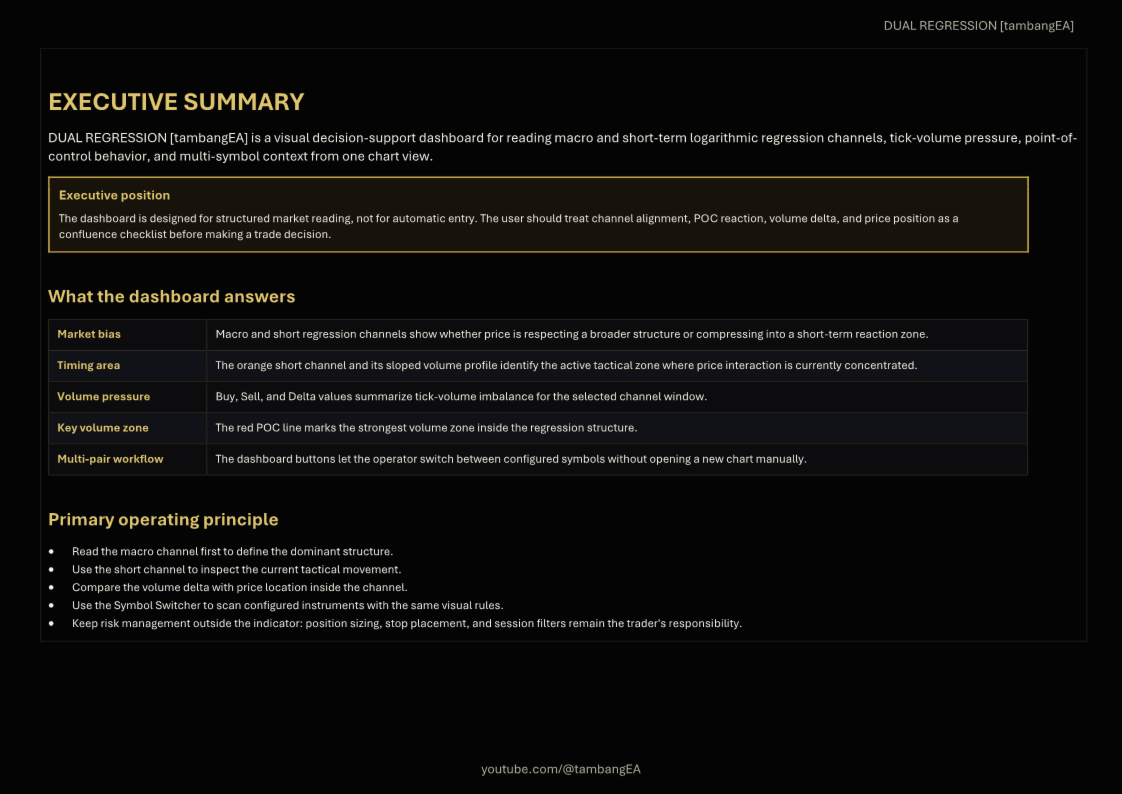
DUAL REGRESSION [tambangEA] is a professional market-structure indicator designed to help traders read price movement through dual logarithmic regression channels, volume behavior, and multi-pair dashboard monitoring.
The indicator combines a macro regression channel for broader market direction with a short-term regression channel for active trading-zone analysis. It also includes sloped volume profile visualization, Point of Control reference, Buy/Sell tick-volume statistics, Delta pressure, directional arrows, and a compact dashboard panel for fast chart interpretation.
This tool is designed for traders who want a clean visual framework for market structure, channel behavior, and volume pressure without using automatic trading logic.
Key Features:
Dual Regression Channel System
The indicator displays two regression structures:
Macro Channel for broader market context.
Short Channel for short-term price action and tactical analysis.
Macro Channel
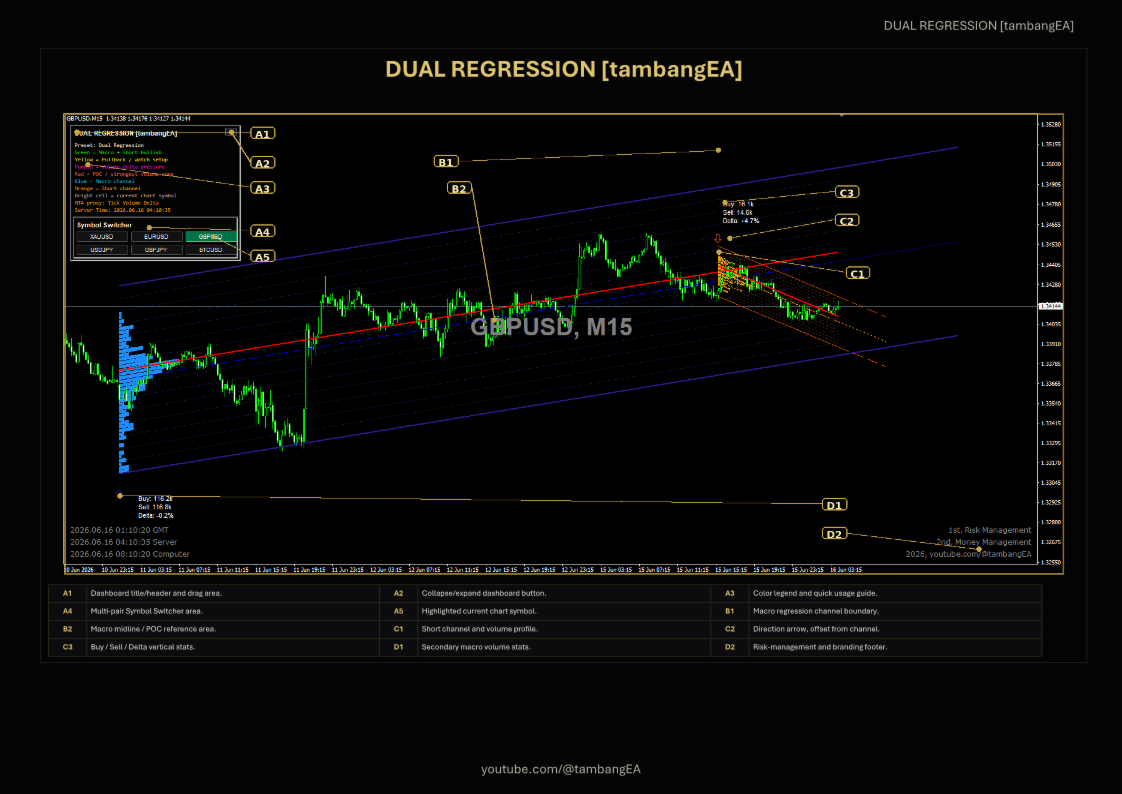
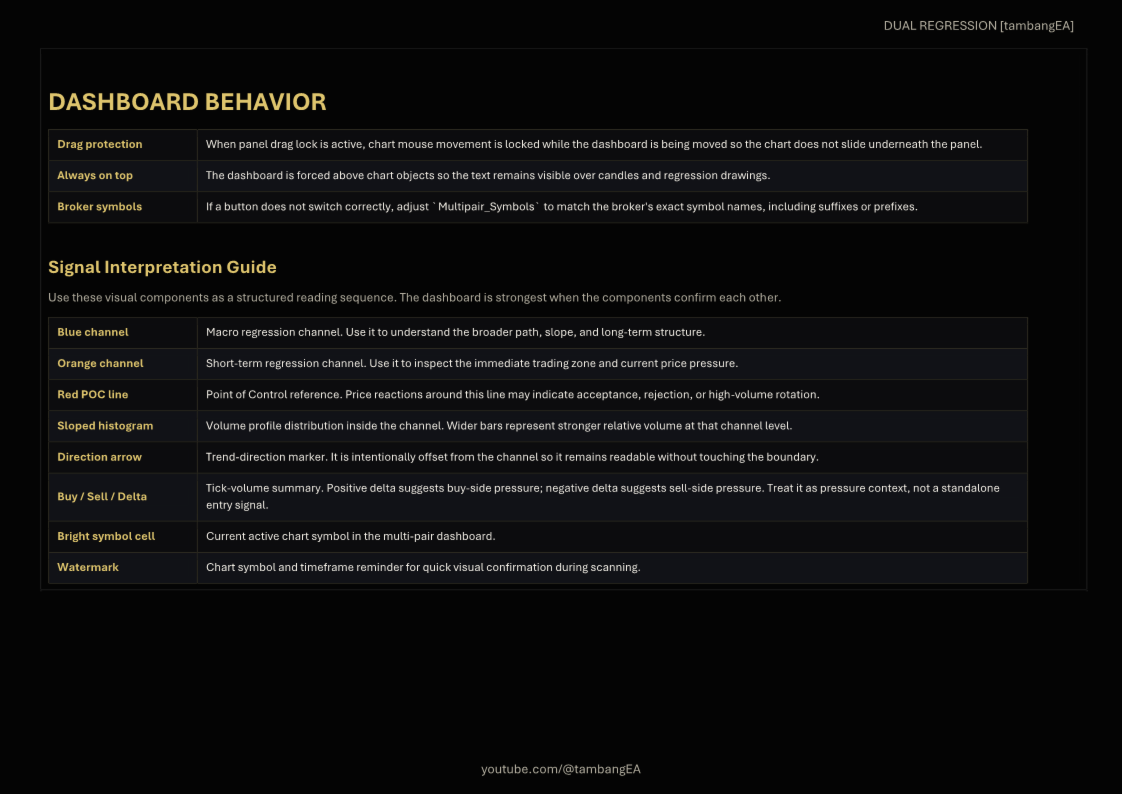
The blue macro channel helps identify the larger price structure, dominant slope, and long-term movement range.
Short-Term Channel
The orange short channel highlights the current active trading zone and helps the trader observe short-term pressure inside the broader structure.
Volume Profile Visualization
The indicator includes sloped volume profile bars inside the regression channel. Wider volume zones represent stronger relative tick-volume concentration.
POC Reference
The red Point of Control line marks the strongest volume zone inside the selected regression structure. It can be used as a reference area for price reaction, acceptance, rejection, or rotation.
Tick Volume Delta
The dashboard displays Buy, Sell, and Delta values in a clear vertical format. Positive Delta suggests buy-side pressure, while negative Delta suggests sell-side pressure.
Directional Arrow
A visual arrow marks the channel direction. The arrow is separated from the channel boundary for better readability.
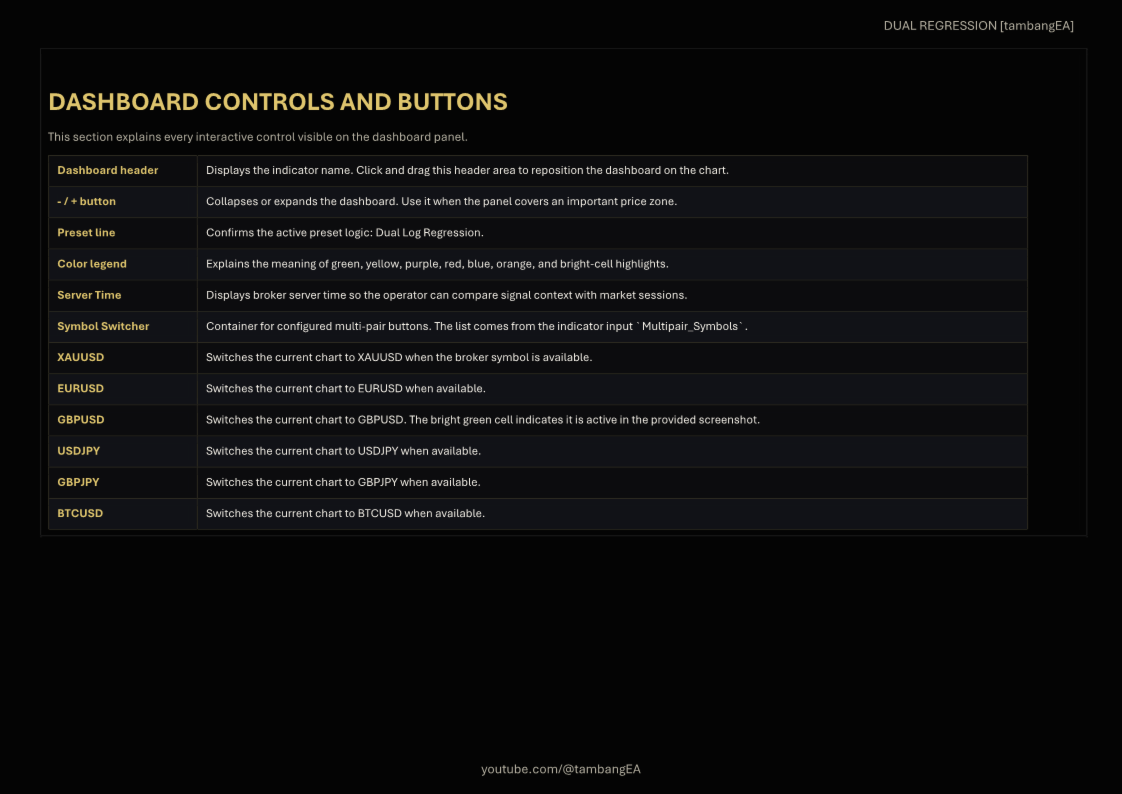
Dashboard Panel
The built-in dashboard explains the color logic and shows active market information directly on the chart.
Multi-Pair Symbol Switcher
The dashboard includes quick symbol buttons, allowing traders to switch between configured symbols without manually opening another chart.
Drag-Friendly Panel
The dashboard panel can be moved around the chart. Chart movement can be locked while dragging the panel to keep the layout stable.
Always-On-Top Display
The panel is designed to remain visible above candles and chart objects so the text stays readable.
Color Guide:
Green: Macro and short-term bullish condition.
Yellow: Pullback or watch setup.
Purple: Volume delta pressure.
Red: POC or strongest volume zone.
Blue: Macro regression channel.
Orange: Short-term regression channel.
Bright Cell: Current active chart symbol.
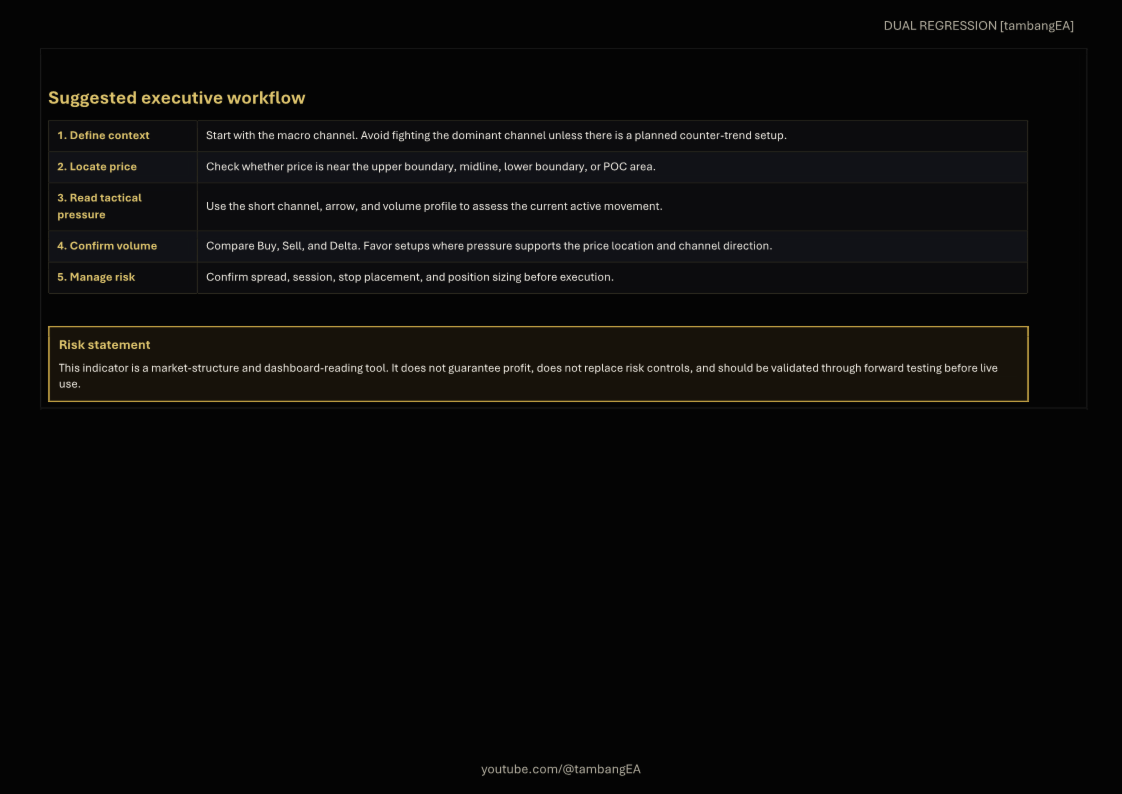
How To Use:
Start with the Macro Channel.
Use the blue macro channel to understand the broader market structure and dominant direction.
Check the Short Channel.
Use the orange short channel to read the current tactical movement and active price zone.
Observe the POC Line.
Watch how price behaves around the red POC line. It can act as an important volume reference area.
Read Buy, Sell, and Delta.
Use the tick-volume statistics to understand whether buying or selling pressure is stronger inside the selected channel window.
Confirm Price Location.
Check whether price is near the upper channel, lower channel, midline, or POC area.
Use Multi-Pair Buttons.
Switch between configured symbols directly from the dashboard panel for faster scanning.
Apply Risk Management.
The indicator is a visual decision-support tool. It does not replace stop loss, position sizing, session filtering, or personal trading rules.
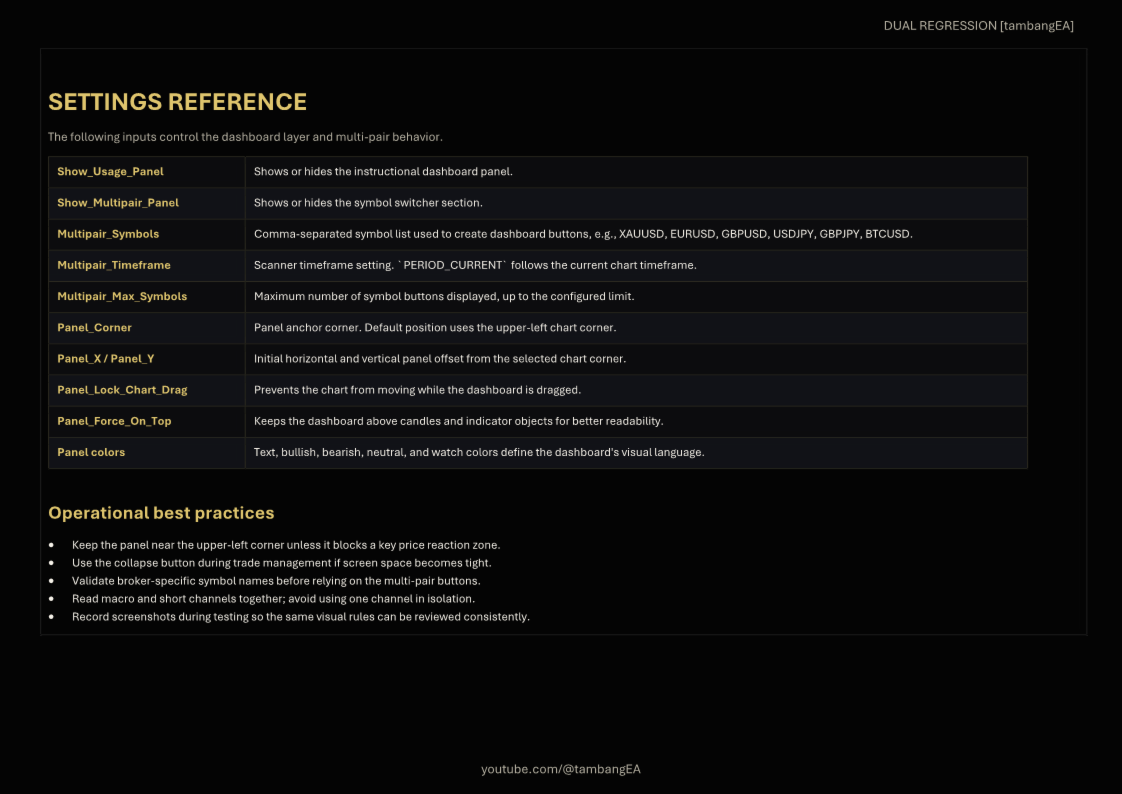
Main Inputs:
Macro Lookback Period:
Controls the long-term regression channel calculation.
Macro Channel Width:
Controls the deviation width of the macro channel.
Short Lookback Period:
Controls the short-term regression channel calculation.
Short Channel Width:
Controls the deviation width of the short channel.
Show Volume Profile:
Enables or disables the channel volume profile.
Show POC Line:
Enables or disables the Point of Control reference line.
Show Usage Panel:
Shows or hides the dashboard instruction panel.
Show Multipair Panel:
Shows or hides the symbol switcher.
Multipair Symbols:
Defines the symbol list shown in the dashboard switcher.
Panel Lock Chart Drag:
Prevents the chart from moving while the panel is being dragged.
Panel Force On Top:
Keeps the dashboard panel above other chart objects.