Range Ladder MT5
- Indicators
-
Agus Santoso
 DISCLAIMER ON : The author of EA will not be held responsible for your losses or problems of any kind if the EA is directly or indirectly responsible for any losses.
Our software is provided “as is”, without any warranty or condition of any kind, express, implied or statutory. - Version: 1.0
- Activations: 5
MQL5 Blogs : https://www.mql5.com/en/blogs/post/770443
MT4 Version : https://www.mql5.com/en/market/product/157434
MT5 Version : https://www.mql5.com/en/market/product/178388
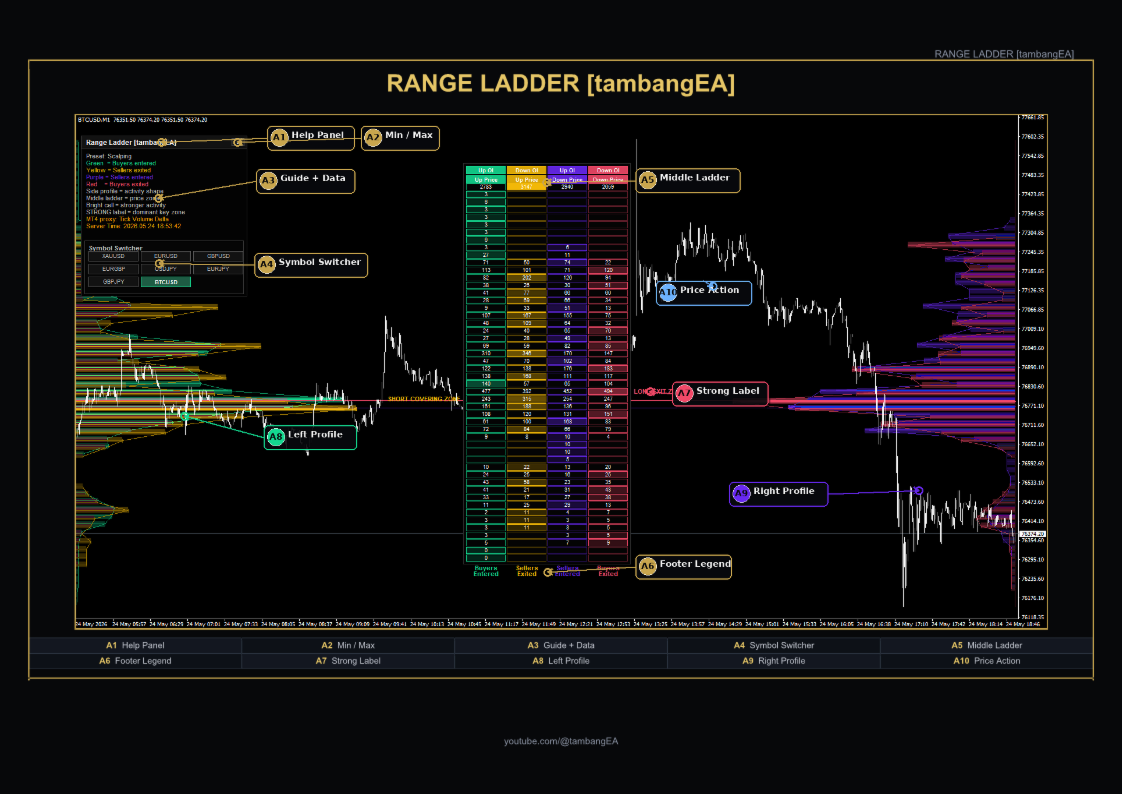
RANGE LADDER [tambangEA] is a professional visual analysis indicator built for traders who want a clearer view of market activity inside the visible chart range.
The indicator creates a premium range-ladder dashboard that displays how tick-volume activity is distributed across price zones. It separates market activity into four practical categories:
Buyers Entered
Sellers Exited
Sellers Entered
Buyers Exited
This structure helps traders understand whether a price zone is being supported by new buying activity, short covering, new selling pressure, or buyer exit activity.
The indicator is designed with a clean Dark Luxury dashboard, TradingView-style middle ladder, side profiles, smart zone labels, and a draggable/minimizable control panel. It is suitable for discretionary traders who use support and resistance, market structure, trend continuation, breakout, pullback, and reversal analysis.
Important Data Note
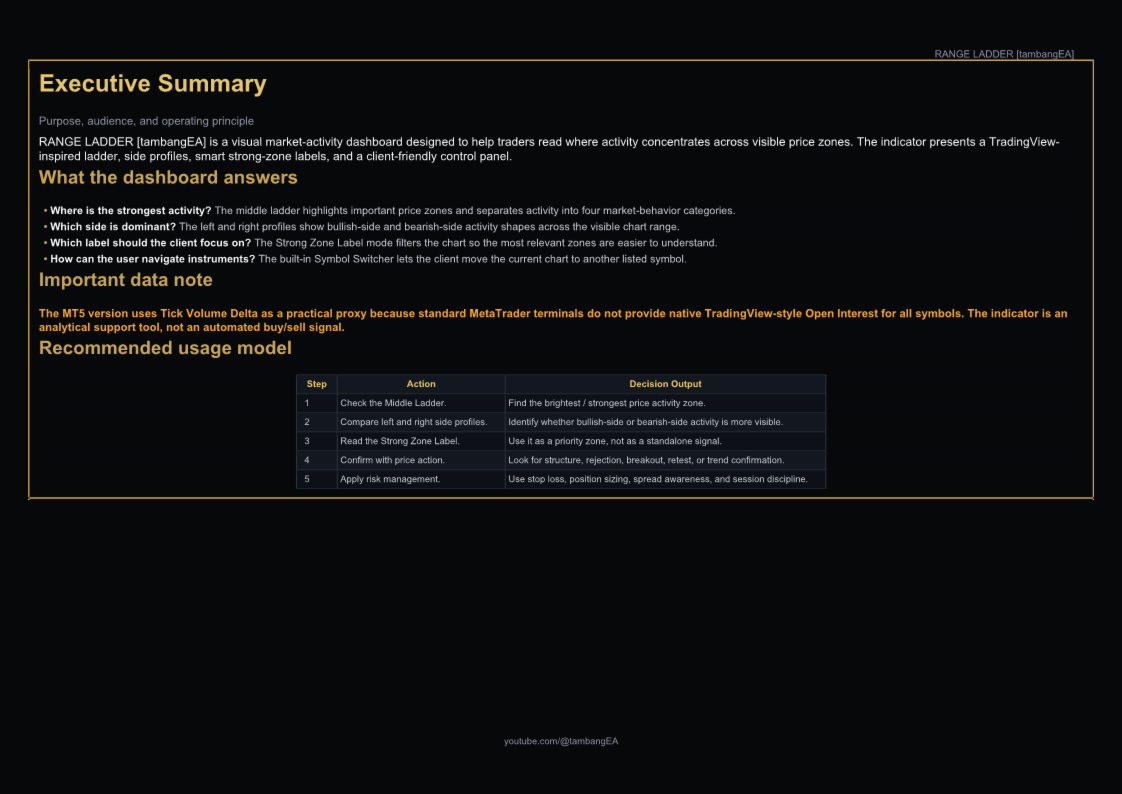
This MetaTrader version uses Tick Volume Delta Proxy because MetaTrader does not provide native TradingView-style Open Interest data.
The indicator does not claim to display real exchange Open Interest. Instead, it uses available MetaTrader tick-volume behavior as a practical proxy for visual range-ladder analysis.
Main Features
1. Premium Range Ladder Dashboard
The central ladder shows price-zone activity in a structured four-column format:
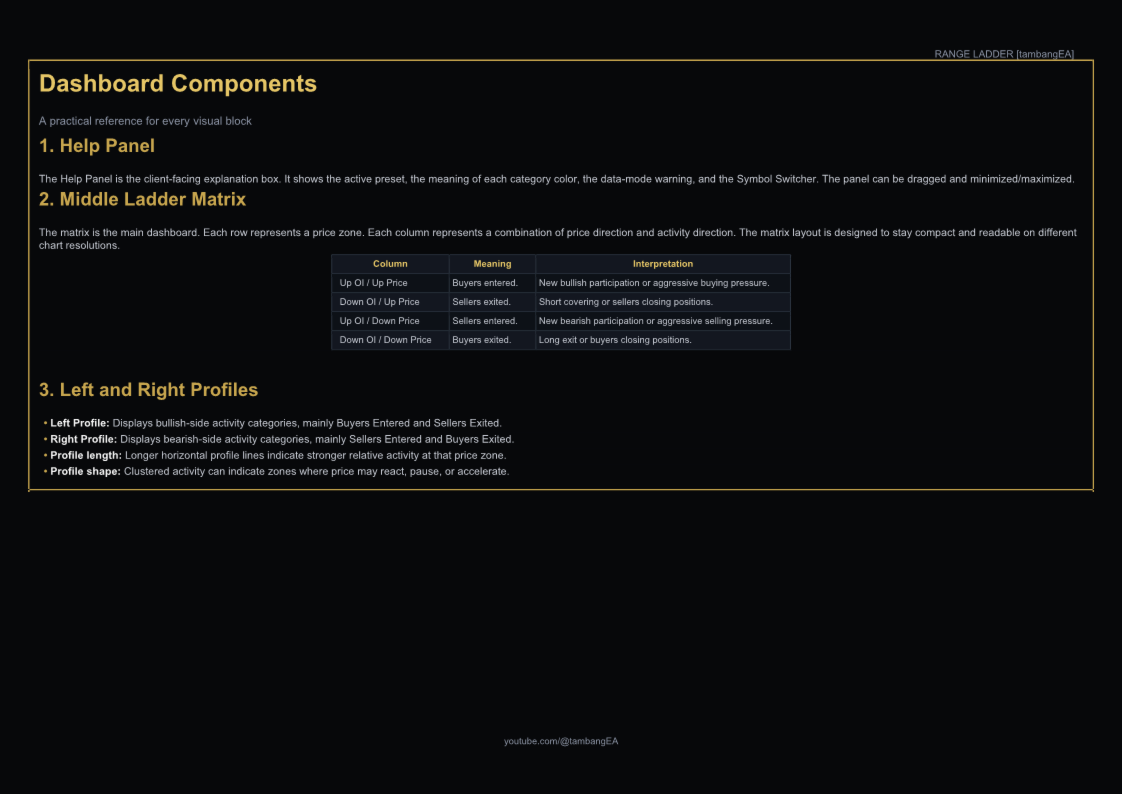
Up OI / Up Price
Down OI / Up Price
Up OI / Down Price
Down OI / Down Price
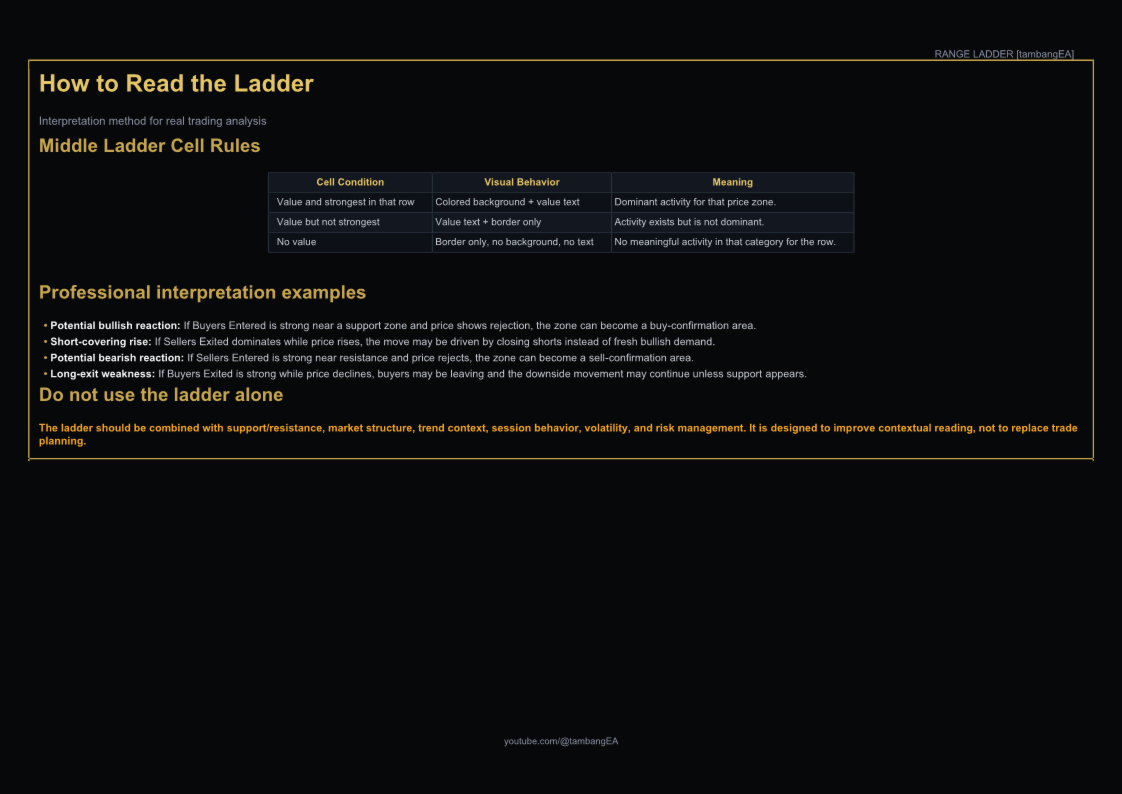
Cells are displayed in a TradingView-inspired format:
Strongest value in a row receives a colored background.
Existing non-dominant values appear with text and border.
Empty zones remain visible with a clean border-only grid.
This makes the ladder easier to read while keeping the chart clean and professional.
2. Four Market Activity Categories
The indicator classifies activity into four categories:
Buyers Entered
Shows areas where price increased while tick-volume activity increased. This may indicate new buying pressure.
Sellers Exited
Shows areas where price increased while tick-volume activity decreased. This may indicate short covering or sellers closing positions.
Sellers Entered
Shows areas where price decreased while tick-volume activity increased. This may indicate new selling pressure.
Buyers Exited
Shows areas where price decreased while tick-volume activity decreased. This may indicate buyers closing positions or long exit pressure.
3. Side Profile Visualization
The left and right side profiles provide a visual shape of activity distribution across price zones.
They help traders identify:
High activity price zones
Potential reaction levels
Dominant activity clusters
Strong ladder imbalance zones
Areas where price may react, reject, or consolidate
4. Smart Strong Zone Labels
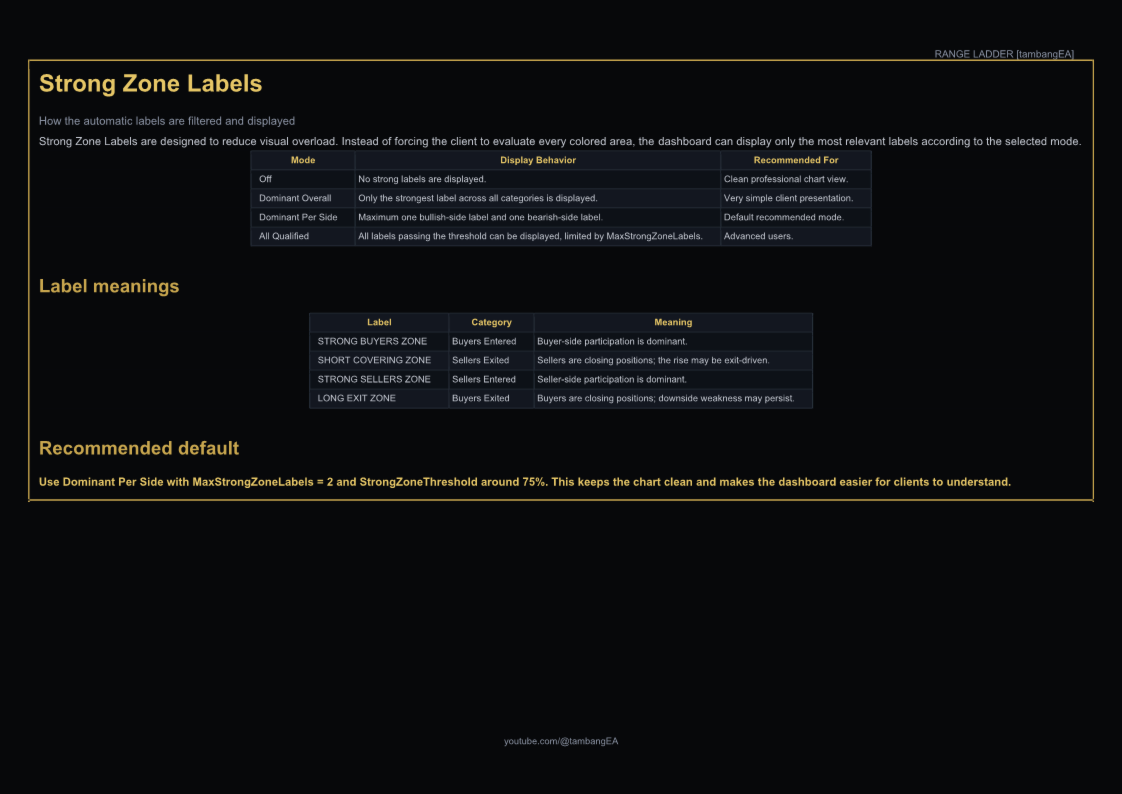
The indicator can automatically display important labels near the middle ladder:
STRONG BUYERS ZONE
SHORT COVERING ZONE
STRONG SELLERS ZONE
LONG EXIT ZONE
The label display mode can be adjusted:
Off
Dominant Overall
Dominant Per Side
All Qualified
The recommended default is Dominant Per Side, which keeps the chart clean by showing only the most relevant bullish-side and bearish-side zones.
5. Draggable and Minimizable Dashboard Panel
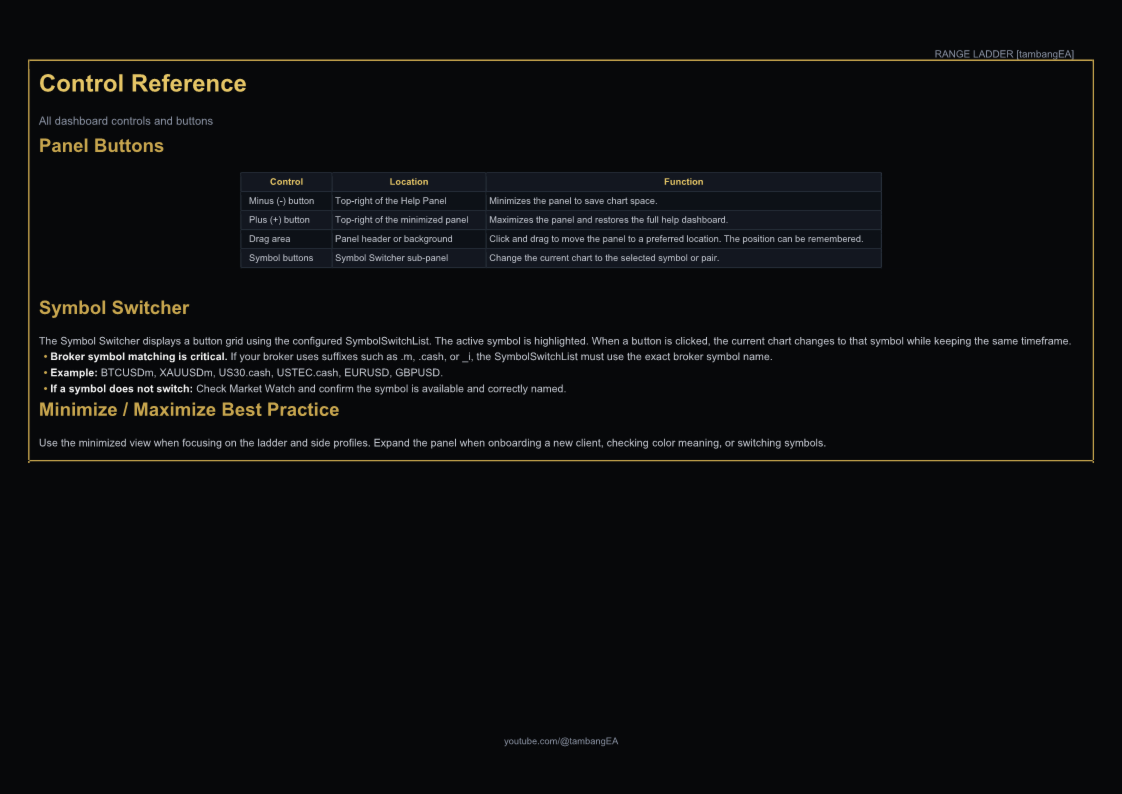
The information panel can be moved and minimized directly on the chart.
The panel includes:
Quick guide
Color explanation
Data mode warning
Preset information
Symbol switcher
This makes the indicator easier to use without opening the settings window repeatedly.
6. Symbol Switcher Panel
The dashboard includes a symbol switcher that allows users to move quickly between selected instruments.
Users can customize the symbol list from the input settings, for example:
BTCUSD
XAUUSD
EURUSD
GBPUSD
USDJPY
US30
US100
The current symbol is highlighted for easier navigation.
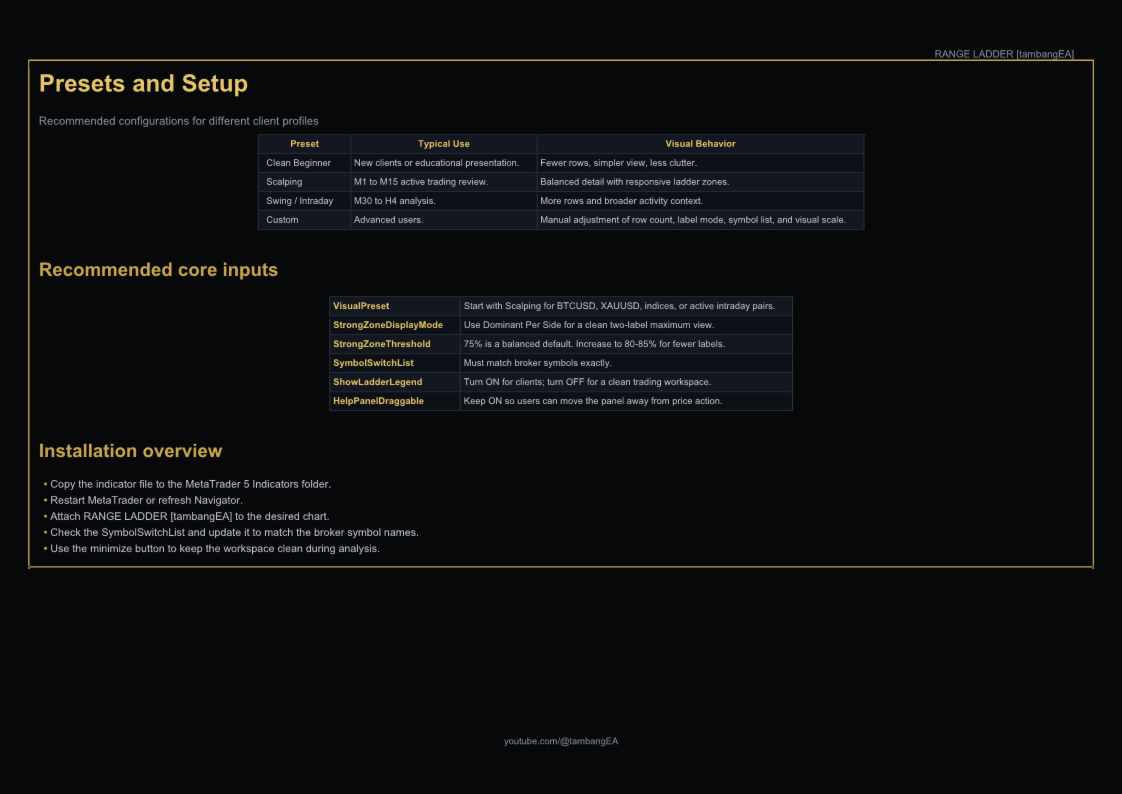
7. Visual Presets
The indicator includes practical presets:
Clean Beginner
A cleaner setup for users who want less visual information.
Scalping
A more active setup for lower timeframes and short-term trading.
Swing / Intraday
A broader setup for traders who analyze larger visible ranges.
Custom
Allows advanced users to configure all visual and calculation settings manually.
How to Use
Attach RANGE LADDER [tambangEA] to the chart.
Select the preferred visual preset.
Observe the middle ladder and identify the strongest colored cells.
Check whether the strong zone aligns with support, resistance, breakout, pullback, or market structure.
Use the side profiles to confirm whether the activity zone has strong participation.
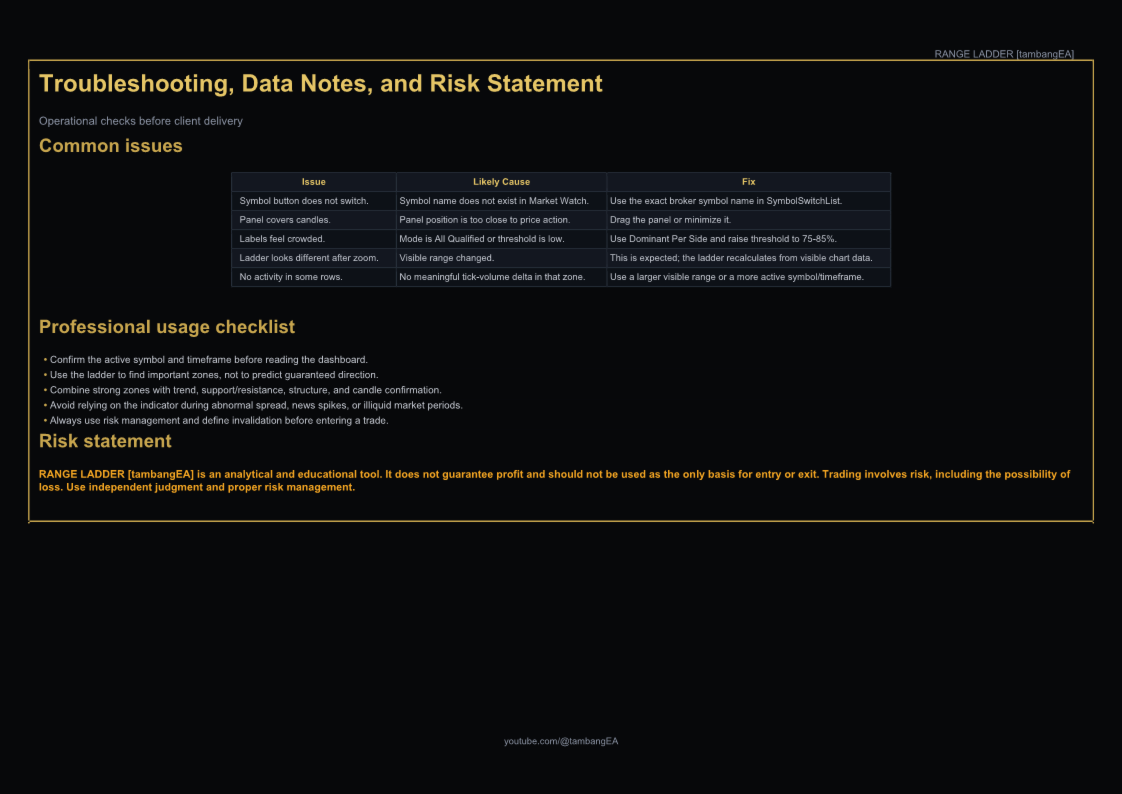
Use Strong Zone Labels as attention markers, not as automatic buy/sell signals.
Confirm entries with your own strategy, risk management, and price action rules.