Liquidity Magnet MT5
- Indicators
-
Agus Santoso
 DISCLAIMER ON : The author of EA will not be held responsible for your losses or problems of any kind if the EA is directly or indirectly responsible for any losses.
Our software is provided “as is”, without any warranty or condition of any kind, express, implied or statutory. - Version: 1.0
- Activations: 5
MQL5 Blogs : https://www.mql5.com/en/blogs/post/772035
MT4 Version : https://www.mql5.com/en/market/product/183506
MT5 Version : https://www.mql5.com/en/market/product/183507
LIQUIDITY MAGNET [tambangEA] is a professional Supply and Demand visualization indicator designed to help traders identify high-quality liquidity zones, monitor zone strength, and read the potential directional “magnet” between opposing market areas.
The indicator maps important intraday Supply and Demand zones directly on the chart, scores each zone based on reaction quality, and displays a clean dashboard with zone status, price ranges, score, freshness, invalidation state, and active magnet pull direction.
This tool is designed for manual decision support. It does not open, close, or manage trades automatically.
Key Concept
Markets often react around areas where institutional liquidity, stop orders, pending orders, and previous reaction zones are concentrated.
LIQUIDITY MAGNET [tambangEA] helps traders visualize these areas by identifying strong Supply and Demand zones and showing the possible pull route from one strong zone toward another.
The “Magnet” feature is not a guaranteed prediction. It is a directional bias based on zone strength, freshness, price position, and relative structure.
Main Features
Supply and Demand Zone Detection
The indicator automatically identifies potential Supply and Demand zones based on swing structure and market reaction behavior.
Supply zones are displayed as red areas and represent potential sell-pressure zones above or around price.
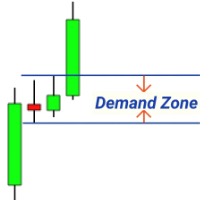
Demand zones are displayed as green areas and represent potential buy-pressure zones below or around price.
Zone Strength Score
Each zone is given a strength score from 0 to 10.
General interpretation:
8.0+: Elite zone
6.5 – 7.9: Strong zone
5.0 – 6.4: Moderate zone
Below 5.0: Weak or forming zone
Higher-score zones generally deserve more attention, especially when combined with price action confirmation, trend context, and proper risk management.
Zone State
Each zone has a live status label:
FRESH: The zone has not been tested yet.
TESTED: Price has already revisited the zone, but it may still be relevant.
X INVAL: The zone has been invalidated by price action.
This makes it easier to separate fresh zones from already consumed or invalid areas.
Liquidity Magnet Pull
The Magnet Pull section shows the strongest active route between opposing zones.
This means price is showing a potential pull from Demand zone D1 toward Supply zone S2.
The dashboard also displays:
Pull strength
Target zone
Target price
Distance from current price
Directional bias
The magnet reading should be used as a market context tool, not as a standalone entry signal.
Professional Dashboard
The built-in dashboard provides a fast overview of current market structure.
Dashboard sections include:
Active Supply zones
Active Demand zones
Zone score
Zone state
Magnet Pull route
Net Pull direction
Nearest zone
Supply/Demand strength summary
Symbol and timeframe reference
The dashboard is designed to help traders read the market quickly without manually searching for important zones.
Multi-Pair Symbol Buttons
The indicator includes quick-access symbol buttons for switching between selected markets.
The button order remains fixed for consistency, even after switching between symbols.
This helps traders scan multiple markets more efficiently while keeping the dashboard layout stable.
Dashboard Buttons
Dashboard: ON / OFF
Shows or hides the main indicator dashboard.
Tab: OVERVIEW
Displays the live zone summary, Supply/Demand lists, magnet data, and current field metrics.
Tab: HOW TO USE
Displays a built-in usage guide directly on the chart, including explanations of zones, score, state, magnet bias, and basic reading logic.
Symbol Buttons
Switch the active chart symbol while keeping the same timeframe.
Recommended Usage
LIQUIDITY MAGNET [tambangEA] is best used as a visual market structure tool.
Recommended workflow:
Open the chart and enable the dashboard.
Check the active symbol and timeframe.
Review Supply and Demand zones.
Focus on Strong or Elite zones.
Prefer Fresh zones for new setups.
Read the Magnet Pull route.
Confirm the setup with price action.
Check spread, volatility, and session condition.
Apply proper stop loss, position sizing, and risk control.