RANGE LADDER [ tambangEA ]
- VISIBLE CHART RANGE -

How EA Works : https://youtu.be/uiF6SfGWGJg
MQL5 Blogs : https://www.mql5.com/en/blogs/post/770443
MT4 Version : https://www.mql5.com/en/market/product/157434
MT5 Version : https://www.mql5.com/en/market/product/178388

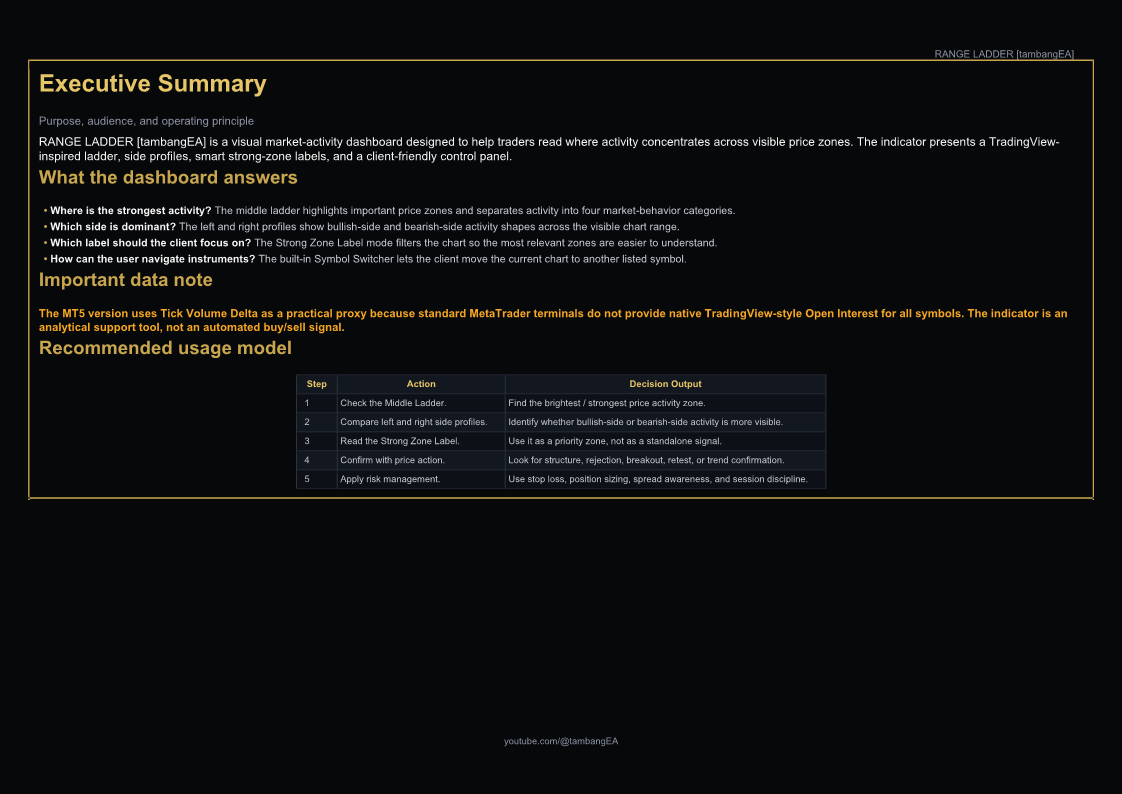



RANGE LADDER [tambangEA] is a professional visual analysis indicator built for traders who want a clearer view of market activity inside the visible chart range.
The indicator creates a premium range-ladder dashboard that displays how tick-volume activity is distributed across price zones. It separates market activity into four practical categories:
- Buyers Entered
- Sellers Exited
- Sellers Entered
- Buyers Exited
This structure helps traders understand whether a price zone is being supported by new buying activity, short covering, new selling pressure, or buyer exit activity.
The indicator is designed with a clean Dark Luxury dashboard, TradingView-style middle ladder, side profiles, smart zone labels, and a draggable/minimizable control panel. It is suitable for discretionary traders who use support and resistance, market structure, trend continuation, breakout, pullback, and reversal analysis.
Important Data NoteThis MetaTrader version uses Tick Volume Delta Proxy because MetaTrader does not provide native TradingView-style Open Interest data.
The indicator does not claim to display real exchange Open Interest. Instead, it uses available MetaTrader tick-volume behavior as a practical proxy for visual range-ladder analysis.
Main Features
1. Premium Range Ladder Dashboard
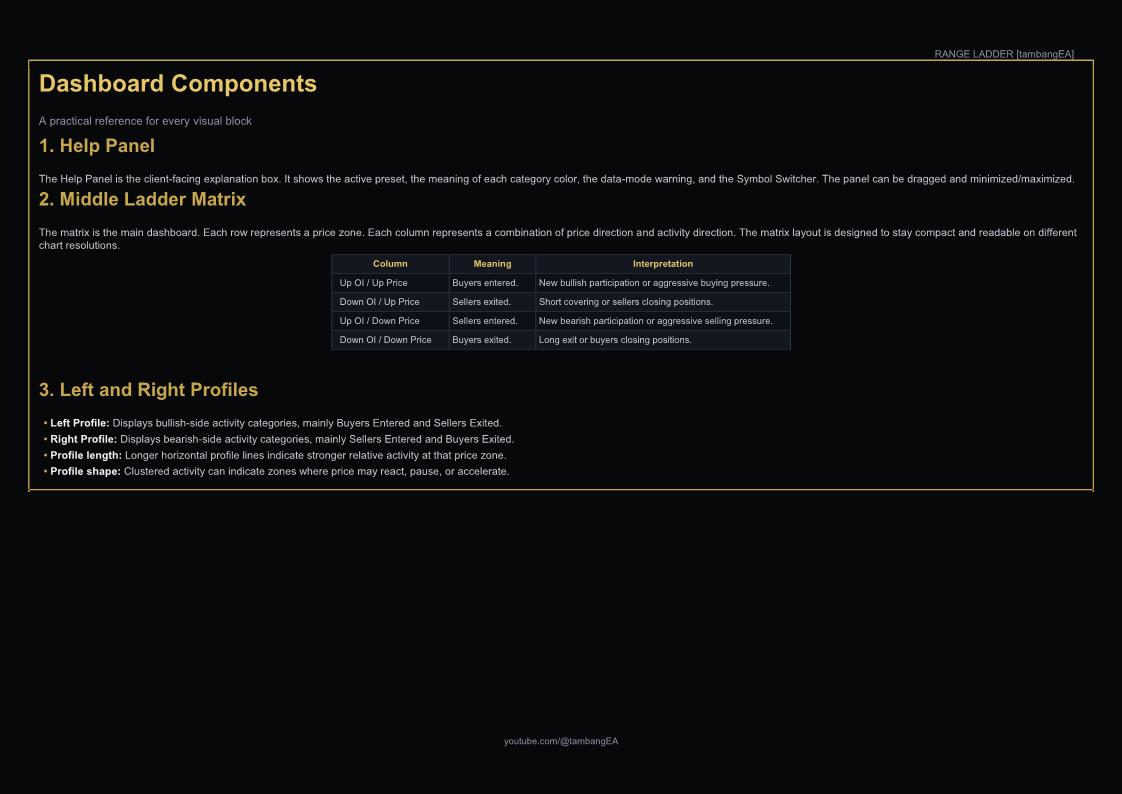
The central ladder shows price-zone activity in a structured four-column format:
- Up OI / Up Price
- Down OI / Up Price
- Up OI / Down Price
- Down OI / Down Price
Cells are displayed in a TradingView-inspired format:
- Strongest value in a row receives a colored background.
- Existing non-dominant values appear with text and border.
- Empty zones remain visible with a clean border-only grid.
This makes the ladder easier to read while keeping the chart clean and professional.
2. Four Market Activity Categories
The indicator classifies activity into four categories:
Buyers Entered
Shows areas where price increased while tick-volume activity increased. This may indicate new buying pressure.
Sellers Exited
Shows areas where price increased while tick-volume activity decreased. This may indicate short covering or sellers closing positions.
Sellers Entered
Shows areas where price decreased while tick-volume activity increased. This may indicate new selling pressure.
Buyers Exited
Shows areas where price decreased while tick-volume activity decreased. This may indicate buyers closing positions or long exit pressure.
3. Side Profile Visualization
The left and right side profiles provide a visual shape of activity distribution across price zones.
They help traders identify:
- High activity price zones
- Potential reaction levels
- Dominant activity clusters
- Strong ladder imbalance zones
- Areas where price may react, reject, or consolidate
4. Smart Strong Zone Labels
The indicator can automatically display important labels near the middle ladder:
- STRONG BUYERS ZONE
- SHORT COVERING ZONE
- STRONG SELLERS ZONE
- LONG EXIT ZONE
The label display mode can be adjusted:
- Off
- Dominant Overall
- Dominant Per Side
- All Qualified
The recommended default is Dominant Per Side, which keeps the chart clean by showing only the most relevant bullish-side and bearish-side zones.
5. Draggable and Minimizable Dashboard Panel
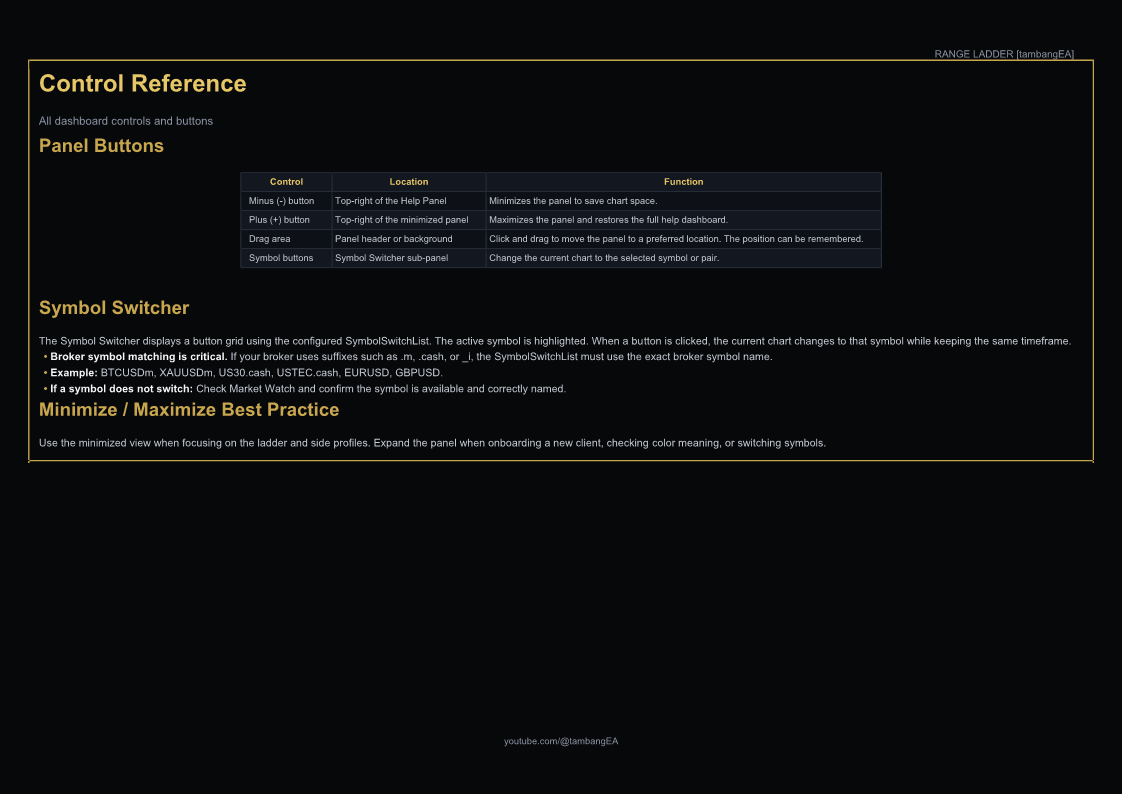
The information panel can be moved and minimized directly on the chart.
The panel includes:
- Quick guide
- Color explanation
- Data mode warning
- Preset information
- Symbol switcher
This makes the indicator easier to use without opening the settings window repeatedly.
6. Symbol Switcher Panel
The dashboard includes a symbol switcher that allows users to move quickly between selected instruments.
Users can customize the symbol list from the input settings, for example:
- BTCUSD
- XAUUSD
- EURUSD
- GBPUSD
- USDJPY
- US30
- US100
The current symbol is highlighted for easier navigation.
7. Visual Presets
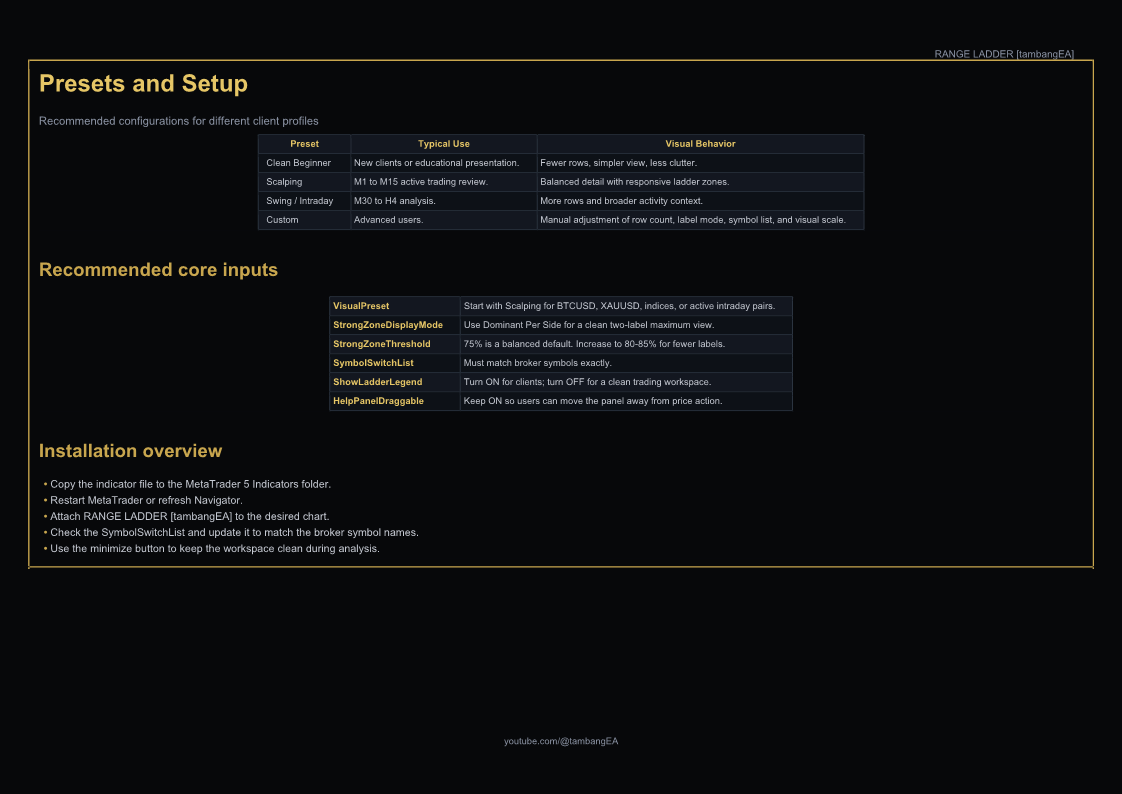
The indicator includes practical presets:
Clean Beginner
A cleaner setup for users who want less visual information.
Scalping
A more active setup for lower timeframes and short-term trading.
Swing / Intraday
A broader setup for traders who analyze larger visible ranges.
Custom
Allows advanced users to configure all visual and calculation settings manually.
How to Use
- Attach RANGE LADDER [tambangEA] to the chart.
- Select the preferred visual preset.
- Observe the middle ladder and identify the strongest colored cells.
- Check whether the strong zone aligns with support, resistance, breakout, pullback, or market structure.
- Use the side profiles to confirm whether the activity zone has strong participation.
- Use Strong Zone Labels as attention markers, not as automatic buy/sell signals.
- Confirm entries with your own strategy, risk management, and price action rules.
Recommended Usage
This indicator can be useful for:
- Scalping analysis
- Intraday analysis
- Support and resistance confirmation
- Breakout and retest analysis
- Pullback analysis
- Market activity mapping
- Visual volume-pressure analysis
- Price-zone reaction analysis
Recommended timeframes:
- M1 to M15 for scalping
- M15 to H1 for intraday trading
- H1 to H4 for broader zone analysis
Input Highlights
The indicator includes settings for:
- Visual preset selection
- Profile rows
- Ladder rows
- Side profile width
- Strong zone threshold
- Strong zone display mode
- Help panel position
- Panel drag and minimize
- Symbol switcher list
- Color customization
- Font size adjustment
- Tick-volume proxy behavior
Best Practice
Use the indicator as a market activity map, not as a standalone signal generator.
A strong zone becomes more meaningful when it appears near:
- Major support or resistance
- Previous swing high or swing low
- Breakout or retest area
- Trend continuation zone
- High-volume rejection zone
- Market structure confirmation
Risk Warning
Trading involves risk. This indicator is designed as a visual analytical tool and does not guarantee profit. It should not be used as the only reason to open or close a trade.
Always use proper risk management, position sizing, and independent trade confirmation before entering the market.