Elliott Wave Engine

Elliott Wave Engine

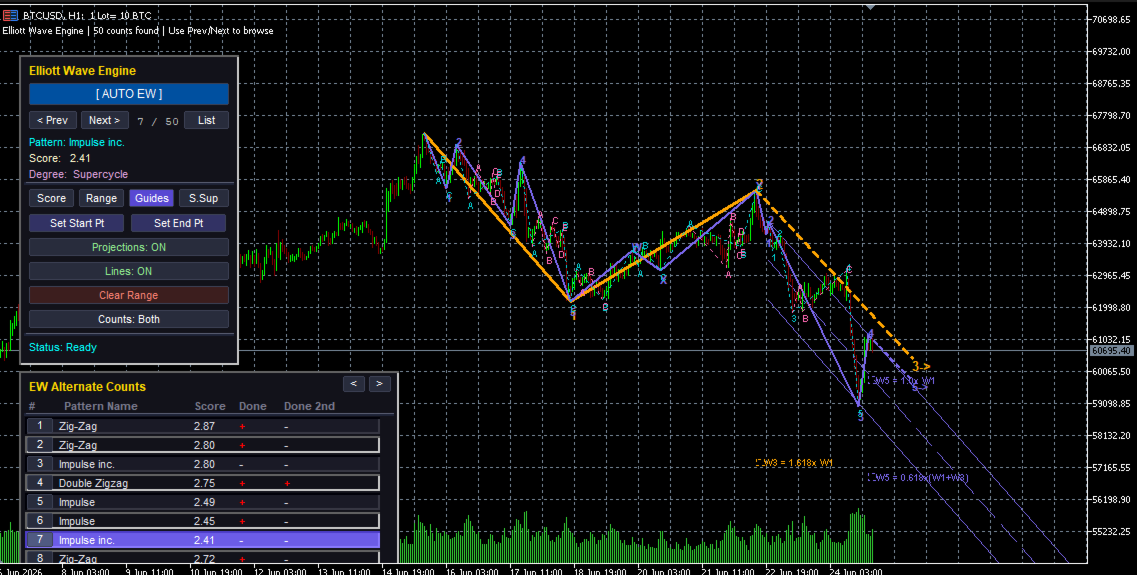
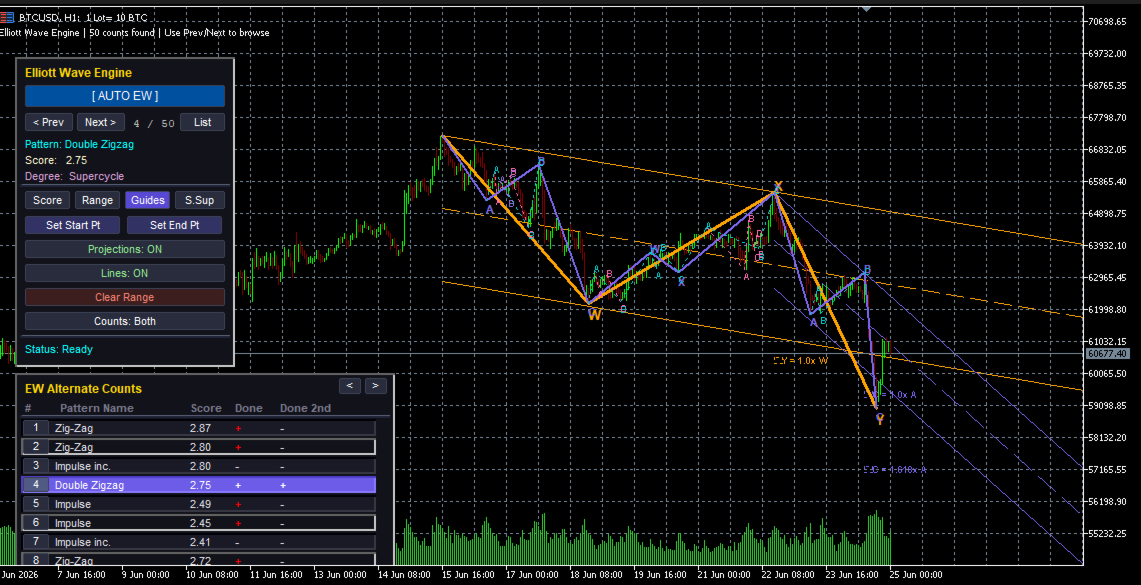
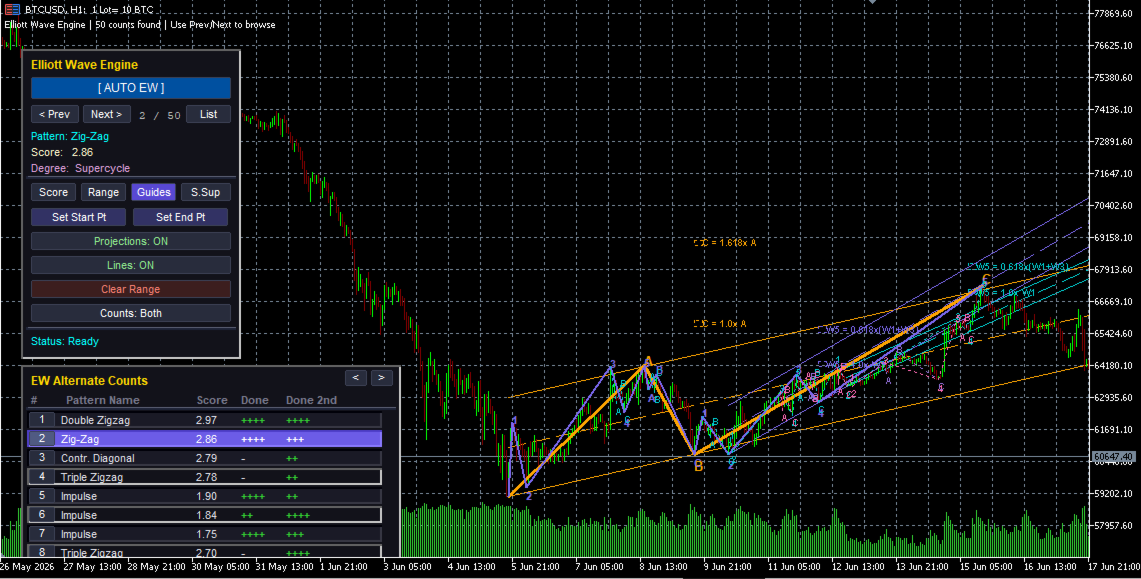
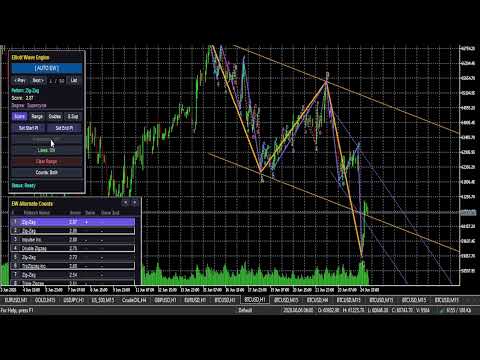
The Auto Elliott Engine is a tool designed for MetaTrader 5 that automates the identification, decomposition, and projection of price structures based on the Elliott Wave Theory.

Powered by a pattern-recognition engine, this indicator processes price action to identify market configurations, translating data into structured scenarios.

Key Features
  • Multi-Degree Recognition: Analyzes price action across multiple fractal levels. From higher degrees, such as Supercycle or Cycle, down to minor structures.

  • Identifies several Pattern formations:

    • Impulses
    • Contractive/Expanding Diagonals 
    • Simple and doble or triple Zig-Zags
    • Regular/Expanded Flats
    • Triangles
    • WXY/WXYXZ Combinations.
  • Fibonacci Projections: The system projects retracement and extension zones on the chart based on the active wave. The interface allows for toggling between visualizing key areas of the last wave or a mapping of all calculated ranges.

  • Scoring System: Each suggested count undergoes a qualification process. If a structure shows anomalies or exceeds the margins of classic Elliott behavior, such as excessive retracements or unusual proportions, the engine assigns penalties to prioritize others counts that adhere to classic wave theory.

- EW Alternate Counts List Panel:  
- Appears right below the main panel, stacked vertically.   - Aligns cleanly on left edges for left corners and right edges for right corners.   - Automatically shifts the main panel upwards in bottom-corner configurations to ensure both panels fit on screen.   - Lists up to 8 counts per page with index buttons, pattern names, scores, and completion checks (`+`, `++`, etc.).   - Features mouse-wheel scrolling.   - Click-to-Select: Clicking on any alternate count row instantly updates the chart drawing to showcase that specific pattern.
Ideal For

Technical market analysts and price-action specialists who seek to assist their wave counting and automate the mapping of price expansions and contractions.

Important Note: This indicator does not take into account all Elliott Wave guidelines; for example, it does not include "The Right Look".

How to Use
  • Start the Analysis: Click the "Start" button to select the starting point of the wave count. This should be an extreme point from which the count originates.

  • Historical Range: We recommend selecting a range of 100 to 200 historical bars. Calculating the wave structure is resource-intensive; while you can experiment with a larger historical range, please be aware that processing times will increase. If you require analysis over a larger historical range, we recommend switching to higher timeframes.

  • Run the Count: Click the "Auto EW" button to execute the count within your selected range.

  • Manage Projections: You can toggle the visual projections by clicking the "Projections: ON / Projections: OFF" button.

  • Navigation: Use the "< Prev" and "Next >" buttons on the interface to view alternative wave counts.

Filters: by Score, by Range, by Guides, and by S. Sup.

  • Score: Based on the overall point rating.
  • Range: Based on the price range covered.
  • Guides: Based on guidelines.
  • S. Sup: Based exclusively on the score of the higher-degree pattern.

The Vertical label spacing multiplier has been set to 1 by default. However, if you notice that labels overlap on the same vertex, we recommend increasing this value to 2 or 3 to resolve the issue (for example, in assets like BTC).


By default, the indicator is configured to perform a count automatically as soon as it is loaded onto the chart. But It works best when the user selects the range they want the indicator to process and then clicks "Auto EW".

Strategy Tester:

The interactive panel is now supported in the Strategy Tester. It performs almost identically to real-time Live Charts (only minor differences are expected due to the nature of the testing engine).

I have included the following useful settings to use in the Strategy Tester:
  1. Auto-analyze on load = true (by default)
  2. Analyze on new bar close = true (by default)


    Recommended products
    Utilities
    Douglas Lucio De Araujo
    Indicator with 3 features - Clock : Clock independent of the chart, counting continues even when the market is closed. - Template : After setting up a configuration in any graphic, be it color patterns, indicators, zoom ... The configuration will be copied to all active graphics. - TimeFrame : Set the TimeFrame on a chart, and with just one click all the active charts will be changed to the same TimeFrame.
    I  recommend you to read the   product's blog  (manual) from start to end so that it is clear from the beginning what the indicator offers. This multi time frame and multi symbol indicator scans for Pin bars, Morning/evening stars, Engulfings, Tweezers, Three Line Strikes, Inside bars and Pennants and Triangles.  The indicator can also be used in single chart mode. Please read more about this option in the product's   blog . Combined with your own rules and techniques, this indicator will allow
    I recommend you to read the   product's blog  (manual) from start to end so that it is clear from the beginning what the indicactor offers. This multi time frame and multi symbol divergence dashboard indicator sends an alert when one or two different divergences have been identified. It can be used with all time frames from M1 to MN. Maximum 9 time frames can be shown in the dashboard at the same time. It is possible to enable moving average, RSI or Bollinger bands trend filter to filter out on
    H4 Structure Entry Dashboard is a professional multi-timeframe trading assistant that combines H4 market structure with H1/M15 entry confirmation , displayed through a clean on-chart dashboard and clear BUY/SELL arrows . It is designed for traders who want fast, structured decision-making: Structure first (H4) → Entry second (H1/M15). Key Features True multi-timeframe logic Higher timeframe bias from H4 Entry confirmation on H1 or M15 Market Structure Tools (H4) Automatically detects and draws
    THE NUMBER CHANGES. THE MEANING DOESN’T. Change timeframes. Keep your reference. SAME PERIOD. DIFFERENT MEANING. Change the timeframe, and the MA you trusted is no longer measuring the same market horizon. The problem The same MA period measures a different amount of market time when the chart timeframe changes. The solution Equivalent MA changes the number — so your reference keeps the same meaning. H4 EMA 50 = H1 EMA 200 = M15 EMA 800 USER MANUAL Complete setup instructions, feature details,
    Aussenstab Markttechnik
    Alexander Josef Zeidler
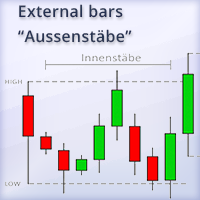
    This indicator shows external bars ("Aussenstäbe") in the chart in candle form. The colors of the candles can be set individually. Also different colors for bearish and bullish bars are possible. In addition, the color of the wicks or outlines is also adjustable. Outside bars are mentioned e.g. by Michael Voigt in the book "Das große Buch der Markttechnik". All other candles are inner bars.
    An all‑in‑one trading assistant that blends AI candle synthesis with a 15‑pattern Heat Map, ATR‑scaled S/R & pivots, and a Vigilant risk monitor (LOC/TF/SR/PAT gates, Ready%, EM points, SR‑distance bar). The Opportunity Advisor adds ETAs, checklists and gate status; Multi‑TF Confluence confirms alignment from M1–D1. The Professional Trade Suggestion panel shows regime, session filter, R:R presets, Partials and Quality Pause. Clean, readable UI with one‑click S/R toggles, scanners and a built‑in,
    MQL5 Blogs : https://www.mql5.com/en/blogs/post/772035 MT4 Version : https://www.mql5.com/en/market/product/183506 MT5 Version : https://www.mql5.com/en/market/product/183507 LIQUIDITY MAGNET [tambangEA] is a professional Supply and Demand visualization indicator designed to help traders identify high-quality liquidity zones, monitor zone strength, and read the potential directional “magnet” between opposing market areas. The indicator maps important intraday Supply and Demand zones directly o
    ICT Institutional Zones Pro
    Celestine Anyango Wabomba
    ICT Institutional Zones Pro — Trade with Institutional Precision Stop wasting time manually drawing key ICT levels every day. ICT Institutional Zones Pro is a professional-grade MT5 indicator built for traders who use ICT (Inner Circle Trader) and Smart Money Concepts (SMC) to read market structure with precision. This indicator automatically maps the most important institutional levels directly on your chart, helping you instantly identify where smart money is likely accumulating, distributing
    --- StudentK Sync Chart --- 1. Move charts at the same time 2. Cross check among different Symbols and Timeframes 3. Plan your own trading strategies --- Context --- StudentK is not indicated as a master or K Sir for knowledgeable person who claims for winning all the time. (But lots of traders should know the fact that it is rarely truth, especially in fluctuated period of time) StudentK is a group of years-experienced traders who want to share amazing tools in Free and Paid versions. Aiming
    is a versatile analytical tool designed for both advanced traders and beginners. It combines classic trend line analysis with automatic Fibonacci level plotting to deliver precise market entries and structural clarity. Built as an intuitive and clean on-screen dashboard, this indicator simplifies multi-timeframe analysis without cluttering your main workspace. Technical Analysis and Entry Points The indicator automates the most critical aspects of price action and structural trading: Trend L
    Session Killzones Asia London New York marks the most important trading sessions on your chart. Asia, London and New York session boxes , each labelled with its range in pips. Previous Day High and Low (PDH / PDL) levels. Asian range breakout alerts during London and New York. Automatic broker GMT offset detection , with a manual override. Session hours you can change, given in GMT. Custom colors and the number of days to show. Inputs Detect broker GMT offset automatically / Manual GMT offset –
    Ultimate Double Top & Bottom (Pro Volume Matrix) Stop trading retail breakouts. Start trading Institutional Traps. The   Ultimate Double Top & Bottom   is not a standard, lagging pattern scanner. It is a highly advanced, non-repainting structural engine equipped with a proprietary   3-Leg Volume Matrix . Designed exclusively for Smart Money Concepts (SMC) and order flow traders, this indicator mathematically dissects the tick volume inside M and W patterns to reveal true institutional intent:  
    Full detailed blogpost is here: https://www.mql5.com/en/blogs/post/770442 Abiroid Genesis Matrix Scanner: Complete User Guide This strategy uses four complementary indicators working together to identify trend momentum: TVI, CCI, T3, GannHiLo and when all four agree, the signal carries considerably more weight than any single indicator could on its own. This scanner takes that concept and applies it across multiple pairs and timeframes simultaneously, surfacing only the moments worth paying att
    MQL5 Blogs : https://www.mql5.com/en/blogs/post/768823 MT4 Version : https://www.mql5.com/en/market/product/171247 MT5 Version : https://www.mql5.com/en/market/product/171248 FIBONACCI PROJECTION [tambangEA] is a professional dashboard-based trading analysis tool designed to help traders identify market structure, Fibonacci projection targets, volume reaction zones, and directional continuation areas directly on the chart. The tool automatically detects the latest swing structure, builds Fibo
    Quantum Trend Scanner
    Niccyril Chirindo
    5 (1)
    QUANTUM TREND SCANNER Professional Multi-Timeframe Trend Analysis Dashboard Quantum Trend Scanner is an advanced technical indicator designed to analyze market trends across multiple timeframes and currency pairs simultaneously. The indicator provides traders with comprehensive market insights through three integrated analytical panels. Quantum Trend Scanner Guide is Here  What It Does The indicator monitors 30 currency pairs across 9 timeframes (M1, M5, M15, M30, H1, H4, D1, W1, MN1) and pre
    Institutional Orderflow Entry Scanner Volume Profile • Value Area • Order Blocks • Multi-Symbol Scanner Turn your chart into a professional institutional order-flow cockpit. This indicator scans up to 60 Market Watch symbols in real time, detects high-probability setups from three proven Value-Area strategies, and delivers clean, actionable entries with institutional-grade risk management — all on a single, flicker-free interface. What It Does The scanner continuously analyses the previous sess
    High And Low MT5
    Dmitriy Parfenovich
    On the current chart, this indicator displays candlestick highs and lows of another time frame. Input Parameters: TimeFrame - chart time frame whose data will be displayed on the current price chart (by default, H12). Time Zone - shift of the indicator by time zone relative to the broker's time (by default, Broker-1). If the broker's time zone is UTC+1 and the Time Zone parameter is set to Broker-1, the bends of the indicator will be plotted in multiples of Greenwich Time. Indicator buffer value
    The trend filter
    Vincent Albert Feugier
    Trend Filter By HYPOLITE MAKER (v3.00) Trend Filter is a visual indicator for MetaTrader 5 designed to clean up your charts and display the market's true trend. It eliminates market noise and visual traps to help you stay on the right side of the market, with significantly less lag than standard moving averages. Visuals & Key Features The Central Line: It changes color to give you the market direction at a glance. Green for an uptrend, Red for a downtrend, and Yellow when the market is hesitatin
    BOS CHOCH STRUCTURE DETECTOR BOS CHOCH STRUCTURE DETECTOR is a MetaTrader 5 market structure indicator designed to identify and visually display Break of Structure (BOS) and Change of Character (CHoCH) events directly on the chart. The indicator detects swing highs and swing lows using a configurable Swing Lookback period and monitors subsequent price closes for breaks of those structural levels. When a structural break is detected, the indicator draws a horizontal structure line from the broken
    Draw a level and observe how price reacts after tracking begins. Support Resistance Price Action for MetaTrader 5 works with your horizontal lines, rectangular zones, and trend lines. It records touches, bounces, and breakouts, and compiles statistics on subsequent price movement. Create an object on the chart, select it, and press Track. The indicator records its geometry and activation time. Events that occurred before that point are not included in the observations for the activated version o
    MQL5 Blogs = https://www.mql5.com/en/blogs/post/774983 MT4 Version = https://www.mql5.com/en/market/product/193085 MT5 Version = https://www.mql5.com/en/market/product/193086 KELTNER LIQUIDITY [tambangEA] is a professional market-structure and liquidity analysis indicator that combines the Keltner Channel trend framework with Buy-Side Liquidity (BSL), Sell-Side Liquidity (SSL), and confirmed liquidity sweep signals. The indicator is designed to help traders identify areas where price may be t
    Slope MA with Tester
    Mohammad Taher Halimi Tabrizi
    Rule-compliant Description Category: Trend Indicator Platform: MetaTrader 5 Type: Level Indicator Timeframes: All Trader Styles: Scalping, Day Trading, Swing Trading Markets: All Description The Slope MA With Tester is a technical indicator that evaluates the slope of a moving average relative to volatility (ATR). It highlights directional bias through a color-coded slope line and plots entry arrows when slope conditions change. Main features: Slope-based Calculation – The slope of an EMA is nor
    IchimokuStructure
    Venicius Soares Da Silva
    Ichimoku Structure S/R is a chart-window dashboard for M1: it classifies price vs Tenkan / Kijun / cloud as bullish, bearish, or range, shows the nearest Ichimoku level as a live S/R reference, flags impulsive breaks against that structure with historical context, and optionally monitors deal execution vs quotes plus a live structure-episode validation panel. It draws no classic Ichimoku lines (display is labels/panel). Research baseline baked into the tool is EURUSD M1 (2016-08-17 → 2026-06-09)
    HA Pullback Resume MT5 Systematic Trend Retracement and Momentum Resumption Engine The HA Pullback Resume indicator for MetaTrader 5 provides an objective analytical framework designed to identify high-probability trend-continuation setups following shallow corrective pullbacks. Active intraday traders and scalpers frequently encounter execution timing errors during trend pauses: entering prematurely before a correction completes, suffering stop-outs from erratic boundary wicks during quiet cons
    Professional VWAP Trading System with Advanced Signal Detection Transform your trading with the most comprehensive VWAP indicator available for MetaTrader 5. Magic VWAP Key Levels Pro combines multiple timeframe analysis, intelligent signal detection, and professional-grade visualization to give you the edge in modern markets. CORE FEATURES: Multi-Timeframe VWAP Analysis Session, Weekly, and Monthly VWAP calculations Previous 10-day VWAP support/resistance Dynamic anchor periods (Session/Week/Mo
    RSImaxmin
    Carlos Andrés Moya Erazo
    4.5 (10)
    The indicator shows when there are overprice and divergences on the RSI. In addition, it has configurable alerts, dynamic overprice levels and a special “RSI cleaner” function. The indicator that automatically calculates the premium rates! RSImaxmin is an indicator based on the Relative Strength Index (RSI) oscillator that effectively identifies changes in price trends as it reflects the relative strength of bullish movements compared to bearish movements. It is widely used by traders to measur
    MQL5 Blogs : https://www.mql5.com/en/blogs/post/770443 MT4 Version : https://www.mql5.com/en/market/product/157434 MT5 Version : https://www.mql5.com/en/market/product/178388 RANGE LADDER [tambangEA] is a professional visual analysis indicator built for traders who want a clearer view of market activity inside the visible chart range. The indicator creates a premium range-ladder dashboard that displays how tick-volume activity is distributed across price zones. It separates market activity int
    MSI-OBV Contour  What It Is  MSI-OBV Contour is an Expert Advisor that reads the On-Balance Volume (OBV) flow of the market across three higher timeframes plus the chart timeframe, applies envelope bands to that flow, and only enters when the path of least resistance is clear. It is designed for the trader who wants to make fewer, better decisions rather than chase every candle. It ships as a single file . The OBV engine is embedded inside the EA as a compiled resource  so you don't need to in
    Blogs : https://www.mql5.com/en/blogs/post/769823 MT4 : https://www.mql5.com/en/market/product/176181 MT5 : https://www.mql5.com/en/market/product/176182 VOLUME BUBBLE [tambangEA] is a premium visual volume-pressure indicator designed to help traders identify unusual market activity directly on the chart. The indicator detects abnormal delta/volume behavior and displays it as clean bubble markers around price action. Each bubble represents a volume-pressure event, allowing traders to quickly
    Buyers of this product also purchase
    Trend Sniper X
    Sarvarbek Abduvoxobov
    4.86 (44)
    Trend Sniper X is a multi-timeframe trend-following indicator for MetaTrader 5 that helps traders identify trend direction and potential reversal points with clarity and precision. for MT4: https://www.mql5.com/en/market/product/193245 Price Information: The current price is promotional and is subject to change as upcoming updates and new features are released. Bonus Offer: To get the FREE Auto-Trade Assistant EA for this indicator, please message the author after purchasing. Code2Profit Channe
    A new King in town - Indicator + Order management indications(tp1+tp2+tp3) + Optional Telegram Signal sender   INCLUDED (FREE) + Bonus EA Robot ( FULL TRADING  and SIGNAL SYSTEM ) Our best EA for Gold: Gold Slayer TRY > Reversion Queen  Expert advisor >JOIN Community Channel < NEW Free Automation EA link < click here ( disclaimer: this is new and still on testing and phase , use at your risk on demo) Free Telegram Bridge < click here  This indicator includes an advanced Strategy, a trading sys
    Entry Points Pro shows you where to enter, where to put the stop and what lot to trade — before you place the order. PRICE Now 199 USD: 8 copies at this price, then 249 USD. The final price is 349 USD. I make my money trading the markets, and I show it, so I don't need to sell this indicator to everyone. It is a tool for traders who think for themselves, not a magic button. No breakout, no trade. A gray arrow is a cancelled signal: price did not break the signal candle, so there was no entry
    M5 Sniper
    MeanFX
    5 (4)
    Get your trading edge in the line of sight M5 Sniper   is a new indicator by MeanFX. It combines   precise trading signals   with   adaptive TP/SL levels   - creating best possible statistical trades as a result! The price increases every 5 purchases, the next price is 79$ Message me after purchase to receive tips/guide and bonus EA plus trading methodology Auto Optimisation only works on LIVE chart , needs data feed >JOIN Community Channel < What makes it stand out?   Proven statistical per
    Gann Made Easy   is a professional and easy to use Forex trading system which is based on the best principles of trading using the theory of W.D. Gann. The indicator provides accurate BUY and SELL signals including Stop Loss and Take Profit levels. You can trade even on the go using PUSH notifications. PLEASE CONTACT ME AFTER PURCHASE TO GET TRADING  INSTRUCTIONS   AND GREAT EXTRA INDICATORS  FOR FREE! Probably you already heard about the Gann trading methods before. Usually the Gann theory is a
    Ultra Indicator
    Ihor Otkydach
    5 (1)
    ULTRA is a technical indicator that operates on an “all-in-one” basis—it independently analyzes the market, generates trading signals, displays levels for setting stop-loss orders, and suggests when to close trades to lock in profits or minimize losses. In other words, it doesn't matter if you don't know how to analyze the market, determine levels—where to set your stop-loss—or struggle with money management. ULTRA will do all of that for you! BUYER BONUS: After purchasing the ULTRA indicator, s
    SuperScalp Pro
    Van Minh Nguyen
    4.54 (37)
    SuperScalp Pro - Professional Multi-Layer Confluence Scalping System SuperScalp Pro is an advanced scalping indicator that upgrades the classic Supertrend with multiple intelligent confirmation filters. It helps you identify higher-probability Buy/Sell opportunities while significantly reducing false signals. Clear Buy and Sell arrows appear directly on the chart, along with automatic ATR-based Stop Loss and Take Profit levels calculated in real time. After purchase, please message me on MQL5 to
    SMC Intraday Formula
    VividMind Digital Solutions
    5 (26)
    Secure the Lowest Price Today. After purchase, contact via   MQL5 inbox   to receive your buyer kit and bonus. Let's be honest first. No indicator will make you profitable on its own. If someone tells you otherwise, they're selling you a dream. Every indicator that shows perfect buy/sell arrows can be made to look flawless — just zoom into the right window of history and screenshot the winners. We won't do that. SMC Intraday Formula is a tool. It reads the market structure for you, maps the hig
    Gold Trend Coach MT5
    Cristhian Alexander Gaibor Cuasquer
    4.27 (11)
    Non-repainting buy and sell signals for gold (XAUUSD) on MetaTrader 5. Every signal comes with a stop loss and three take profits. A Smart Money Concepts filter with BOS and CHoCH, so you trade with the structure, not against it. A live Mentor on your panel that guides every step from the entry to TP3. And alerts straight to your phone and your own Telegram channel. That is Gold Trend Coach. Never trade alone again. FREE BUYER KIT with your purchase: 1. Telegram Alert Bridge: your signals go to
    Boba Analysis Suite
    Trade Ready Solutions LLC
    5 (2)
    Boba Analysis Suite Boba Analysis Suite is an analytical indicator for MetaTrader 5. It brings market structure, relevant price zones and broader market context together in a single chart view. Developed through practical experience as a trader and trading coach, it supports a structured analysis process: assessing market direction, identifying important levels and considering multiple timeframes together. Analysis in Context Individual signals gain meaning through context. Boba Analysis Suite h
    FX Power MT5 NG
    Daniel Stein
    5 (33)
    FX Power: Analyze Currency Strength for Smarter Trading Decisions Overview FX Power is your go-to tool for understanding the real strength of currencies and Gold in any market condition. By identifying strong currencies to buy and weak ones to sell, FX Power simplifies trading decisions and uncovers high-probability opportunities. Whether you’re looking to follow trends or anticipate reversals using extreme delta values, this tool adapts seamlessly to your trading style. Don’t just trade—trade
    FiboSniper Pro
    Van Minh Nguyen
    5 (4)
    FiboSniper Pro - Multi-Filter Fibonacci System with Auto SL/TP and Control Panel FiboSniper Pro is a technical indicator that combines dynamic Fibonacci Envelopes with multiple confirmation filters to generate selective Buy and Sell signals. Fibonacci levels are calculated from Moving Average and ATR, then filtered by ADX, EMA, RSI, ATR, Volume, Time and Candle structure. The indicator displays automatic ATR-based Stop Loss and Take Profit levels directly on the chart, along with an interactive
    M1 Sniper MT5
    Oleg Rodin
    5 (7)
    M1 SNIPER  is an easy to use trading indicator system. It is an arrow indicator which is designed for M1 time frame. The indicator can be used as a standalone system for scalping on M1 time frame and it can be used as a part of your existing trading system. Though this trading system was designed specifically for short-term trading, it still can be helpful for all traders. This trading system can be used with any forex pair and time frame, though lower time frames are recommended from M1 up to M
    Apex Patterns PRO Buy Indicator - Get Expert Advisor Based on it for FREE. Self-Optimizing Chart Pattern & Breakout Intelligence Traditional pattern scanners rely on fixed inputs, often underperforming when market volatility and structures shift. Apex Patterns PRO is designed to adapt to changing market conditions by combining structural chart pattern recognition, momentum filtering, and statistical self-optimization into one analytical framework. Adaptive Scanning Engine Self-Optimizing Patter
    SQN Max indicator for MT5 by ITC
    Renaud Herve Francois Candel
    Sqn Max Indicator Sqn Max is an exclusive indicator to trade the market with high effectiveness. The indicator is based on price action, volatility and trend. This indicator is as simple as possible but not too simple. The indicator can generate alerts to ease the trading process. You don't have to stay all day in front of your screen. The indicator can be used with any class of assets and with any time frame. It is possible to achieve better results trading our list of selected assets. We achi
    Adaptive Price Action Engine Buy Indicator- Get EA Based on it for FREE. Self-Optimizing Multi-Timeframe Trend & Candlestick Intelligence Markets do not behave the same way all the time—and not every price-action pattern has the same value in every market regime. Adaptive Price Action Engine is designed to adapt to changing market conditions by combining trend structure, multi-timeframe analysis, candlestick patterns, and statistical optimization into one analytical framework. Two Adaptive Mode
    Tokyo mt5 Indicator
    Vasiliy Strukov
    5 (15)
    Tokyo Indicator provides a clear visual overview of trend direction, potential trading signals, and market conditions. Its colour-coded, stepped trend line distinguishes bullish phases in blue from bearish phases in magenta. Matching directional arrows highlight potential buying and selling opportunities when the displayed trend changes. An integrated dashboard brings together the current signal, market bias, momentum, volatility, and signal quality in one convenient view. This allows traders t
    Welcome to Entry In The Zone & SMC Multi Timeframe —  COMPLETE SMC ANALYSIS SYSTEM — ALL IN ONE INDICATOR Entry In The Zone & SMC Multi Timeframe  An indicator designed for market analysis based on Smart Money Concepts (SMC), displaying Market Structure, Key Zones (Order Blocks, Supply & Demand Zones, and Fair Value Gaps), Liquidity, and real-time BUY / SELL signals. It supports both Single-Timeframe and Multi-Timeframe analysis, along with the Confluence at Zone feature, which helps you evaluat
    Divergence Bomber
    Ihor Otkydach
    4.89 (94)
    Each buyer of this indicator also receives the following for free: The custom utility "Bomber Utility", which automatically manages every trade, sets Stop Loss and Take Profit levels, and closes trades according to the rules of this strategy Set files for configuring the indicator for various assets Set files for configuring Bomber Utility in the following modes: "Minimum Risk", "Balanced Risk", and "Wait-and-See Strategy" A step-by-step video manual to help you quickly install, configure, and
    Power Candles MT5
    Daniel Stein
    4.58 (12)
    Power Candles - Self-Optimizing Strength Indicator Strength usually lives in a sub-window. The line runs below, the candle above, and your eye keeps connecting the two. Power Candles puts the strength into the candle itself, colored from dark red to dark green, so the chart reads at a glance and the sub-window stays closed. The indicator also finds its own settings for the symbol and timeframe in front of you. One click on [ Apply Best ] draws entry, Stop Loss and Take Profit at the exact prices
    Currency Strength Wizard   is a very powerful indicator that provides you with all-in-one solution for successful trading. The indicator calculates the power of this or that forex pair using the data of all currencies on multiple time frames. This data is represented in a form of easy to use currency index and currency power lines which you can use to see the power of this or that currency. All you need is attach the indicator to the chart you want to trade and the indicator will show you real s
    Crystal Heikin Ashi Signals
    Muhammad Jawad Shabir
    5 (5)
    Crystal Heikin Ashi Signals—Professional Trend & Signal Detection Indicator Advanced Heikin Ashi Visualization with Intelligent Signal System for Manual & Automated Trading Final Price: $149 ---------> Price goes up $10 after every 10 sales . Limited slots available — act fast . Overview User Guide PDF Crystal Heikin Ashi Signals is a professional-grade MetaTrader 5 indicator that combines pure Heikin Ashi candle visualization with an advanced momentum-shift detection system. Designed for both m
    Auto Optimized SpeedAngle is an institutional-grade momentum vectoring system that eliminates curve-fitting through continuous Walk-Forward Optimization (WFO). Rather than relying on static inputs that degrade when market regimes shift, the indicator dynamically recalibrates its parameters using Out-of-Sample (OOS) validation, ensuring the displayed signals represent genuine statistical edges rather than historical anomalies. By shifting the focus from subjective visual angles to normalized, qua
    Multi Currency Strength and Momentum Indicator MT5 Dynamic Forex28 Navigator is the evolution of our long-time, popular indicators, combining the power of five in one: Advanced Currency Strength28 Indicator (700 reviews) Advanced Currency IMPULSE with ALERT (530 reviews) Currency Strength EXOTICS GOLD Impulse with Alert CS28 Combo Signals (recent Bonus) No need to buy four indicators and stack them on your charts. All of it is merged into one powerful indicator: the strength of the 28 Forex pair
    Azimuth Pro
    Ottaviano De Cicco
    5 (7)
    Azimuth Pro V2: Synthetic Fractal Structure and Confirmed Entries for MT5 Overview Azimuth Pro is a multi-level swing structure indicator by Merkava Labs . Four nested swing layers, swing-anchored VWAP, ABC pattern detection, three-timeframe structural filtering, and closed-bar confirmed entries — one chart, one workflow from micro-swings to macro-cycles. This is not a blind signal product. It is a structure-first workflow for traders who care about location, context, and timing. 1. What Change
    DayTrader PRO
    Davit Beridze
    5 (4)
    DayTrader PRO (Buy DayTrader PRO and get Another Paid Self Optimizing indicator for FREE as BONUS!) DayTrader PRO is an advanced trading indicator that combines John Ehlers' Laguerre Filter with a powerful Auto-Optimization Engine. Instead of using fixed parameters, the indicator automatically searches for the best settings based on recent market conditions, helping you adapt to changing volatility without constant manual adjustments. The indicator generates clear BUY and SELL signals together
    ARICoins
    Temirlan Kdyrkhan
    ARICoin is a powerful trading companion designed to generate high-probability entry signals with dynamic TP/SL/DP levels based on volatility. Built-in performance tracking shows win/loss stats, PP1/PP2 hits, and success rates all updated live. Key Features: Buy/Sell signals with adaptive volatility bands Real-time TP/SL/DP levels based on ATR Built-in MA Filter with optional ATR/StdDev volatility Performance stats panel (Success, Profit/Loss, PP1/PP2) Alerts via popup, sound, push, or email Cust
    FX Trend MT5 NG
    Daniel Stein
    5 (6)
    FX Trend NG: The Next Generation Multi-Market Trend Intelligence Overview FX Trend NG is a professional multi-timeframe trend and market monitoring tool designed to give you a complete structural overview of the market in seconds. Instead of switching between dozens of charts, you instantly see which symbols are trending, where momentum is fading, and where strong alignment exists across timeframes. This tool is part of the Stein Investments ecosystem: setup guides, videos, workshops and Max,
    PZ Swing Trading MT5
    PZ TRADING SLU
    5 (5)
    Protect against whipsaws: revolutionize your swing trading approach Swing Trading is the first indicator designed to detect swings in the direction of the trend and possible reversal swings. It uses the baseline swing trading approach, widely described in trading literature. The indicator studies several price and time vectors to track the aggregate trend direction and detects situations in which the market is oversold or overbought and ready to correct. [ Installation Guide | Update Guide | Tro
    FX Volume MT5
    Daniel Stein
    4.79 (24)
    FX Volume: Experience Genuine Market Sentiment from a Broker’s Perspective Quick Overview Looking to elevate your trading approach? FX Volume provides real-time insights into how retail traders and brokers are positioned—long before delayed reports like the COT. Whether you’re aiming for consistent gains or simply want a deeper edge in the markets, FX Volume helps you spot major imbalances, confirm breakouts, and refine your risk management. Get started now and see how genuine volume data can
    More from author
    The Liquidation Zones Heatmap is a custom technical indicator designed for the MetaTrader 4 (MT4) platform. It calculates and visualizes estimated liquidation zones based on price action and internal algorithms, displaying them as a dynamic heatmap on the chart. These zones are known by several names, sometimes referred to as liquidity pools, liquidity levels, leverage levels, liquidation heatmap levels, leverage heatmap zones, or leverage heatmap levels. These zones represent potential areas of
    Auto Elliott Engine The Auto Elliott Engine is a tool designed for MetaTrader 4 that automates the identification, decomposition, and projection of price structures based on the Elliott Wave Theory. Powered by a pattern-recognition engine, this indicator processes price action to identify market configurations, translating data into structured scenarios. Key Features Multi-Degree Recognition: Analyzes price action across multiple fractal levels. From higher degrees, such as Supercycle or Cycle,
    The Smart Liquidation Clusters  is a custom technical indicator designed for the MetaTrader 4 (MT4) platform. It calculates and visualizes   estimated liquidation zones   based on price action and internal algorithms, displaying them as a dynamic heatmap on the chart. These zones are known by several names, sometimes referred to as liquidity pools, liquidity levels, leverage levels, liquidation heatmap levels, leverage heatmap zones, or leverage heatmap levels. These zones represent   potential
    The   Smart Liquidation Clusters    is a custom technical indicator designed for the MetaTrader 5 (MT5) platform. It calculates and visualizes   estimated liquidation zones   based on price action and internal algorithms, displaying them as a dynamic heatmap on the chart. These zones are known by several names, sometimes referred to as liquidity pools, liquidity levels, leverage levels, liquidation heatmap levels, leverage heatmap zones, or leverage heatmap levels. These zones represent   potent
    SMC Framework Pro
    Enrique Gauto Sand
    SMC Framework Pro is a technical analysis indicator developed for the MetaTrader 5 platform. It integrates multiple tools commonly associated with Smart Money Concepts (SMC) into a single environment, focusing on the visualization of price action, market structure, and selected price patterns. The indicator processes historical and incoming price data to identify structural points, price imbalances, and recurring formations. Its purpose is to assist in chart analysis by organizing this informati
    SMC Pattern Detector  is a technical analysis tool based on  Smart Money Concepts (SMC) . This indicator automates the identification of market structure, supply/demand zones, and SMC patterns. Built on a  No-Repaint  architecture, all signals are confirmed on closed bars. We believe in 100% transparency. Don't just rely on screenshots; watch how the indicator reacts to real-time market conditions. Check out our recorded live streams to see the scalping setups and signals as they happen. Watch t
    Elliott Wave ABC
    Enrique Gauto Sand
    Elliott Wave ABC  Overview Elliott Wave ABC is an interactive indicator designed for MetaTrader 5 (MT5) that automates the detection, scoring, and visualization of Elliott Wave Zig-Zag (A-B-C) structures. It scans chart data to locate both completed and incomplete Zig-Zag patterns, offering structural analysis, Fibonacci projection targets, and a stacked dual-panel user interface. This Elliott Wave indicator is only focused an ABC - Zig-Zag Pattern. --- Key Features 1. Automated Zig-Zag D
    Crypto Liquidation Zones is a technical visualization tool designed for MetaTrader 5 that attempts to estimate and display theoretical liquidation areas on the chart. Based on historical price extremes and user-defined leverage levels, the indicator models where leveraged market participants could potentially face stop-outs or liquidation thresholds, representing these zones via a dynamic on-chart heatmap overlay. WHAT IT DOES  - Theoretical Zone Estimation: Derives estimated liquidation pri
    Gold Liquidation Momentum is a premium, volume and momentum indicator specifically optimized for Gold (XAUUSD) , Forex, and major Indices. It analyzes price-action dynamics and tick volume to model hypothetically the momentum of different market participants and visualizes hypothetically  buyer/seller dominance in real-time. How It Works The indicator tracks market volume across 5 distinct leverage tiers (100x, 50x, 35x, 25x, and 10x). Using an advanced mathematical decay formula tailored for no
    Astro Gann Cycles
    Enrique Gauto Sand
    Overview Astro Gann Cycles is an analytical timing indicator for MetaTrader 5 inspired by interpretations of W.D. Gann's work. Astro Gann Cycles tries to calculates planetary positions directly within MetaTrader to identify repeating astronomical configurations. By analyzing the celestial backdrop associated with major market highs and lows, the indicator models hypothetical cycle waves that could help anticipate potential timing windows where market turning points might occur. Important Note :
    Astro Gann Intraday Astro Gann Intraday is an technical timing tool developed for MetaTrader 5 that maps hypothetical short-term astronomical cycles onto intraday price charts (M1 to H1). Inspired by W.D. Gann's work, the tool tries to   examine real-time celestial coordinates—primarily the Moon's movement, fast planetary positions, and local diurnal rotation angles—to help traders study potential harmonic timing windows. Overview Astro Gann Intraday  focus exclusively on fast-moving celestial b
    Filter:
    No reviews
    Reply to review