
SwingVWAP Thermal Pro
- Indicators
-
Khac Thanh Bui
 Turning trading logic into algorithmic precision. I develop professional-grade tools for FX and Gold, bridging the gap between practical trading needs and high-end software development.
WHAT I BUILD: - Version: 1.51
- Updated: 21 June 2026
SwingVWAP Thermal Pro
A swing-anchored VWAP indicator for MetaTrader 5 that combines adaptive volume-weighted price analysis with a liquidity thermal heatmap to identify key price levels and market structure.
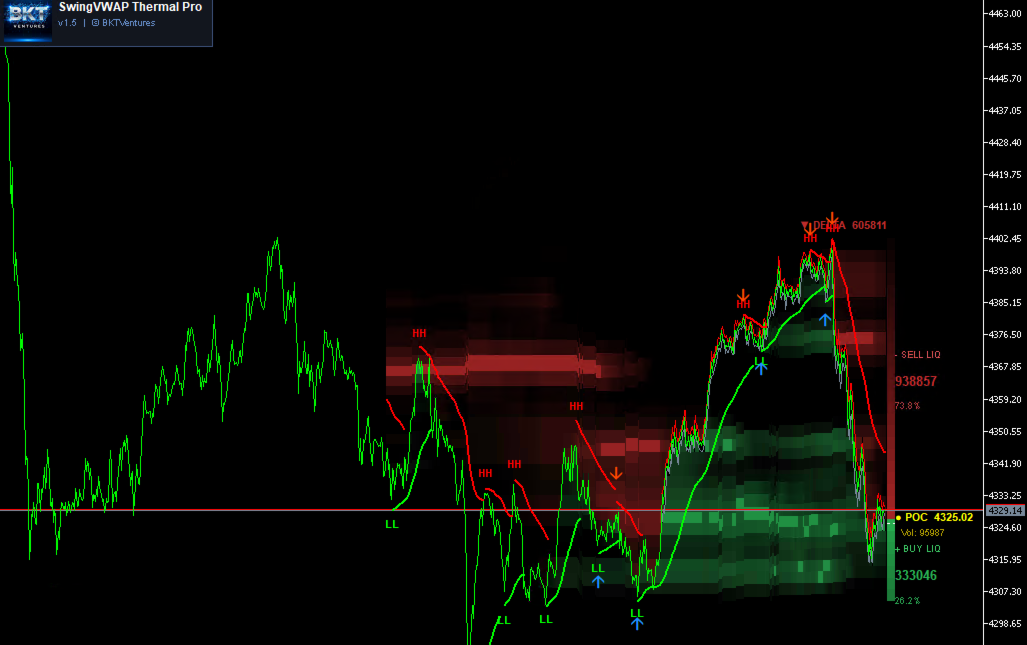
SwingVWAP Thermal Pro is a chart indicator for MetaTrader 5 built around two complementary analytical systems working together on the same chart. The first system detects swing highs and swing lows using a configurable lookback period, classifies each pivot as HH, HL, LH, or LL, and draws a volume-weighted average price line anchored to each identified swing point. The second system overlays a real-time liquidity heatmap that maps volume distribution across 31 price bins within a sliding window of recent bars, revealing where the market has transacted most heavily.
Overview
The swing detection engine scans each bar for local extremes using a monotonic deque algorithm, which computes sliding maximum and minimum values across the full history in a single linear pass. When the market structure shifts direction, the indicator labels the new pivot and begins a fresh VWAP calculation anchored to that swing point. The VWAP is computed using an exponentially weighted moving average of the HLC3 price multiplied by tick volume, with an adjustable smoothing period. When adaptive mode is enabled, the smoothing period shortens automatically during high-volatility conditions and lengthens during quiet periods, based on the ratio between current ATR and its 50-period running average.
The heatmap component divides the high-low range of a configurable lookback window into 31 equal-width price bins. For each visible bar, the indicator accumulates tick volume for all bars within the window whose closing price falls inside each bin, then renders the result as a semi-transparent rectangle. Bins with higher accumulated volume appear more opaque; bins below the configured sensitivity threshold are hidden entirely. The Point of Control, the bin with the highest volume, is highlighted separately. A right-side volume profile sidebar shows the split between buying-side and selling-side liquidity in absolute and percentage terms, together with the current imbalance figure.
Buy and sell signals are generated when a new pivot is classified as LL (potential demand zone) or HH (potential supply zone), respectively. Arrows are plotted at a distance proportional to the current ATR value. Optional pop-up alerts fire on the current bar when a new signal is detected.
Key Features
- Swing-anchored VWAP with pivot classification: Each new swing segment starts a fresh volume-weighted average price calculation anchored to the detected pivot. Pivots are labeled HH, HL, LH, or LL based on comparison with the previous pivot of the same direction.
- Adaptive smoothing period: When adaptive mode is active, the EWMA period adjusts dynamically using the ATR ratio, reducing lag in volatile conditions and smoothing output during low-volatility periods. The volatility bias parameter controls the strength of this adjustment.
- Liquidity thermal heatmap: Volume distribution across 31 price bins is rendered as a color-coded overlay for each bar in the visible window. Three profile depth settings (Shallow, Balanced, Deep) control the lookback window, and three sensitivity settings control the minimum volume threshold for display.
- Right-side volume profile sidebar: The most recent bar projects a lateral profile to the right of the chart showing buy-side and sell-side liquidity volumes, their percentage split, and the current order flow imbalance.
- HH/HL/LH/LL pivot labels: Each confirmed swing pivot receives a colored label directly on the chart. High-side pivots use one configurable color and low-side pivots use another, making market structure immediately readable.
- Signal arrows with alert support: Optional buy and sell arrows can be displayed for a configurable number of historical bars. Pop-up alerts can be enabled to notify when a new signal is detected on the current bar.
- Incremental rendering engine: On new bar open, the heatmap performs an incremental update rather than a full redraw. Only the oldest bar leaving the visible window is removed, the penultimate bar's right edge is extended, and the new bar is computed and drawn. This keeps the indicator responsive on large chart histories.
- Configurable draw history limit: A maximum bar count setting controls how far back VWAP segments and pivot labels are drawn, preventing performance issues on very long chart histories.
How It Works
On the first load, the indicator performs a full calculation pass over the available history. The sliding maximum and minimum arrays are populated in a single O(n) pass using a monotonic deque, shared between the swing detection and heatmap modules. The swing engine then walks the history bar by bar, tracking the current dominant direction and updating VWAP values. Whenever direction changes, the previous segment is drawn on the chart and a new segment begins. On each subsequent tick, only new or modified bars are processed. When a new bar opens, the swing module rebuilds from scratch because swing structure depends on the full price history, while the heatmap module updates incrementally to avoid unnecessary redraws.
Recommended Use
The indicator works on any symbol and timeframe supported by MetaTrader 5. Swing period values between 20 and 100 are suitable for most timeframes; shorter values detect minor swings and produce more frequent pivots, while longer values focus on major structural turning points. The heatmap is most readable on timeframes from M15 upward, where there is sufficient bar history to accumulate meaningful volume distributions. The right-side profile requires the chart shift setting, which the indicator enables automatically on load and restores on removal.
Parameters
Swing Points:
- Swing Period — Number of bars used to identify local highs and lows — Default: 50
- Adaptive Price Tracking — Base smoothing period for the EWMA VWAP calculation — Default: 20
- Adapt by ATR Ratio — When enabled, the smoothing period adjusts dynamically based on current volatility relative to its average — Default: false
- Volatility Bias — Controls how strongly volatility changes compress or expand the smoothing period (higher values produce stronger adjustment) — Default: 10.0
Style:
- Pivot Label Color — High — Color applied to HH and HL pivot labels — Default: Lime
- Pivot Label Color — Low — Color applied to LH and LL pivot labels — Default: Red
- VWAP Color — Uptrend — Line color for VWAP segments in upward swing phases — Default: Lime
- VWAP Color — Downtrend — Line color for VWAP segments in downward swing phases — Default: Red
- VWAP Line Width — Line thickness from 1 to 5 — Default: 2
Signals:
- Show Buy/Sell Signals — Enable or disable signal arrow display — Default: true
- Buy Arrow Color — Color of the upward arrow placed at LL pivots — Default: DodgerBlue
- Sell Arrow Color — Color of the downward arrow placed at HH pivots — Default: OrangeRed
- Arrow Size — Arrow object size from 1 to 5 — Default: 3
- Signal History — Number of historical bars over which signals are drawn — Default: 150
- Enable Alerts — Trigger a pop-up alert when a new signal appears on the current bar — Default: false
Performance:
- Max History Bars to Draw — Limits how many bars back VWAP segments and pivot labels are rendered; set to 0 to draw all available history — Default: 3000
Heatmap:
- Profile Depth — Selects the lookback window for volume accumulation: Shallow Profile (100 bars), Balanced Profile (300 bars), or Deep Profile (600 bars) — Default: Balanced Profile
- Sensitivity — Controls the minimum volume threshold for bin display: High Contrast hides low-volume bins, Smooth shows all bins, Balanced is the middle setting — Default: Balanced
- Upper Liquidity Color — Color applied to price bins above the current close — Default: dark red
- Lower Liquidity Color — Color applied to price bins below the current close — Default: dark green
- Hide Active Candle Color — Suppresses heatmap coloring for price levels overlapping the current open, close, midpoint, and HLC3 of the active bar — Default: true
- Heatmap Visible Bars — Number of bars for which the heatmap overlay is rendered — Default: 300
Past performance in backtesting or visual inspection of historical chart data does not guarantee future results. Use this indicator as one component of a complete trading approach that includes your own risk management rules.









































Good indicator but it shifts the whole chart too much to the left. Edit. The previous update fixed the issue by adding adjustable shift. Perfect