Trader Command Center
- Utilities
-
Khac Thanh Bui
 Turning trading logic into algorithmic precision. I develop professional-grade tools for FX and Gold, bridging the gap between practical trading needs and high-end software development.
WHAT I BUILD: - Version: 1.6
Trader Command Center
A full-chart real-time trading dashboard for MetaTrader 5, combining account monitoring, prop firm rule tracking, risk gate management, and direct trade execution in a single Canvas-rendered interface.
Trader Command Center is a utility for MetaTrader 5 that replaces the standard chart view with a comprehensive, responsive dashboard built for traders who need a unified workspace — one screen to track account health, monitor prop firm compliance, manage open positions, and execute market orders with pre-calculated lot sizing. The interface renders through the Canvas engine and scales automatically to any chart size.
Overview
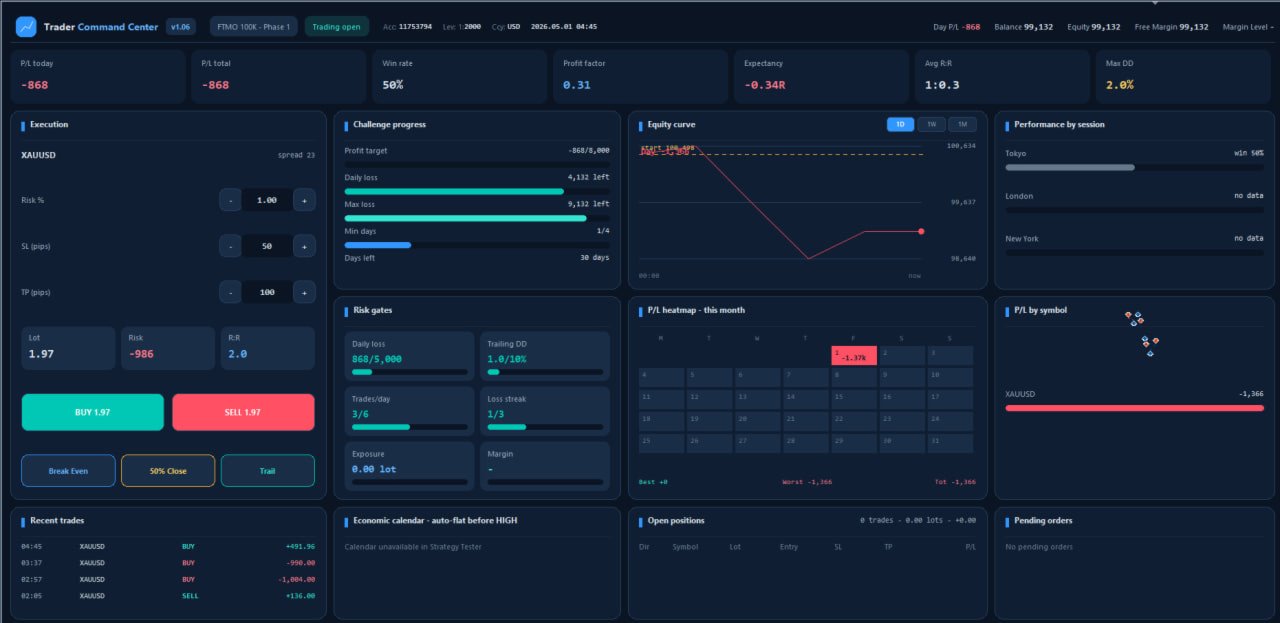
The dashboard is organized into a persistent header, a row of seven performance metrics, and a four-column body covering execution, challenge progress, equity curve, risk gates, session performance, symbol breakdown, economic calendar, open positions, recent trades, and pending orders. All panels refresh continuously from live account data and trade history.
The header displays account number, leverage, currency, current time, balance, equity, free margin, and margin level. A status badge indicates whether trading is open or locked. The seven KPI tiles show today's P/L, total P/L, win rate, profit factor, expectancy in R-multiples, average risk-reward ratio, and maximum drawdown — all computed from the configured history window.
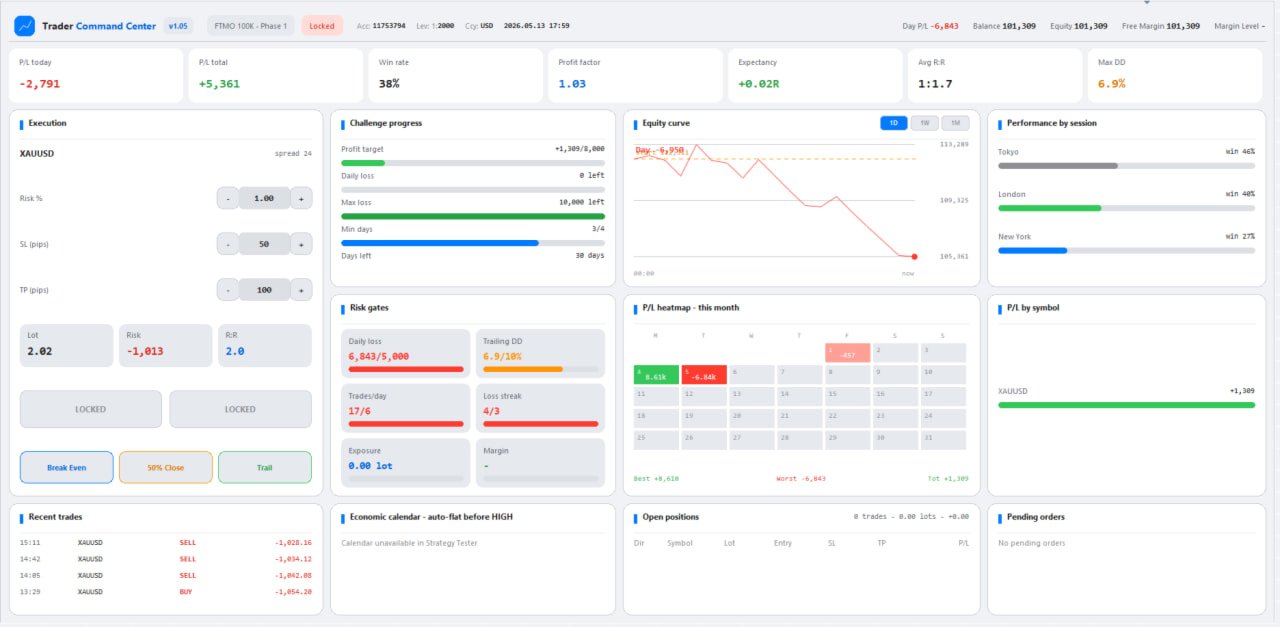
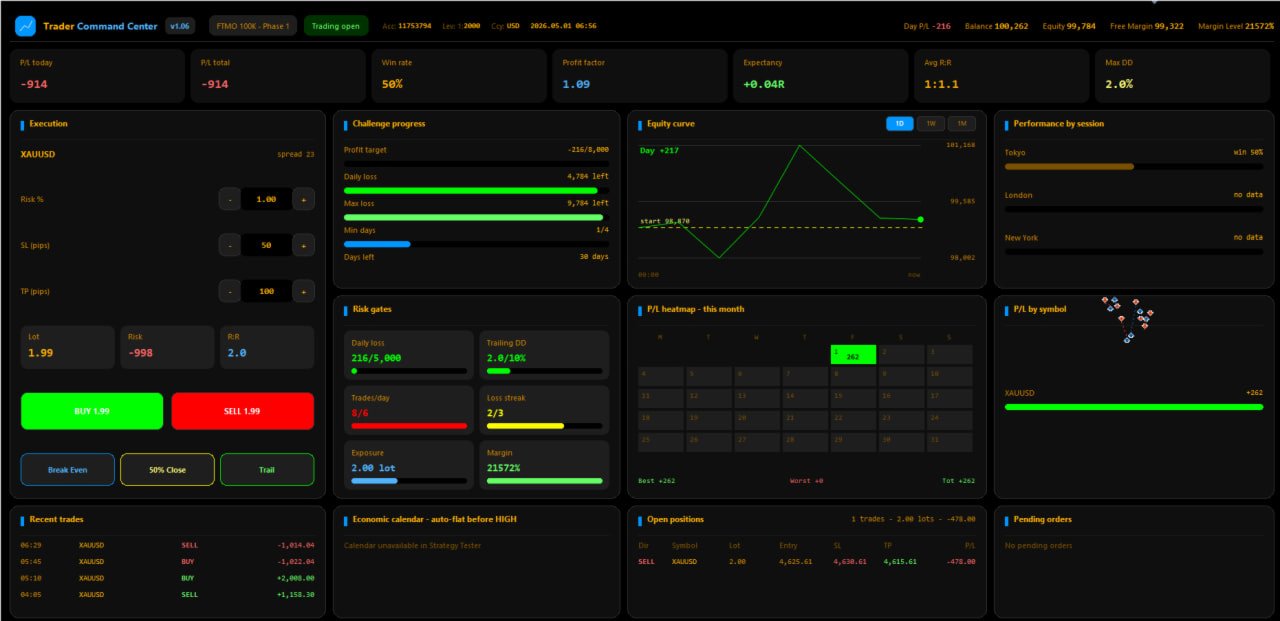
Fast data such as open positions and margin level refresh every second. Historical statistics recalculate every thirty seconds. The economic calendar polls once per minute. Five theme options are available — Modern Dark, Flat Light, Deep Sea, Solarized Dark, and Bloomberg Terminal — each applying a complete color palette to every UI element, including the chart background.
Key Features
- Prop firm compliance panel: Tracks profit target progress, remaining daily loss buffer, remaining maximum loss buffer, minimum traded days, and challenge days remaining. Each item renders as a labeled progress bar that transitions from green through amber to red as the limit approaches.
- Six-gate risk dashboard: Monitors daily loss used, trailing drawdown percentage, trades placed today, consecutive loss streak, total open lot exposure, and current margin level — presented in a two-column grid with individual progress bars and color-coded values.
- Integrated execution panel: Stepper controls adjust risk percentage, stop loss in pips, and take profit in pips. Lot size, monetary risk, and risk-reward ratio are calculated and displayed in real time before any order is placed. Buy and sell buttons execute market orders with all parameters applied automatically.
- Position management controls: Break-even moves the stop loss to entry price for all open positions on the current symbol. Partial close reduces position volume by a configurable percentage. Trailing stop adjusts continuously on each tick while the toggle is active.
- Equity curve with three time windows: Displays realized and floating equity for today, the past seven days, or the past thirty days, with the start-of-period balance marked as a dashed reference line and net change shown in the chart area.
- Monthly P/L heatmap calendar: Renders the current month as a grid of daily cells color-coded by profit intensity — two shades of green for profitable days and two shades of red for losing days. Daily P/L amounts appear inside each cell, with best day, worst day, and month total summarized below the grid.
- Session and symbol performance: Win rate per session (Tokyo, London, New York) and cumulative P/L per symbol are shown as labeled bar charts, calculated from the history window.
- Automatic daily lock: When the daily loss limit is reached, the execution buttons disable and the header badge changes to indicate a locked state. An optional setting triggers an immediate close of all open positions and cancellation of pending orders at the moment the lock activates.
How It Works
On initialization, the dashboard hides all standard chart decorations — grid, price scale, date scale, OHLC display, bid and ask lines — and creates a full-size Canvas bitmap over the chart area. The bitmap redraws at the configured frame interval and resizes automatically when the chart window changes. Trade statistics are derived in a single pass over the MetaTrader 5 history pool, computing win rate, profit factor, expectancy, maximum drawdown, session breakdown, symbol breakdown, and monthly heatmap data in one operation. Clickable controls register their bounding areas each frame so hover effects and click actions resolve accurately.
Recommended Settings
The dashboard works with any symbol and timeframe. Attaching it to a dedicated chart keeps the workspace separate from analysis charts. A minimum resolution of 800 by 450 pixels is required for the full layout; a warning panel appears when the chart falls below the configured scale threshold. A VPS or always-on workstation is recommended for continuous monitoring and uninterrupted trailing stop operation.
Input Parameters
Layout and display:
- Dashboard UI theme — Select from five visual themes: Modern Dark, Flat Light, Deep Sea, Solarized Dark, Bloomberg Terminal — Default: Modern Dark
- Baseline chart width — Reference width in pixels for scale calculations — Default: 1600
- Baseline chart height — Reference height in pixels for scale calculations — Default: 900
- Minimum scale warning threshold — Percentage of baseline below which a size warning appears — Default: 50
- Render interval — Milliseconds between canvas redraws — Default: 33
Account and prop firm rules:
- Initial balance — Starting balance for P/L calculations; 0 captures current balance at startup — Default: 0
- Profit target — Target profit in account currency — Default: 8000
- Daily loss limit — Maximum allowed daily loss in account currency — Default: 5000
- Maximum overall loss limit — Maximum total loss measured from initial balance — Default: 10000
- Minimum trading days — Minimum days with at least one closed trade — Default: 4
- Challenge length — Total days in the challenge period — Default: 30
- Challenge start date — Start date for days-remaining calculation; 0 if unknown — Default: 0
- Account header label — Custom text shown in the dashboard header — Default: FTMO 100K - Phase 1
Risk gates:
- Maximum trades per day — Daily order count limit — Default: 6
- Maximum consecutive losses — Loss streak threshold — Default: 3
- Maximum drawdown limit — Drawdown percentage threshold — Default: 10
- Daily reset hour — Broker time hour for daily counter reset — Default: 0
Execution:
- Default risk per trade — Initial risk percentage of account equity — Default: 1.0
- Default stop loss — Initial stop loss in pips — Default: 50
- Default take profit — Initial take profit in pips; set to 0 to disable — Default: 100
- Risk stepper increment — Risk percentage change per button press — Default: 0.25
- Stop loss and take profit stepper increment — Pip change per button press — Default: 5
- Trailing stop distance — Distance in pips for the built-in trailing stop — Default: 30
- Partial close size — Percentage of position volume closed per action — Default: 50
- Order magic number — Magic number for orders placed through the execution panel — Default: 990001
- Close all on lock — Close open positions and cancel pending orders when lock triggers — Default: false
- Maximum deviation — Maximum allowed slippage in points — Default: 20
The trailing stop and automatic lock functions operate only while the dashboard is active on a live chart. Ensure the terminal remains connected and the utility is running if continuous position management is required.