
SMC Compass MT5
- Indicators
-
Khac Thanh Bui
 Turning trading logic into algorithmic precision. I develop professional-grade tools for FX and Gold, bridging the gap between practical trading needs and high-end software development.
WHAT I BUILD: - Version: 1.10
- Updated: 30 April 2026
SMC Compass MT5
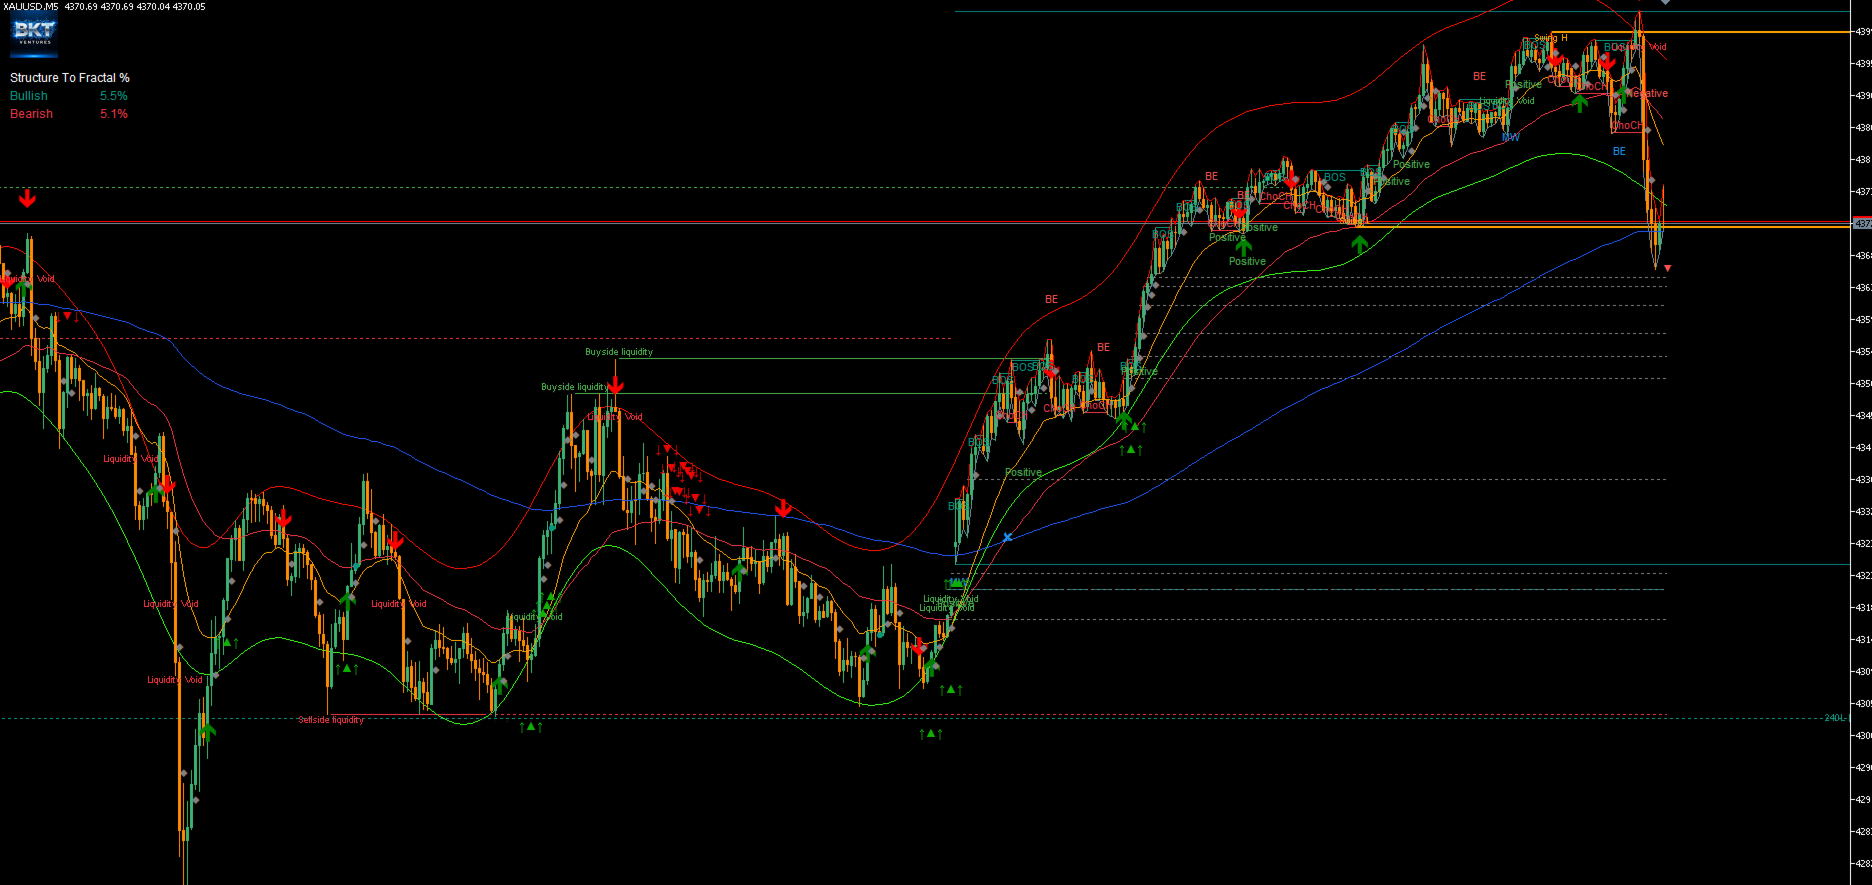
A multi-module Smart Money Concepts indicator for MetaTrader 5, combining market structure analysis, multi-timeframe order blocks, fair value gaps, liquidity detection, and swing failure patterns into a single unified toolkit.
SMC Compass MT5 is a comprehensive price action indicator built around institutional trading methodology. It reads the market through the lens of Smart Money Concepts, identifying the structural footprints that large participants leave behind. Rather than a single signal line, it layers multiple analytical modules on the chart simultaneously, giving traders a complete view of market context before committing to a trade.
The indicator is designed for traders who study price action seriously. It does not generate mechanical buy or sell signals. Instead, it draws the structural context, key liquidity zones, order blocks, and momentum shifts that inform discretionary decision-making across any tradable instrument on MetaTrader 5.
Overview
At its core, SMC Compass MT5 tracks market structure by detecting fractal-based swing highs and swing lows, then marking Break of Structure (BOS) and Change of Character (ChoCH) events as price crosses those levels. These labels update in real time as confirmed bars close, providing a continuous structural narrative across the chart without repainting on historical bars.
Fair Value Gaps are identified on both the upside and downside within a configurable lookback window. Each gap is rendered as a shaded box that extends forward until the price fills it to the midpoint or the full gap edge, depending on the selected fill condition. Filled gaps are removed automatically to keep the chart uncluttered.
The liquidity detection module scans for clusters of pivot highs and pivot lows that align within a defined ATR margin. When three or more swing points converge near the same price, the indicator marks that area as a buyside or sellside liquidity pool. These zones are tracked continuously and updated as price sweeps through them.
Swing Failure Patterns are detected by identifying pivot points that have been breached intrabar but closed beyond them, indicating a failed breakout. A cooldown period prevents repeated signals in the same zone, and confirmation is required across the preceding three bars before a sweep label appears.
The UT Bot module runs an ATR-based trailing stop calculation on every bar and marks crossover and crossunder events with arrow signals, providing a momentum-aligned entry filter that complements the structural analysis.
Key Features
- Market Structure BOS and ChoCH: Fractal pivots are tracked with a configurable length. When price closes beyond a prior swing, the indicator draws a horizontal line spanning the structural break and labels it BOS or ChoCH depending on the prevailing order flow state. Bullish and bearish structures are displayed in separate colors.
- Fair Value Gap detection: Both bullish and bearish FVGs are identified across a user-defined day range. A per-direction box limit follows the standard Pine-equivalent behavior of 12 visible gaps, evicting the oldest when the limit is reached. An optional CE line marks the midpoint of each gap.
- Multi-cluster liquidity zones: The indicator measures ATR-based proximity across recent swing pivots and groups them into buyside and sellside pools. Each pool is visualized with a zone box, a solid line, and an optional dotted trailing line extending to the current bar.
- Swing Failure Pattern sweep labels: Failed breakouts at prior pivot highs and lows are identified when price breaches the level intrabar and closes back beyond it, with three-bar confirmation and a configurable cooldown to control label frequency.
- Nadaraya-Watson envelope: A kernel regression envelope is computed over a configurable window using Gaussian weights. The upper and lower bands represent price extremity zones. Optional SMA overlay signals mark when short-term moving averages cross the envelope boundaries.
- SMT divergence detection: The indicator compares pivot highs and lows on the primary symbol against up to two user-defined comparison symbols. When pivot swings move in opposite directions across correlated instruments, a divergence line is drawn connecting the two pivot points.
- Support and Resistance MTF with break and retest tracking: Pivot-based SR levels are drawn for the current timeframe and an optional higher timeframe. Bars where price closes through a level are labeled with a B marker, and subsequent retests are labeled with an R marker. An optional canvas panel summarizes break and retest counts in a draggable overlay.
- Trend Channels: Descending and ascending price channels are constructed automatically from consecutive lower pivot highs or higher pivot lows. Each channel includes a top boundary, bottom boundary, and a midline. Breakouts from the channel boundary generate a label at the breach bar.
- RSI Momentum labels: Positive and negative momentum shifts are marked when RSI crosses the configured threshold levels with an aligned EMA direction filter. The edge-triggered logic means only the crossover bar is labeled, avoiding repeated signals during sustained conditions.
- Candlestick pattern recognition: Marubozu and engulfing patterns are detected on confirmed bars with a trend context filter based on SMA 50 or the SMA 50 and SMA 200 combination. Labels are placed above or below the relevant candle.
- UT Bot trailing signal: An ATR-multiplied trailing stop is maintained on every bar. Arrow markers appear when the closing price crosses above or below the trailing level, providing a straightforward momentum entry cue.
- EMA 20, 50, and 200 overlay: All three exponential moving averages are plotted as standard indicator buffers. An EMA 50 and 200 crossover is marked with a separate arrow buffer. The EMA set can be hidden from the input group without affecting any other module.
How to Read the Indicator
Market structure labels appear at the midpoint of each structural break line. A BOS label in the bullish color indicates that price has closed above a prior swing high while the prevailing structure was already bullish, confirming trend continuation. A ChoCH label indicates the same crossover happened while the structure was bearish, signaling a potential reversal of the dominant order flow.
FVG boxes in blue represent upside gaps where price may return to seek equilibrium. Boxes in orange represent downside gaps. Once price touches the midpoint or the far edge of a gap, the box is removed if the fill-delete option is active.
Liquidity pool lines with dotted extensions mark price levels where multiple swing pivots have clustered. These are areas where stop orders are likely resting. When price sweeps through a pool, the zone box transitions to a reaction rectangle showing the sweep extent.
Sweep labels mark bars where the SFP condition was confirmed. A Sweep label below the bar indicates a bullish failed breakout at a prior pivot low. A label above the bar indicates a bearish failed breakout at a prior pivot high. Both require three consecutive closes beyond the pivot level before the label is placed.
Recommended Use
The indicator has been tested across major forex pairs, XAUUSD, and index instruments. Timeframes from M15 through H4 tend to produce the most readable structural context. Higher timeframes reduce noise in the market structure module while M15 and M30 provide more frequent liquidity zone interactions for active session traders.
The SMT divergence module works best when the comparison symbols share a genuine correlation with the primary chart, such as ES1 and YM1 for US equity index trading or correlated major pairs for forex. The default comparison symbols can be replaced with any instrument available on the broker's feed.
The indicator is suited to traders familiar with institutional order flow concepts who want a structured visual environment rather than a signal-based system. Each module can be enabled or disabled independently, allowing traders to display only the layers relevant to their specific methodology.
Input Parameters
Market Structure:
- Fractal Length — Pivot lookback length for structure detection — Default: 5
- Show Bullish Structures — Enable BOS and ChoCH labels for upside breaks — Default: true
- Show Bearish Structures — Enable BOS and ChoCH labels for downside breaks — Default: true
- Show Support Lines — Draw dashed support line after each bullish break — Default: false
- Show Resistance Lines — Draw dashed resistance line after each bearish break — Default: false
Fair Value Gap:
- Lookback Days — Number of calendar days to scan for new FVGs — Default: 3
- Max Boxes Per Direction — Maximum visible FVG boxes per bullish and bearish side — Default: 12
- Use CE for Fill Condition — Fill detected at gap midpoint rather than the far edge — Default: true
- Delete Filled Boxes — Remove FVG box automatically when fill condition is met — Default: true
UT Bot Alerts:
- Key Value (Sensitivity) — ATR multiplier controlling trail distance — Default: 2.0
- ATR Period — Calculation period for the ATR used in trail computation — Default: 1
Swing Failure Pattern:
- Cooldown Period — Minimum bars between consecutive sweep labels on the same side — Default: 10
- Sweep Line Width — Line width for the SFP sweep level visual — Default: 1
Liquidity Detection:
- Detection Length — Pivot lookback used to identify swing highs and lows for clustering — Default: 7
- Cluster Margin — ATR divisor controlling how tightly pivots must group to form a pool — Default: 6.9
- Visible Levels — Maximum number of buyside and sellside zones displayed simultaneously — Default: 3
- Show Liquidity Voids — Enable rendering of large price gaps as liquidity void zones — Default: false
Nadaraya-Watson Envelope:
- Window Size — Number of bars used in the kernel regression calculation (maximum 500) — Default: 500
- Bandwidth — Gaussian kernel bandwidth controlling smoothing degree — Default: 10.0
- Multiplier — ATR multiplier applied to the mean absolute error for band width — Default: 3.0
- Show Bands — Enable rendering of the upper and lower envelope lines — Default: false
SMT Divergences:
- Comparison Symbol 1 — First instrument to compare pivot structure against — Default: CME_MINI_DL:ES1!
- Comparison Symbol 2 — Second instrument to compare pivot structure against — Default: CBOT_MINI_DL:YM1!
- Pivot Lookback — Left and right bar length for SMT pivot detection — Default: 3
Support and Resistance MTF:
- Zone Count — Number of resistance and support levels drawn per side (1 to 3) — Default: 3
- Pivot Range — Bar range used to identify SR pivots — Default: 15
- Strength — Minimum touch count required to qualify a level — Default: 1
- Show Break Labels — Display a B marker at bars where price closes through a level — Default: true
- Show Retest Labels — Display an R marker at bars where price returns to a broken level — Default: true
- Show Canvas Panel — Enable the draggable break and retest summary overlay — Default: true
- Second Timeframe — Higher timeframe for additional SR level overlay (in minutes) — Default: 240
Trend Channels:
- Channel Pivot Length — Left and right lookback for channel pivot detection — Default: 8
- Show Last Channel — Display only the most recently formed channel — Default: true
- Wait for Break — Do not draw a new channel of the same direction until the prior one breaks — Default: true
RSI Momentum:
- RSI Length — Calculation period for the RSI — Default: 14
- Positive Threshold — RSI level crossover that triggers a positive momentum label — Default: 65
- Negative Threshold — RSI level crossunder that triggers a negative momentum label — Default: 32
General:
- Max Historical Objects — Object count limit before oldest structural objects are evicted (0 for unlimited) — Default: 800
- Instance Suffix — Optional text suffix for running multiple indicator instances on the same chart — Default: empty
Past performance of any analytical method does not guarantee future results. This indicator provides visual context for discretionary analysis and does not place or manage trades automatically. All trading involves risk.

































Спасибо за отличный индикатор! после обновления все отлично работает!