SwingVWAP Thermal Pro
- 지표
-
Khac Thanh Bui
 👨💻 MQL5 개발자 및 알고리즘 트레이딩 전문가
📍 베트남, 하노이 | 2018년부터 활동적인 트레이더
트레이딩 로직을 알고리즘의 정밀함으로 바꿉니다. 저는 실제 트레이딩의 요구 사항과 최고 수준의 소프트웨어 개발 사이의 격차를 해소하며, FX 및 골드 시장을 위한 전문가용 도구를 개발합니다.
제가 만드는 것들:
- ⚙️ 알고리즘 시스템: 프랍펌(Prop-Firm)의 엄격한 기준을 충족하는 로직(안전한 돌파, 노 마틴게일)부터 역동적인 고수익 엔진(스마트 그리드/DCA)까지 모두 제공합니다. - 버전: 1.51
- 업데이트됨: 21 6월 2026
SwingVWAP Thermal Pro
MetaTrader 5용 스윙 앵커 VWAP 지표로, 적응형 거래량 가중 가격 분석과 유동성 히트맵을 결합하여 주요 가격 수준과 시장 구조를 파악합니다.
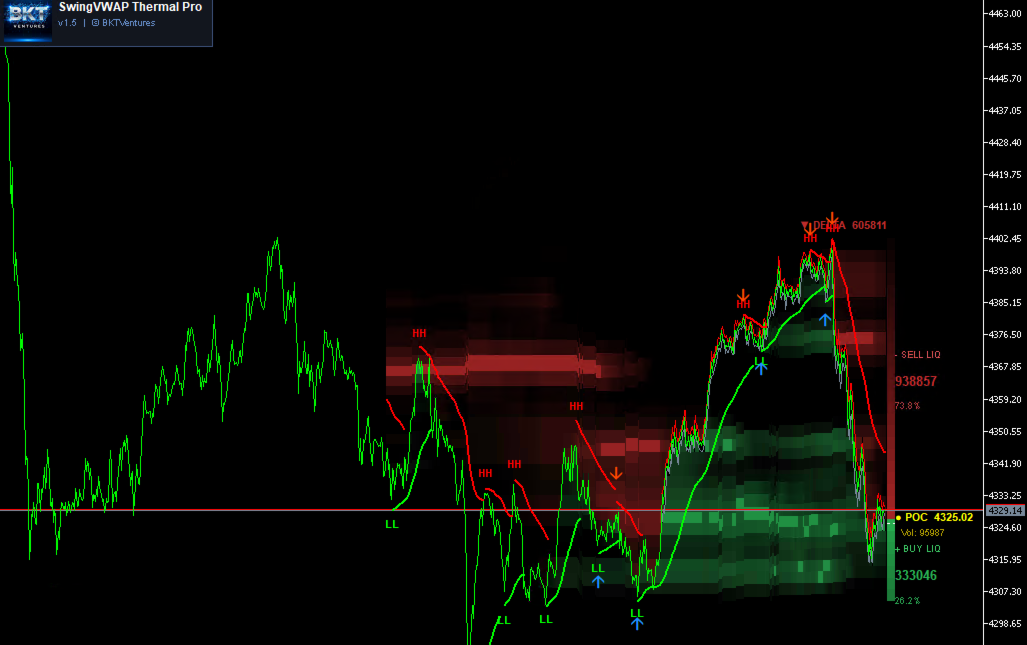
SwingVWAP Thermal Pro는 MetaTrader 5용 차트 지표로, 동일한 차트에서 함께 작동하는 두 개의 보완적인 분석 시스템으로 구성됩니다. 첫 번째 시스템은 설정 가능한 룩백 기간을 사용하여 스윙 고점과 저점을 감지하고, 각 피벗을 HH, HL, LH, LL로 분류하며, 식별된 각 스윙 포인트에 앵커된 거래량 가중 평균 가격 선을 그립니다. 두 번째 시스템은 최근 봉의 슬라이딩 윈도우 내 31개 가격 빈에 걸쳐 거래량 분포를 매핑하는 실시간 유동성 히트맵을 오버레이하여 시장이 가장 많이 거래된 위치를 보여줍니다.
개요
스윙 감지 엔진은 단조 덱 알고리즘을 사용하여 각 봉의 로컬 극값을 스캔합니다. 이 알고리즘은 단일 선형 패스로 전체 히스토리에 걸친 슬라이딩 최대값과 최소값을 계산합니다. 시장 구조가 방향을 바꾸면 지표는 새 피벗에 레이블을 붙이고 해당 스윙 포인트에 앵커된 새로운 VWAP 계산을 시작합니다. VWAP는 틱 거래량으로 곱한 HLC3 가격의 지수 가중 이동 평균을 사용하여 계산되며, 스무딩 기간은 조정 가능합니다. 적응 모드가 활성화되면 스무딩 기간은 현재 ATR과 50기간 이동 평균의 비율을 기반으로 높은 변동성 조건에서 자동으로 단축되고 조용한 기간에는 연장됩니다.
히트맵 구성 요소는 설정 가능한 룩백 윈도우의 고저 범위를 31개의 동일한 폭의 가격 빈으로 나눕니다. 각 가시 봉에 대해 지표는 윈도우 내에서 각 빈 내에 종가가 속하는 모든 봉의 틱 거래량을 누적한 다음 결과를 반투명 직사각형으로 렌더링합니다. 누적 거래량이 많은 빈은 더 불투명하게 표시되고, 설정된 민감도 임계값 아래의 빈은 완전히 숨겨집니다. 거래량이 가장 많은 빈인 포인트 오브 컨트롤은 별도로 강조 표시됩니다. 오른쪽 거래량 프로파일 사이드바는 매수 측과 매도 측 유동성의 분할을 절대값과 백분율로 보여주며 현재 불균형 수치도 함께 표시합니다.
새 피벗이 각각 LL(잠재적 수요 구간) 또는 HH(잠재적 공급 구간)로 분류될 때 매수 및 매도 신호가 생성됩니다. 화살표는 현재 ATR 값에 비례한 거리에 그려집니다. 선택적 팝업 알림은 새 신호가 감지될 때 현재 봉에서 발생합니다.
주요 기능
- 피벗 분류가 포함된 스윙 앵커 VWAP: 각 새 스윙 세그먼트는 감지된 피벗에 앵커된 새로운 거래량 가중 평균 가격 계산으로 시작됩니다. 피벗은 같은 방향의 이전 피벗과 비교하여 HH, HL, LH, LL로 레이블이 붙습니다.
- 적응형 스무딩 기간: 적응 모드가 활성화되면 EWMA 기간이 ATR 비율을 사용하여 동적으로 조정되어 변동성 조건에서 지연을 줄이고 낮은 변동성 기간 동안 출력을 부드럽게 합니다. 변동성 바이어스 파라미터가 이 조정의 강도를 제어합니다.
- 유동성 히트맵: 31개 가격 빈에 걸친 거래량 분포는 가시 윈도우의 각 봉에 대해 컬러 코딩된 오버레이로 렌더링됩니다. 세 가지 프로파일 깊이 설정(Shallow, Balanced, Deep)이 룩백 윈도우를 제어하고, 세 가지 민감도 설정이 표시를 위한 최소 거래량 임계값을 제어합니다.
- 오른쪽 거래량 프로파일 사이드바: 가장 최근 봉은 차트 오른쪽에 측면 프로파일을 투영하여 매수 측과 매도 측 유동성 거래량, 백분율 분할, 현재 주문 흐름 불균형을 보여줍니다.
- HH/HL/LH/LL 피벗 레이블: 확인된 각 스윙 피벗은 차트에 직접 컬러 레이블을 받습니다. 고점 측 피벗은 하나의 설정 가능한 색상을 사용하고 저점 측은 다른 색상을 사용하여 시장 구조를 즉시 읽을 수 있게 합니다.
- 알림 지원 신호 화살표: 선택적 매수 및 매도 화살표는 설정 가능한 수의 과거 봉에 표시할 수 있습니다. 현재 봉에서 새 신호가 감지될 때 알림을 받기 위해 팝업 알림을 활성화할 수 있습니다.
- 점진적 렌더링 엔진: 새 봉이 열릴 때 히트맵은 전체 다시 그리기 대신 점진적 업데이트를 수행합니다. 가시 윈도우를 벗어나는 가장 오래된 봉만 제거되고, 끝에서 두 번째 봉의 오른쪽 가장자리가 연장되며, 새 봉이 계산되어 그려집니다.
- 설정 가능한 그리기 히스토리 제한: 최대 봉 수 설정이 VWAP 세그먼트와 피벗 레이블이 그려지는 과거 범위를 제어하여 매우 긴 차트 히스토리에서의 성능 문제를 방지합니다.
작동 방식
첫 로드 시 지표는 사용 가능한 히스토리 전체에 대해 완전한 계산 패스를 수행합니다. 슬라이딩 최대값 및 최소값 배열은 스윙 감지와 히트맵 모듈 간에 공유되는 단조 덱을 사용한 단일 O(n) 패스로 채워집니다. 그런 다음 스윙 엔진이 히스토리를 봉별로 순회하며 현재 지배적인 방향을 추적하고 VWAP 값을 업데이트합니다. 방향이 바뀔 때마다 이전 세그먼트가 차트에 그려지고 새 세그먼트가 시작됩니다. 이후 각 틱에서는 새롭거나 수정된 봉만 처리됩니다. 새 봉이 열리면 스윙 구조가 전체 가격 히스토리에 의존하기 때문에 스윙 모듈은 처음부터 재구성하고, 히트맵 모듈은 불필요한 다시 그리기를 피하기 위해 점진적으로 업데이트됩니다.
권장 사용법
이 지표는 MetaTrader 5가 지원하는 모든 심볼과 타임프레임에서 작동합니다. 스윙 기간 값 20에서 100은 대부분의 타임프레임에 적합합니다. 작은 값은 소규모 스윙을 감지하여 더 빈번한 피벗을 생성하고, 큰 값은 주요 구조적 전환점에 집중합니다. 히트맵은 M15 이상의 타임프레임에서 가장 잘 읽히며, 여기서는 의미 있는 거래량 분포를 누적하기에 충분한 봉 히스토리가 있습니다. 오른쪽 프로파일은 차트 이동 설정이 필요하며, 지표는 로드 시 자동으로 이를 활성화하고 제거 시 복원합니다.
파라미터
스윙 포인트:
- Swing Period — 로컬 고점과 저점을 식별하는 데 사용되는 봉 수 — Default: 50
- Adaptive Price Tracking — EWMA VWAP 계산을 위한 기본 스무딩 기간 — Default: 20
- Adapt by ATR Ratio — 활성화하면 스무딩 기간이 현재 변동성과 평균 대비를 기반으로 동적으로 조정됩니다 — Default: false
- Volatility Bias — 변동성 변화가 스무딩 기간을 압축하거나 확장하는 강도를 제어합니다 (값이 높을수록 조정이 강해집니다) — Default: 10.0
스타일:
- Pivot Label Color — High — HH 및 HL 피벗 레이블에 적용되는 색상 — Default: Lime
- Pivot Label Color — Low — LH 및 LL 피벗 레이블에 적용되는 색상 — Default: Red
- VWAP Color — Uptrend — 상승 스윙 단계의 VWAP 세그먼트 선 색상 — Default: Lime
- VWAP Color — Downtrend — 하락 스윙 단계의 VWAP 세그먼트 선 색상 — Default: Red
- VWAP Line Width — 선 두께 1에서 5 — Default: 2
신호:
- Show Buy/Sell Signals — 신호 화살표 표시 활성화 또는 비활성화 — Default: true
- Buy Arrow Color — LL 피벗에 배치되는 상향 화살표 색상 — Default: DodgerBlue
- Sell Arrow Color — HH 피벗에 배치되는 하향 화살표 색상 — Default: OrangeRed
- Arrow Size — 화살표 객체 크기 1에서 5 — Default: 3
- Signal History — 신호가 그려지는 과거 봉 수 — Default: 150
- Enable Alerts — 현재 봉에 새 신호가 나타날 때 팝업 알림 트리거 — Default: false
성능:
- Max History Bars to Draw — VWAP 세그먼트와 피벗 레이블이 렌더링되는 과거 봉 수를 제한합니다. 사용 가능한 모든 히스토리를 그리려면 0으로 설정합니다 — Default: 3000
히트맵:
- Profile Depth — 거래량 누적을 위한 룩백 윈도우 선택: Shallow Profile (100봉), Balanced Profile (300봉), Deep Profile (600봉) — Default: Balanced Profile
- Sensitivity — 빈 표시를 위한 최소 거래량 임계값 제어: High Contrast는 낮은 거래량 빈을 숨기고, Smooth는 모든 빈을 표시하며, Balanced는 중간 설정입니다 — Default: Balanced
- Upper Liquidity Color — 현재 종가 위의 가격 빈에 적용되는 색상 — Default: 진한 빨강
- Lower Liquidity Color — 현재 종가 아래의 가격 빈에 적용되는 색상 — Default: 진한 초록
- Hide Active Candle Color — 활성 봉의 현재 시가, 종가, 중간값, HLC3와 겹치는 가격 수준의 히트맵 색상을 억제합니다 — Default: true
- Heatmap Visible Bars — 히트맵 오버레이가 렌더링되는 봉 수 — Default: 300
백테스팅이나 과거 차트 데이터의 시각적 검사에서 과거 성과는 미래 결과를 보장하지 않습니다. 이 지표를 자체 리스크 관리 규칙을 포함한 완전한 트레이딩 접근 방식의 한 구성 요소로 사용하십시오.


Good indicator but it shifts the whole chart too much to the left. Edit. The previous update fixed the issue by adding adjustable shift. Perfect