SwingVWAP Thermal Pro
- Indicatori
-
Khac Thanh Bui
 👨💻 Sviluppatore MQL5 e Specialista di Trading Algoritmico
📍 Hanoi, Vietnam | Trader attivo dal 2018 - Versione: 1.51
- Aggiornato: 21 giugno 2026
- Attivazioni: 5
SwingVWAP Thermal Pro
Un indicatore VWAP ancorato agli swing per MetaTrader 5 che combina l'analisi adattiva del prezzo medio ponderato per il volume con una mappa termica della liquidità per identificare livelli di prezzo chiave e struttura del mercato.
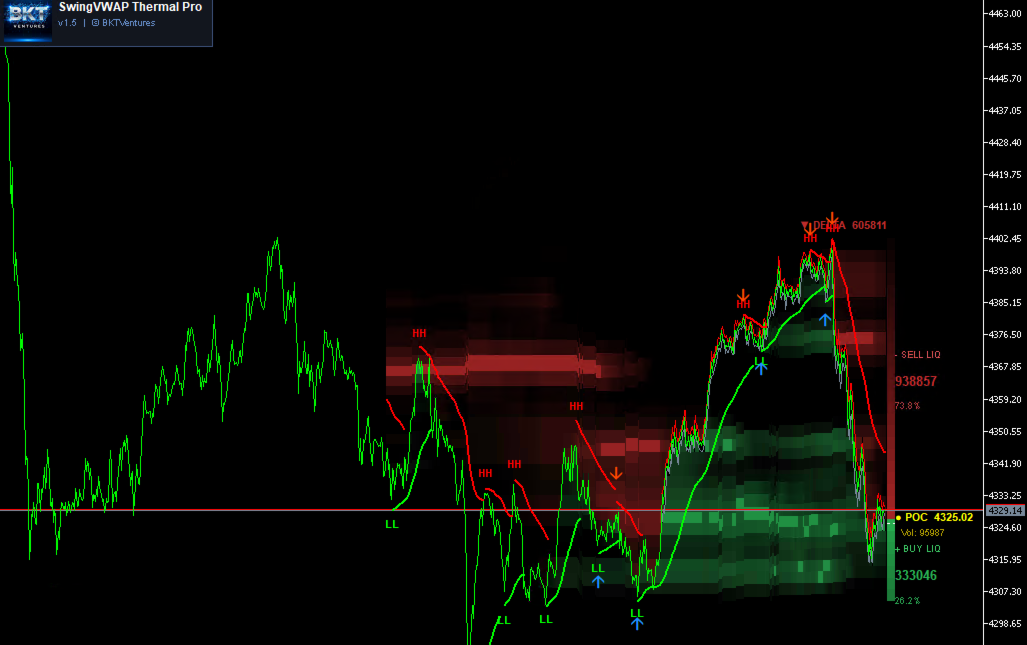
SwingVWAP Thermal Pro è un indicatore grafico per MetaTrader 5 costruito su due sistemi analitici complementari che lavorano insieme sullo stesso grafico. Il primo sistema rileva i massimi e i minimi di swing utilizzando un periodo di lookback configurabile, classifica ogni pivot come HH, HL, LH o LL e traccia una linea del prezzo medio ponderato per il volume ancorata a ciascun punto di swing identificato. Il secondo sistema sovrappone una mappa termica della liquidità in tempo reale che mappa la distribuzione del volume su 31 bin di prezzo all'interno di una finestra scorrevole di candele recenti, rivelando dove il mercato ha scambiato di più.
Panoramica
Il motore di rilevamento degli swing scansiona ogni candela alla ricerca di estremi locali utilizzando un algoritmo deque monotono, che calcola i valori massimi e minimi scorrevoli sull'intera storia in un singolo passaggio lineare. Quando la struttura del mercato cambia direzione, l'indicatore etichetta il nuovo pivot e avvia un nuovo calcolo del VWAP ancorato a quel punto di swing. Il VWAP viene calcolato utilizzando una media mobile esponenzialmente ponderata del prezzo HLC3 moltiplicato per il volume in tick, con un periodo di smoothing regolabile. Quando la modalità adattiva è abilitata, il periodo di smoothing si accorcia automaticamente in condizioni di alta volatilità e si allunga durante i periodi tranquilli, basandosi sul rapporto tra l'ATR corrente e la sua media mobile a 50 periodi.
Il componente della mappa termica divide il range massimo-minimo di una finestra di lookback configurabile in 31 bin di uguale ampiezza. Per ogni candela visibile, l'indicatore accumula il volume in tick di tutte le candele all'interno della finestra il cui prezzo di chiusura cade all'interno di ciascun bin, quindi visualizza il risultato come un rettangolo semitrasparente. I bin con volume accumulato maggiore appaiono più opachi; i bin al di sotto della soglia di sensibilità configurata vengono nascosti completamente. Il Point of Control, il bin con il volume maggiore, viene evidenziato separatamente. Una barra laterale del profilo di volume sul lato destro mostra la suddivisione tra liquidità lato acquirente e lato venditore in valori assoluti e percentuali, insieme al valore di squilibrio corrente.
I segnali di acquisto e vendita vengono generati quando un nuovo pivot viene classificato rispettivamente come LL (potenziale zona di domanda) o HH (potenziale zona di offerta). Le frecce vengono tracciate a una distanza proporzionale al valore ATR corrente. Avvisi pop-up opzionali si attivano sulla candela corrente quando viene rilevato un nuovo segnale.
Caratteristiche principali
- VWAP ancorato agli swing con classificazione dei pivot: Ogni nuovo segmento di swing avvia un nuovo calcolo del prezzo medio ponderato per il volume ancorato al pivot rilevato. I pivot vengono etichettati HH, HL, LH o LL in base al confronto con il pivot precedente della stessa direzione.
- Periodo di smoothing adattivo: Quando la modalità adattiva è attiva, il periodo EWMA si adatta dinamicamente utilizzando il rapporto ATR, riducendo il ritardo in condizioni volatili e levigando l'output durante i periodi di bassa volatilità. Il parametro di bias di volatilità controlla l'intensità di questo adattamento.
- Mappa termica della liquidità: La distribuzione del volume su 31 bin di prezzo viene visualizzata come una sovrapposizione codificata per colore per ogni candela nella finestra visibile. Tre impostazioni di profondità del profilo (Shallow, Balanced, Deep) controllano la finestra di lookback, e tre impostazioni di sensibilità controllano la soglia minima di volume per la visualizzazione.
- Barra laterale del profilo di volume sul lato destro: La candela più recente proietta un profilo laterale a destra del grafico che mostra i volumi di liquidità lato acquirente e venditore, la loro suddivisione percentuale e lo squilibrio del flusso degli ordini corrente.
- Etichette pivot HH/HL/LH/LL: Ogni pivot di swing confermato riceve un'etichetta colorata direttamente sul grafico. I pivot lato alto utilizzano un colore configurabile e quelli lato basso ne utilizzano un altro, rendendo la struttura del mercato immediatamente leggibile.
- Frecce segnale con supporto avvisi: Le frecce opzionali di acquisto e vendita possono essere visualizzate per un numero configurabile di candele storiche. Gli avvisi pop-up possono essere abilitati per notificare quando viene rilevato un nuovo segnale sulla candela corrente.
- Motore di rendering incrementale: All'apertura di una nuova candela, la mappa termica esegue un aggiornamento incrementale anziché un ridisegno completo. Solo la candela più vecchia che lascia la finestra visibile viene rimossa, il bordo destro della penultima candela viene esteso e la nuova candela viene calcolata e disegnata.
- Limite configurabile della cronologia di disegno: Un'impostazione del numero massimo di candele controlla fino a quanto indietro nel passato vengono disegnati i segmenti VWAP e le etichette pivot, evitando problemi di prestazioni su storie di grafico molto lunghe.
Come funziona
Al primo caricamento, l'indicatore esegue un passaggio di calcolo completo sulla storia disponibile. Gli array dei massimi e minimi scorrevoli vengono popolati in un singolo passaggio O(n) utilizzando una deque monotona condivisa tra i moduli di rilevamento degli swing e della mappa termica. Il motore degli swing percorre quindi la storia candela per candela, tracciando la direzione dominante corrente e aggiornando i valori VWAP. Ogni volta che la direzione cambia, il segmento precedente viene disegnato sul grafico e ne inizia uno nuovo. In ogni tick successivo, vengono elaborate solo le candele nuove o modificate. Quando si apre una nuova candela, il modulo degli swing ricostruisce da zero perché la logica dello swing dipende dall'intera storia dei prezzi, mentre il modulo della mappa termica si aggiorna incrementalmente per evitare ridisegni non necessari.
Utilizzo consigliato
L'indicatore funziona su qualsiasi simbolo e timeframe supportato da MetaTrader 5. I valori del periodo di swing tra 20 e 100 sono adatti alla maggior parte dei timeframe; valori più piccoli rilevano swing minori e producono pivot più frequenti, mentre valori più grandi si concentrano sui principali punti di svolta strutturali. La mappa termica è più leggibile su timeframe da M15 in su, dove esiste sufficiente storia di candele per accumulare distribuzioni di volume significative. Il profilo sul lato destro richiede l'impostazione di spostamento del grafico, che l'indicatore abilita automaticamente al caricamento e ripristina alla rimozione.
Parametri
Punti di swing:
- Swing Period — Numero di candele utilizzate per identificare massimi e minimi locali — Default: 50
- Adaptive Price Tracking — Periodo di smoothing base per il calcolo del VWAP EWMA — Default: 20
- Adapt by ATR Ratio — Quando abilitato, il periodo di smoothing si adatta dinamicamente in base alla volatilità corrente rispetto alla sua media — Default: false
- Volatility Bias — Controlla con quale intensità le variazioni di volatilità comprimono o espandono il periodo di smoothing (valori più alti producono un adattamento più forte) — Default: 10.0
Stile:
- Pivot Label Color — High — Colore applicato alle etichette pivot HH e HL — Default: Lime
- Pivot Label Color — Low — Colore applicato alle etichette pivot LH e LL — Default: Red
- VWAP Color — Uptrend — Colore della linea per i segmenti VWAP nelle fasi di swing ascendente — Default: Lime
- VWAP Color — Downtrend — Colore della linea per i segmenti VWAP nelle fasi di swing discendente — Default: Red
- VWAP Line Width — Spessore della linea da 1 a 5 — Default: 2
Segnali:
- Show Buy/Sell Signals — Abilitare o disabilitare la visualizzazione delle frecce segnale — Default: true
- Buy Arrow Color — Colore della freccia verso l'alto posizionata sui pivot LL — Default: DodgerBlue
- Sell Arrow Color — Colore della freccia verso il basso posizionata sui pivot HH — Default: OrangeRed
- Arrow Size — Dimensione dell'oggetto freccia da 1 a 5 — Default: 3
- Signal History — Numero di candele storiche su cui vengono disegnati i segnali — Default: 150
- Enable Alerts — Attivare un avviso pop-up quando appare un nuovo segnale sulla candela corrente — Default: false
Prestazioni:
- Max History Bars to Draw — Limita quante candele nel passato vengono visualizzati i segmenti VWAP e le etichette pivot; impostare a 0 per disegnare tutta la storia disponibile — Default: 3000
Mappa termica:
- Profile Depth — Seleziona la finestra di lookback per l'accumulo del volume: Shallow Profile (100 candele), Balanced Profile (300 candele) o Deep Profile (600 candele) — Default: Balanced Profile
- Sensitivity — Controlla la soglia minima di volume per la visualizzazione dei bin: High Contrast nasconde i bin a basso volume, Smooth mostra tutti i bin, Balanced è l'impostazione intermedia — Default: Balanced
- Upper Liquidity Color — Colore applicato ai bin di prezzo sopra la chiusura corrente — Default: rosso scuro
- Lower Liquidity Color — Colore applicato ai bin di prezzo sotto la chiusura corrente — Default: verde scuro
- Hide Active Candle Color — Sopprime la colorazione della mappa termica per i livelli di prezzo che si sovrappongono all'apertura, chiusura, punto medio e HLC3 correnti della candela attiva — Default: true
- Heatmap Visible Bars — Numero di candele per cui viene visualizzata la sovrapposizione della mappa termica — Default: 300
Le performance passate nel backtesting o nell'ispezione visiva dei dati storici del grafico non garantiscono risultati futuri. Utilizzare questo indicatore come una componente di un approccio di trading completo che includa le proprie regole di gestione del rischio.


L'utente non ha lasciato alcun commento sulla valutazione.