
BKT Monday SMC
- Indicators
-
Khac Thanh Bui
 Turning trading logic into algorithmic precision. I develop professional-grade tools for FX and Gold, bridging the gap between practical trading needs and high-end software development.
WHAT I BUILD: - Version: 1.13
- Updated: 22 April 2026
BKT Monday
A multi-layer technical indicator for MetaTrader 5 that combines Supply and Demand zones, Support and Resistance levels, an adaptive MA trend signal, and an integrated risk management panel in a single chart overlay.
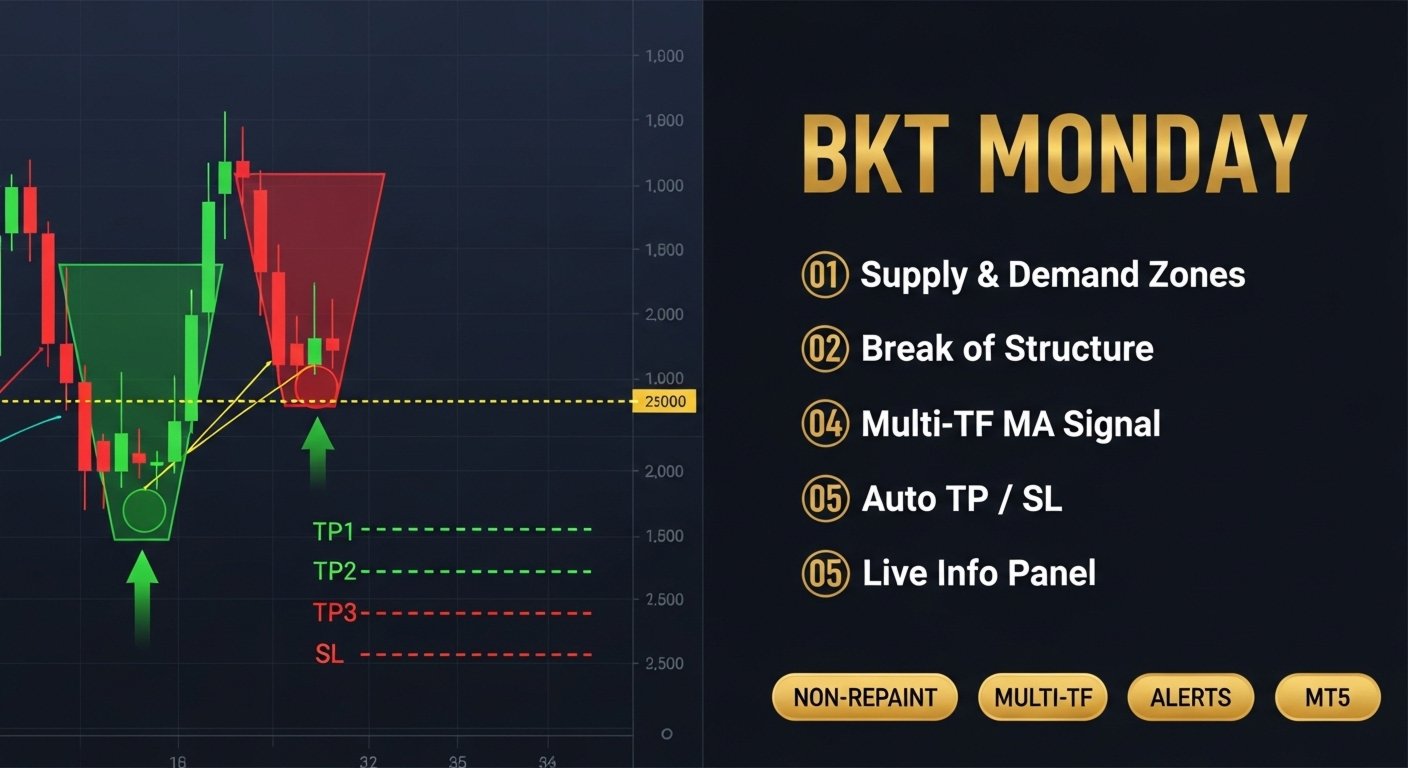
BKT Monday is a chart indicator for MetaTrader 5 designed to assist traders in identifying high-probability trade setups using three complementary analytical layers. The indicator automatically plots Supply and Demand zones from swing pivots, draws Support and Resistance lines from historical price clusters, and generates Long and Short signal arrows from a configurable moving average crossover on a user-selected higher timeframe. Entry, Stop Loss, and three Take Profit levels are calculated and displayed directly on the chart for each signal.
Overview
The indicator processes price data on two timeframes simultaneously. The primary chart provides pivot-based zone detection, while a configurable higher timeframe feeds the trend signal calculation. Supply zones are drawn above current price at confirmed swing highs; Demand zones are drawn below at confirmed swing lows. Each zone is sized using an ATR multiplier to reflect current market volatility. When price closes beyond a zone boundary, the zone is removed and a Break of Structure line is drawn at the zone midpoint to mark the structural shift.
The trend signal uses one of three selectable moving average types: ALMA, TEMA, or Hull MA. A crossover between the MA applied to the higher timeframe close and open series triggers a Long or Short arrow on the current chart bar. The signal includes a configurable delay parameter to reduce sensitivity to repainting on the last bar. Once a signal fires, the indicator calculates Entry, Stop Loss, TP1, TP2, and TP3 levels as percentage distances from the entry price and plots them as horizontal lines. The lines remain visible until each target or the stop loss is reached.
How to Read the Indicator
An upward green arrow below a bar indicates a Long signal. A downward red arrow above a bar indicates a Short signal. A blue horizontal line marks the Entry level; the red line marks the Stop Loss. Three green lines in ascending order mark TP1, TP2, and TP3 respectively for Long signals, and in descending order for Short signals. The panel in the upper-left corner shows the current signal state, active Entry and target levels, current ATR, and the nearest Supply and Demand zone midpoints. When no trade is active, the panel displays "SCANNING..." and the target lines are hidden.
Bars are optionally recolored in purple and blue to reflect higher timeframe trend direction. Supply zones are drawn in red-tinted rectangles; Demand zones in green-tinted rectangles. A dashed Break of Structure line appears at the midpoint of any zone that has been invalidated by a price close beyond its boundary.
Recommended Use
The indicator is compatible with all symbols and timeframes available in MetaTrader 5. For zone detection to function correctly, the chart must have enough historical bars to complete at least two full pivot lookback periods on both sides. The MA signal timeframe is derived automatically from the current chart period multiplied by the resolution multiplier input; traders working on M15 with a multiplier of 8 will receive signals based on H2 data. The indicator is suited to swing traders and intraday traders who use a top-down multi-timeframe approach. It does not place orders automatically and does not connect to any external service.
Parameters
MA Trend Signal
- Resolution multiplier — Multiplier applied to the current timeframe to derive the signal timeframe — Default: 8
- Use alternate timeframe — Enable higher timeframe MA calculation — Default: true
- MA type — Moving average type: ALMA, TEMA, or Hull MA — Default: ALMA
- MA period — Calculation period for the moving average — Default: 2
- Sigma — Sigma value used by ALMA — Default: 5
- ALMA offset — Offset parameter for ALMA (range 0 to 1) — Default: 0.85
- Signal delay — Number of bars to delay the signal calculation — Default: 0
Supply and Demand
- Pivot lookback — Number of bars used to identify swing highs and lows — Default: 10
- Max zones on chart — Maximum number of Supply or Demand zones kept visible — Default: 20
- Zone height multiplier — Zone height expressed as a multiplier of ATR — Default: 2.5
- Show zone labels — Display HH, LH, HL, LL labels at pivot points — Default: false
- Zone deduplication gap — Minimum ATR distance between two zones of the same side — Default: 2.0
Supply and Demand Visual
- Supply fill color — Fill color for Supply zones — Default: dark red
- Supply border color — Border color for Supply zones — Default: medium red
- Demand fill color — Fill color for Demand zones — Default: dark green
- Demand border color — Border color for Demand zones — Default: medium green
- Show Break of Structure lines — Draw a dashed line when a zone is invalidated — Default: true
- Show zone midline — Draw a dashed midpoint line inside each zone — Default: false
Support and Resistance
- Enable S/R lines — Enable automatic Support and Resistance detection — Default: false
- Minimum pivot touches — Minimum number of touches required to form a level — Default: 2
- Line style — Style of S/R lines: Dotted, Dashed, or Solid — Default: Dotted
- Line width — Width of S/R lines in pixels — Default: 2
Risk Management
- TP1 distance — Take Profit 1 distance from entry as a percentage — Default: 1.0
- TP1 close quantity — Percentage of position to close at TP1 — Default: 50
- TP2 distance — Take Profit 2 distance from entry as a percentage — Default: 1.5
- TP2 close quantity — Percentage of position to close at TP2 — Default: 30
- TP3 distance — Take Profit 3 distance from entry as a percentage — Default: 2.0
- TP3 close quantity — Percentage of position to close at TP3 — Default: 20
- Stop Loss distance — Stop Loss distance from entry as a percentage — Default: 0.5
Display
- Show signal arrows — Display Long and Short arrows on the chart — Default: true
- Color bars by trend — Recolor candlesticks using higher timeframe trend direction — Default: true
- Historical signal limit — Maximum number of past bars on which signals are drawn (0 = all) — Default: 500
Panel
- Show panel — Display the information panel on the chart — Default: true
- Panel X position — Horizontal distance from the left edge of the chart in pixels — Default: 20
- Panel Y position — Vertical distance from the top edge of the chart in pixels — Default: 30
This indicator is for analytical purposes only and does not execute trades automatically. All trade decisions, position sizing, and risk management remain the responsibility of the trader. Past signal patterns do not guarantee future performance.




































Brilliant Indicator , so far the best performing Indicator compared to others that I'm testing at Market Open madness. Please can you add Alerts to phone/email when Buy or Sell signals are generated. Thank you in advance.