Buyside and Sellside Liquidity MT5 Multi Timeframe
- Indicators
-
Duc Hoan Nguyen
 ->| I am a dedicated developer and programmer specializing in MQL4, MQL5, and Pine Script for TradingView, with a strong track record of success in building high-performing, tailored solutions for MT4, MT5, and TradingView platforms. Over the years, I have worked extensively within the financial and
 - Version: 1.10
- Updated: 30 September 2025
- Activations: 10
New tools will be $30 for the first week or the first 3 purchases!
Trading Tools Channel on MQL5: Join my MQL5 channel to update the latest news from me
See more MT5 version at: Buyside and Sellside Liquidity MT5 Multi Timeframe
See more MT4 version at: Buyside and Sellside Liquidity MT4 Multi Timeframe
See more products at: All Products
Key Highlights
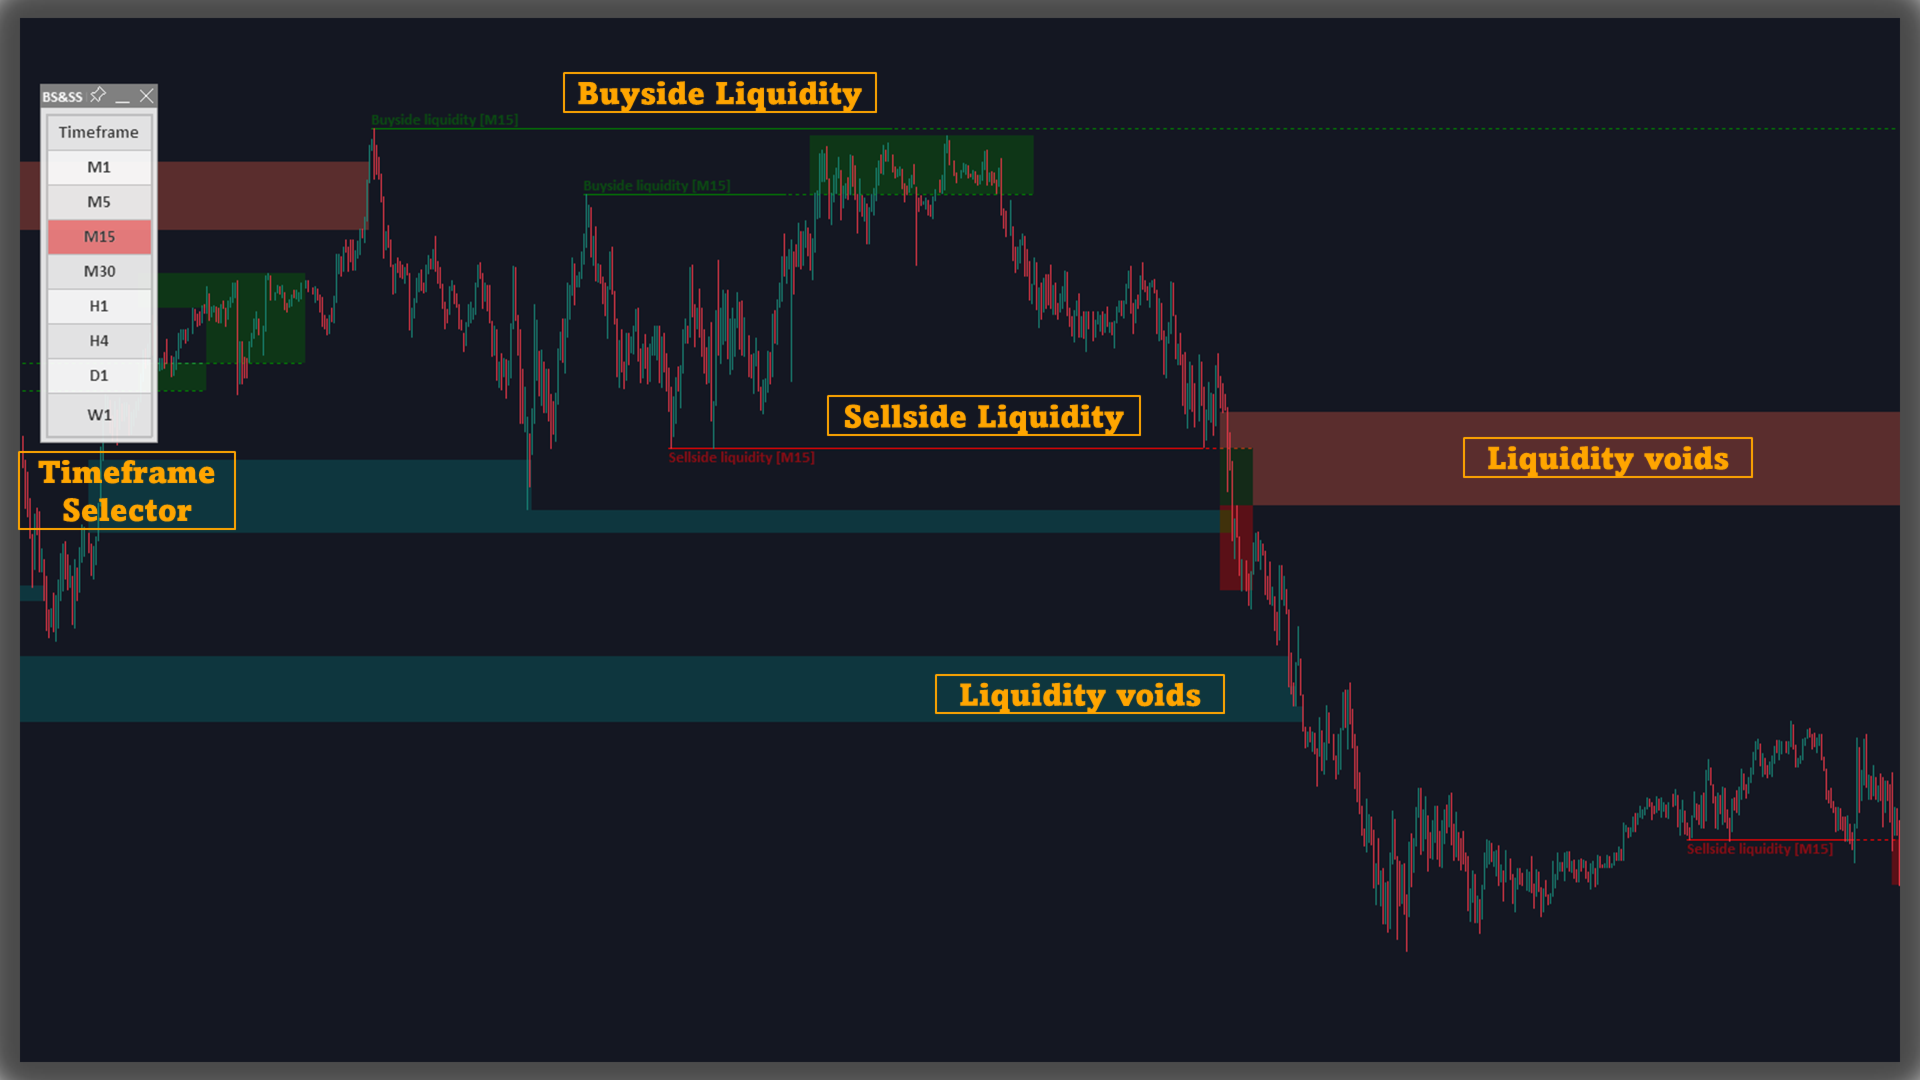
• Clarifies two-sided liquidity structure (buyside/sellside) with color-coded levels and zones
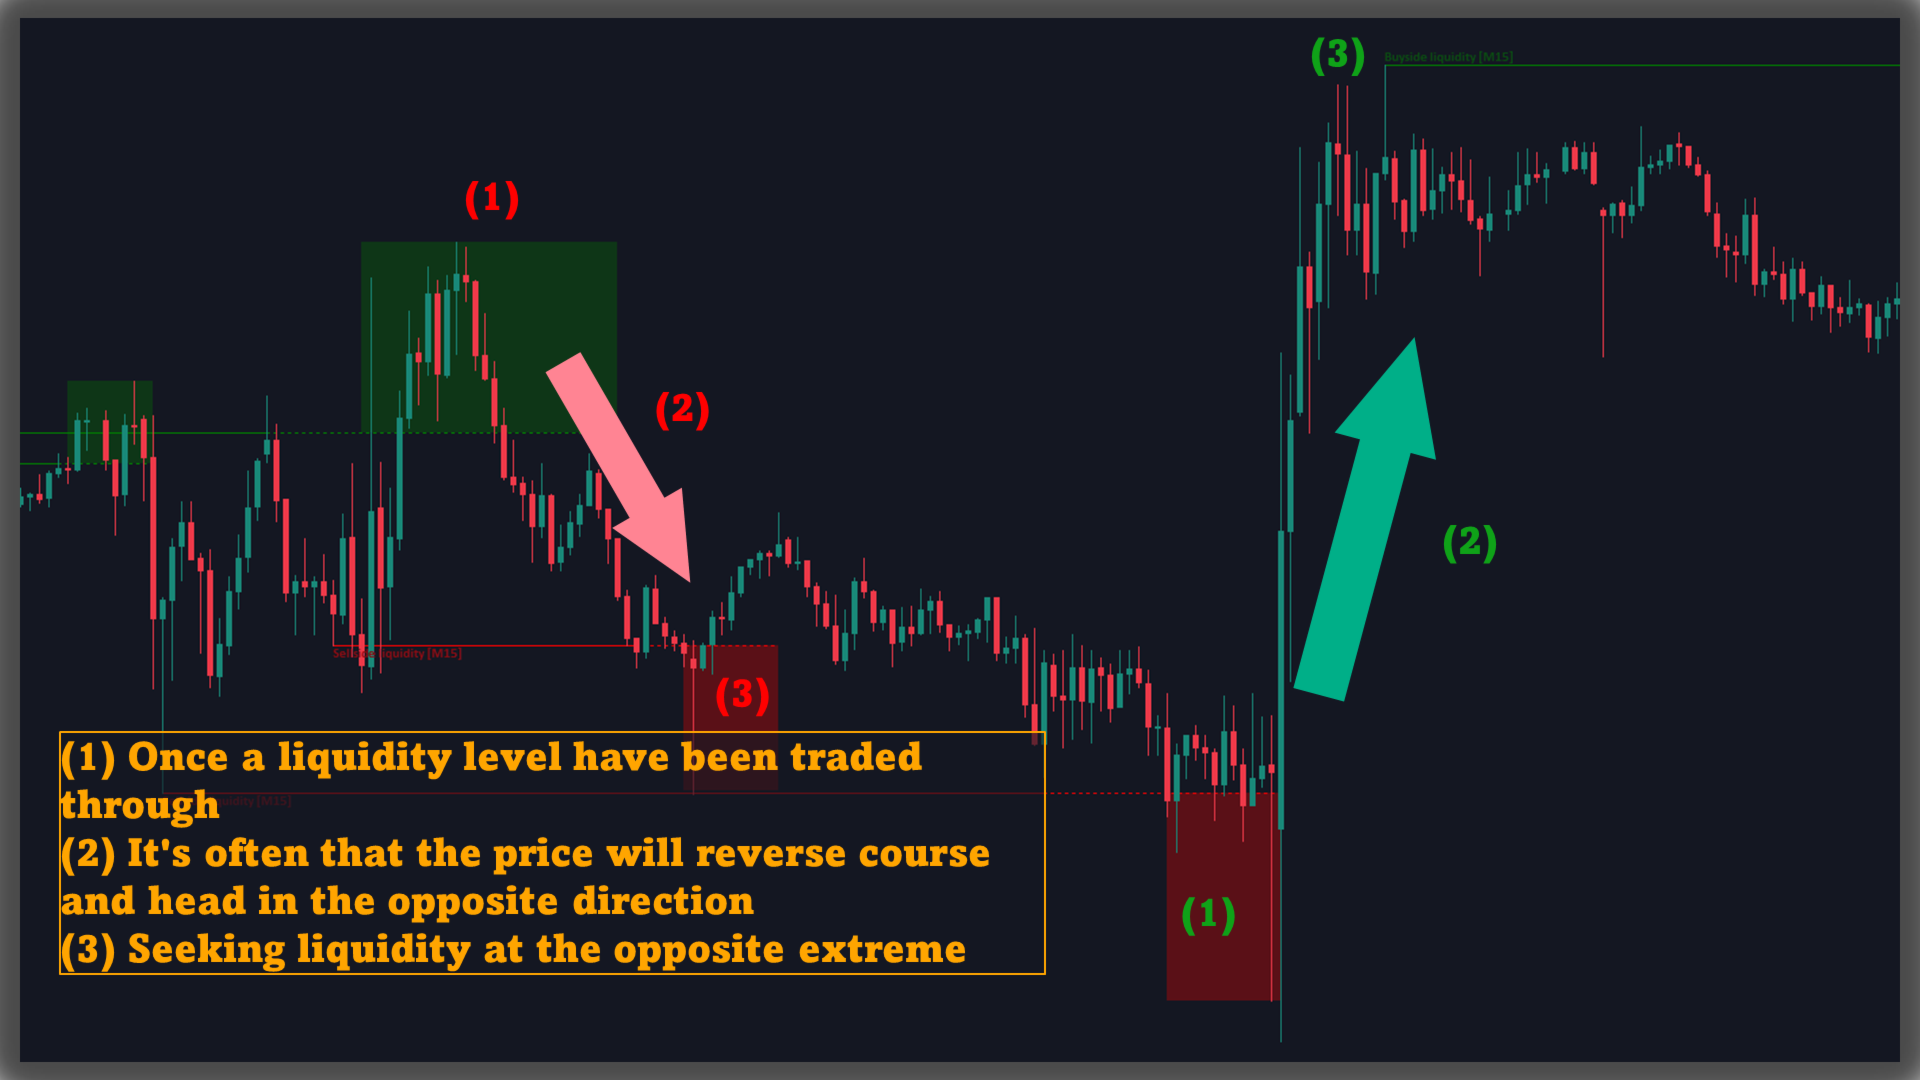
• Forms a zone immediately after a level is traded through and extends it while price remains within a controlled band
• Displays Liquidity Voids as thin stacked slices to help monitor potential refills over time
• Offers recent-window or full-history display modes and a cap on visible objects to keep charts tidy
• Event-based alerts for new/updated levels and for level breaches (separate for buyside/sellside)
What It Shows
• Liquidity levels: derived from clusters of repeated highs/lows located within a narrow volatility-based range
• Liquidity zones: drawn right after a level is breached to observe subsequent behavior around that area
• Liquidity voids: sequences of mostly same-direction candles with large bodies and short wicks, presented as multiple thin boxes for visual tracking
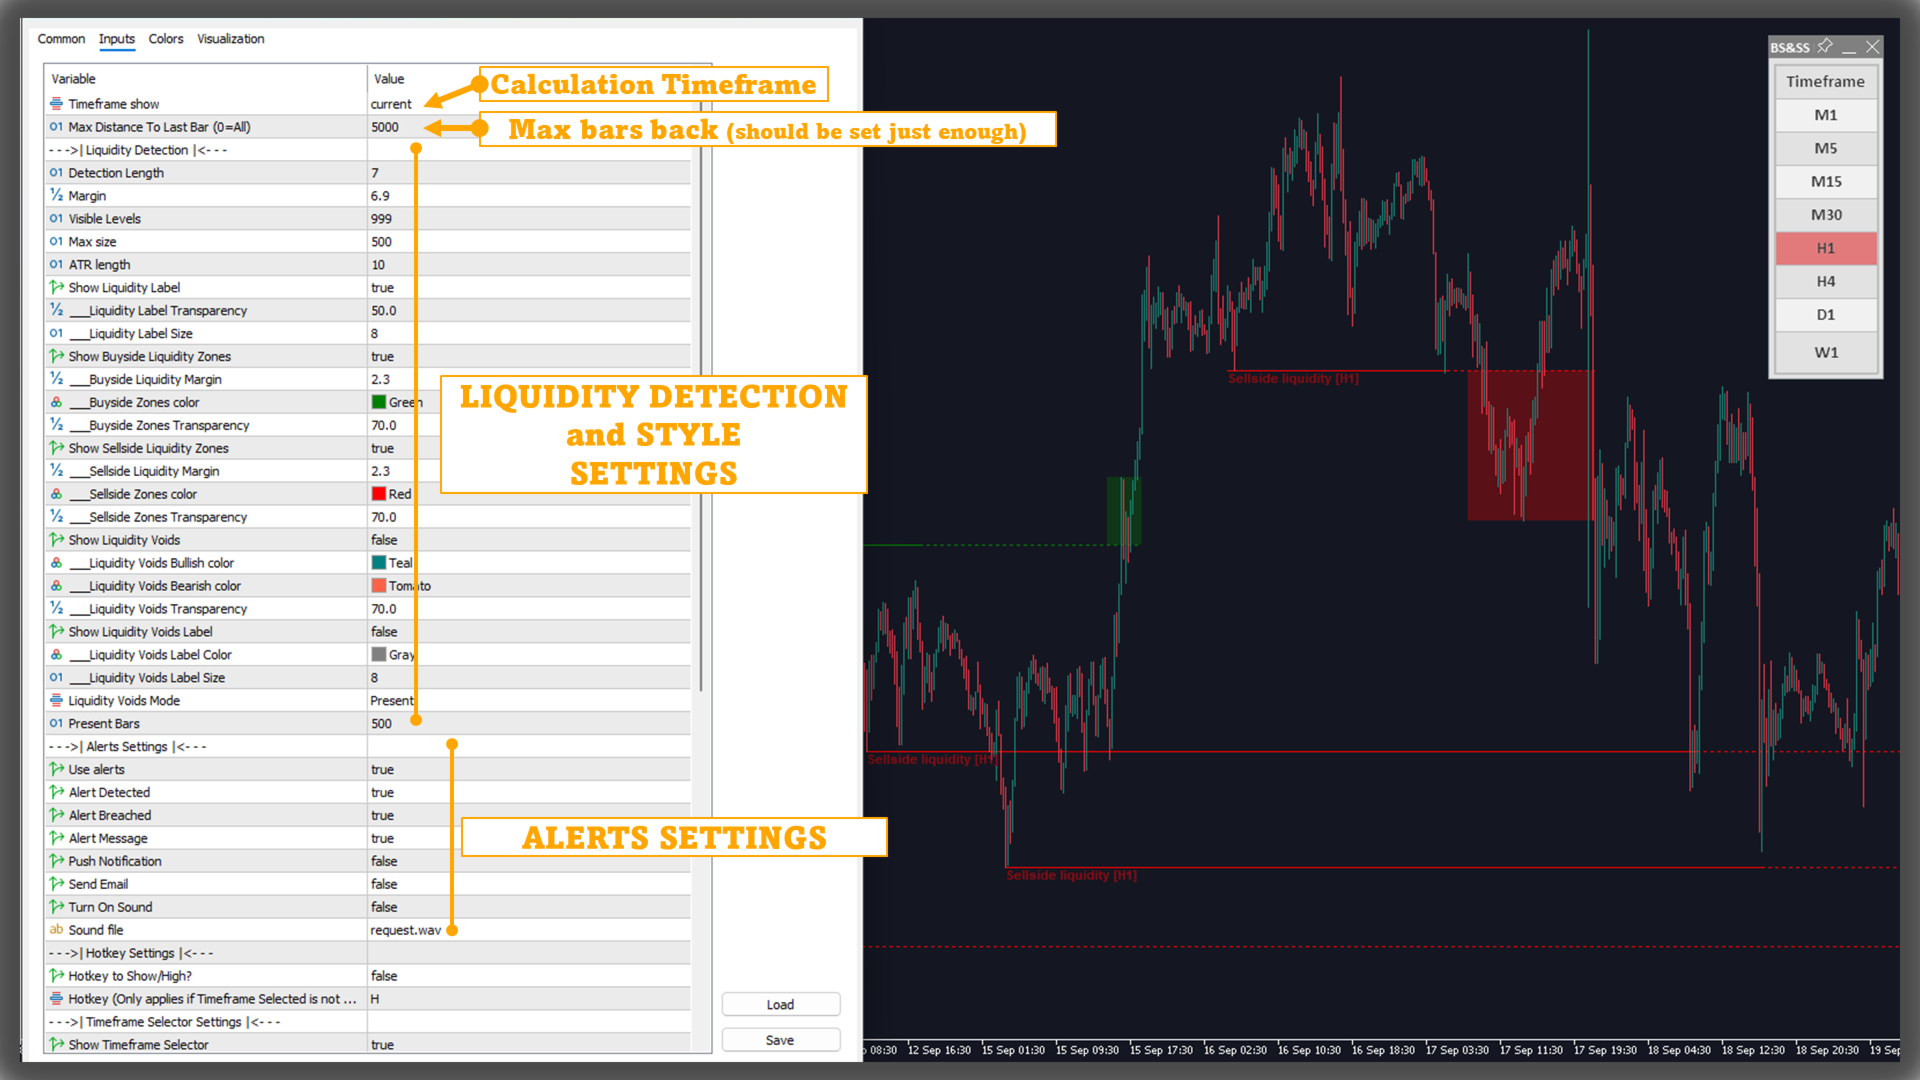
Main Settings
Liquidity Levels
• Lookback length to identify candidate levels
• Sensitivity band (volatility-aware) to group nearby highs/lows
Liquidity Zones
• Enable/disable buyside and sellside zones
• Zone width defined by market volatility (ATR-based)
• Independent color options for each side
Liquidity Voids
• Enable/disable in both directions
• Optional “Liquidity Void” label
Display Options
How It Works (short)• Mode: recent bars only or full available history
• Max number of levels/zones kept on screen
-
Level detection: finds clusters of repeated swing points within a volatility-scaled tolerance; plots a horizontal level with a side-specific label
-
After a breach: once price trades through a level, a liquidity zone is created around it using an ATR-based band and extends while subsequent bars remain within that band
-
Display control: when the number of objects exceeds the user’s limit, older levels/zones are removed to preserve clarity
Alerts
• Notify when a liquidity level is detected (buyside/sellside)
• Notify when a liquidity level is breached (buyside/sellside)
Reading The Chart
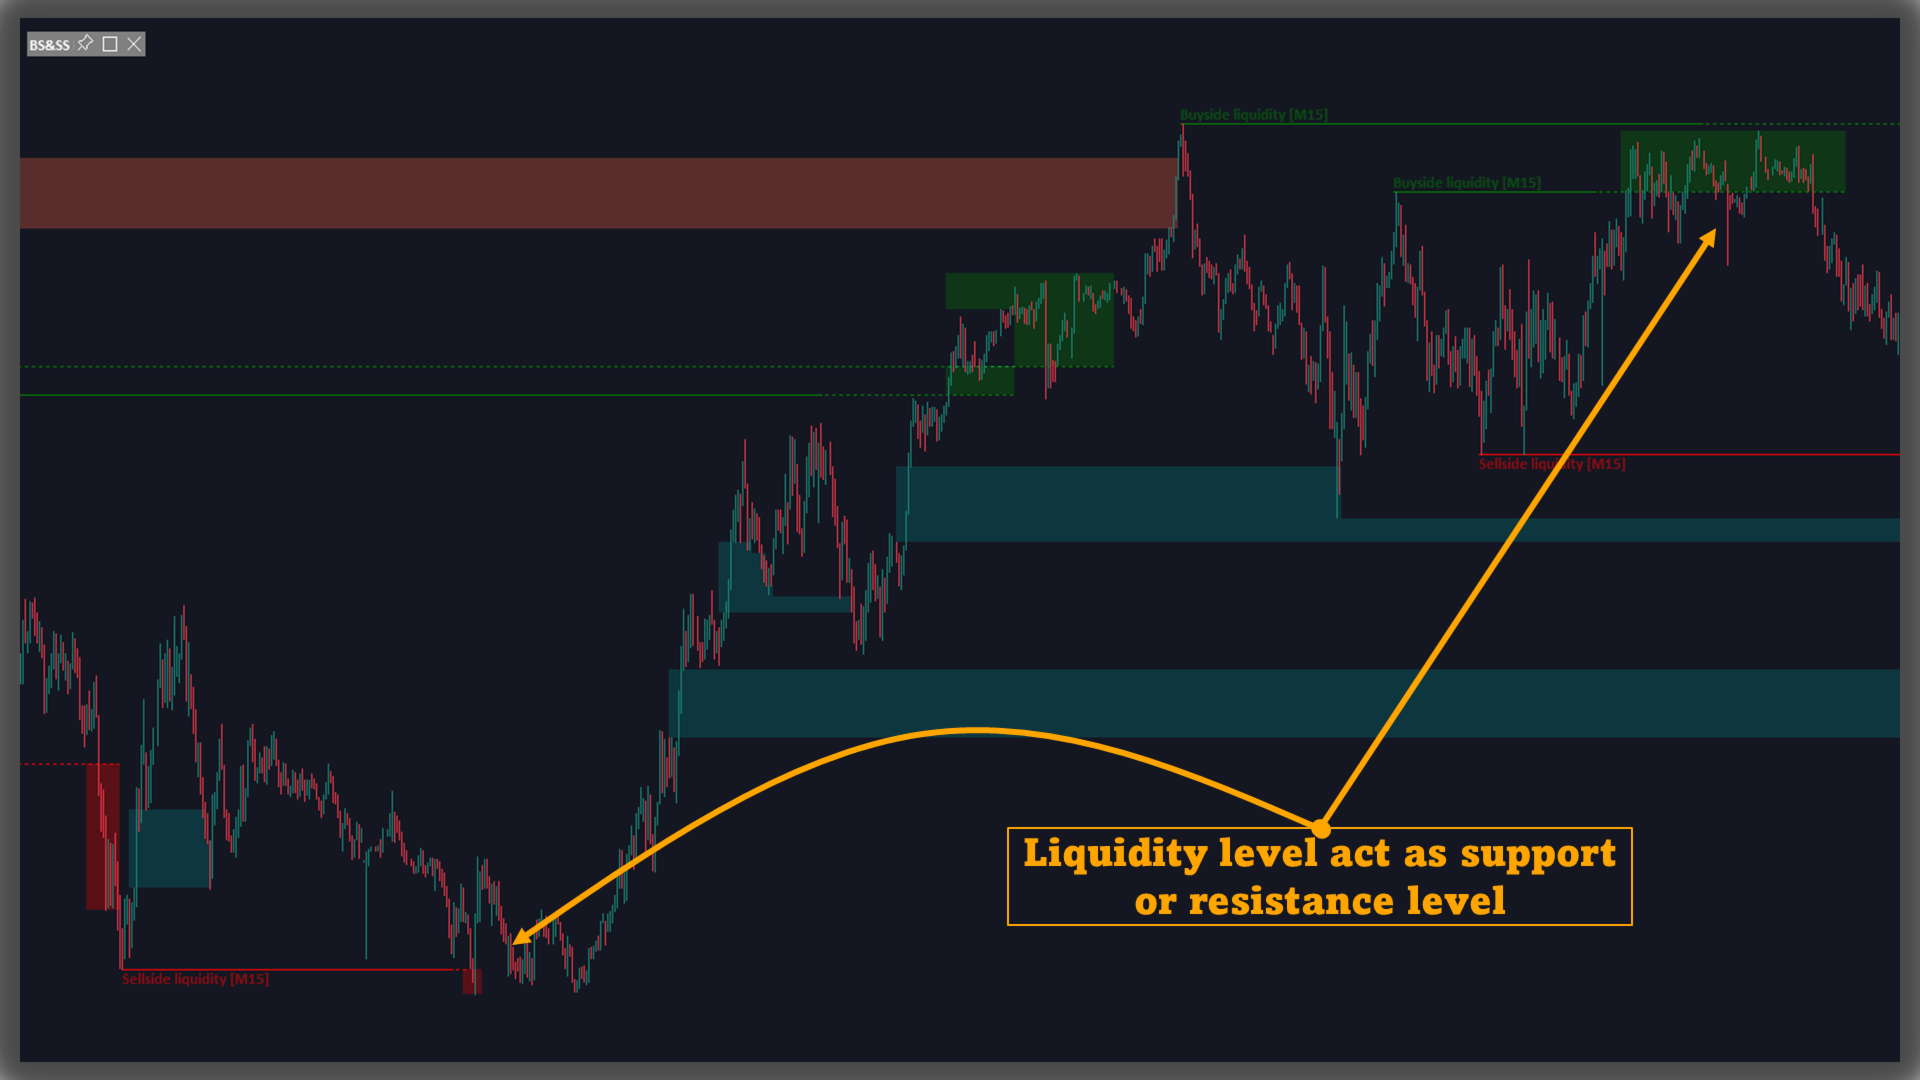
Notes• Buyside levels often align with clusters of nearby highs; sellside levels with clusters of nearby lows
• Post-breach zones outline the area price just traded through, useful for monitoring reactions around that vicinity
• Liquidity Voids are sliced so users can visually gauge how much of the displacement gets filled over time
• “Liquidity” here refers to order availability at specific prices; plotted objects provide visual context for where orders have clustered historically
• Concepts follow ICT methodology and may differ from other approaches
• Rendering depends on input data and graphical limits of the platform
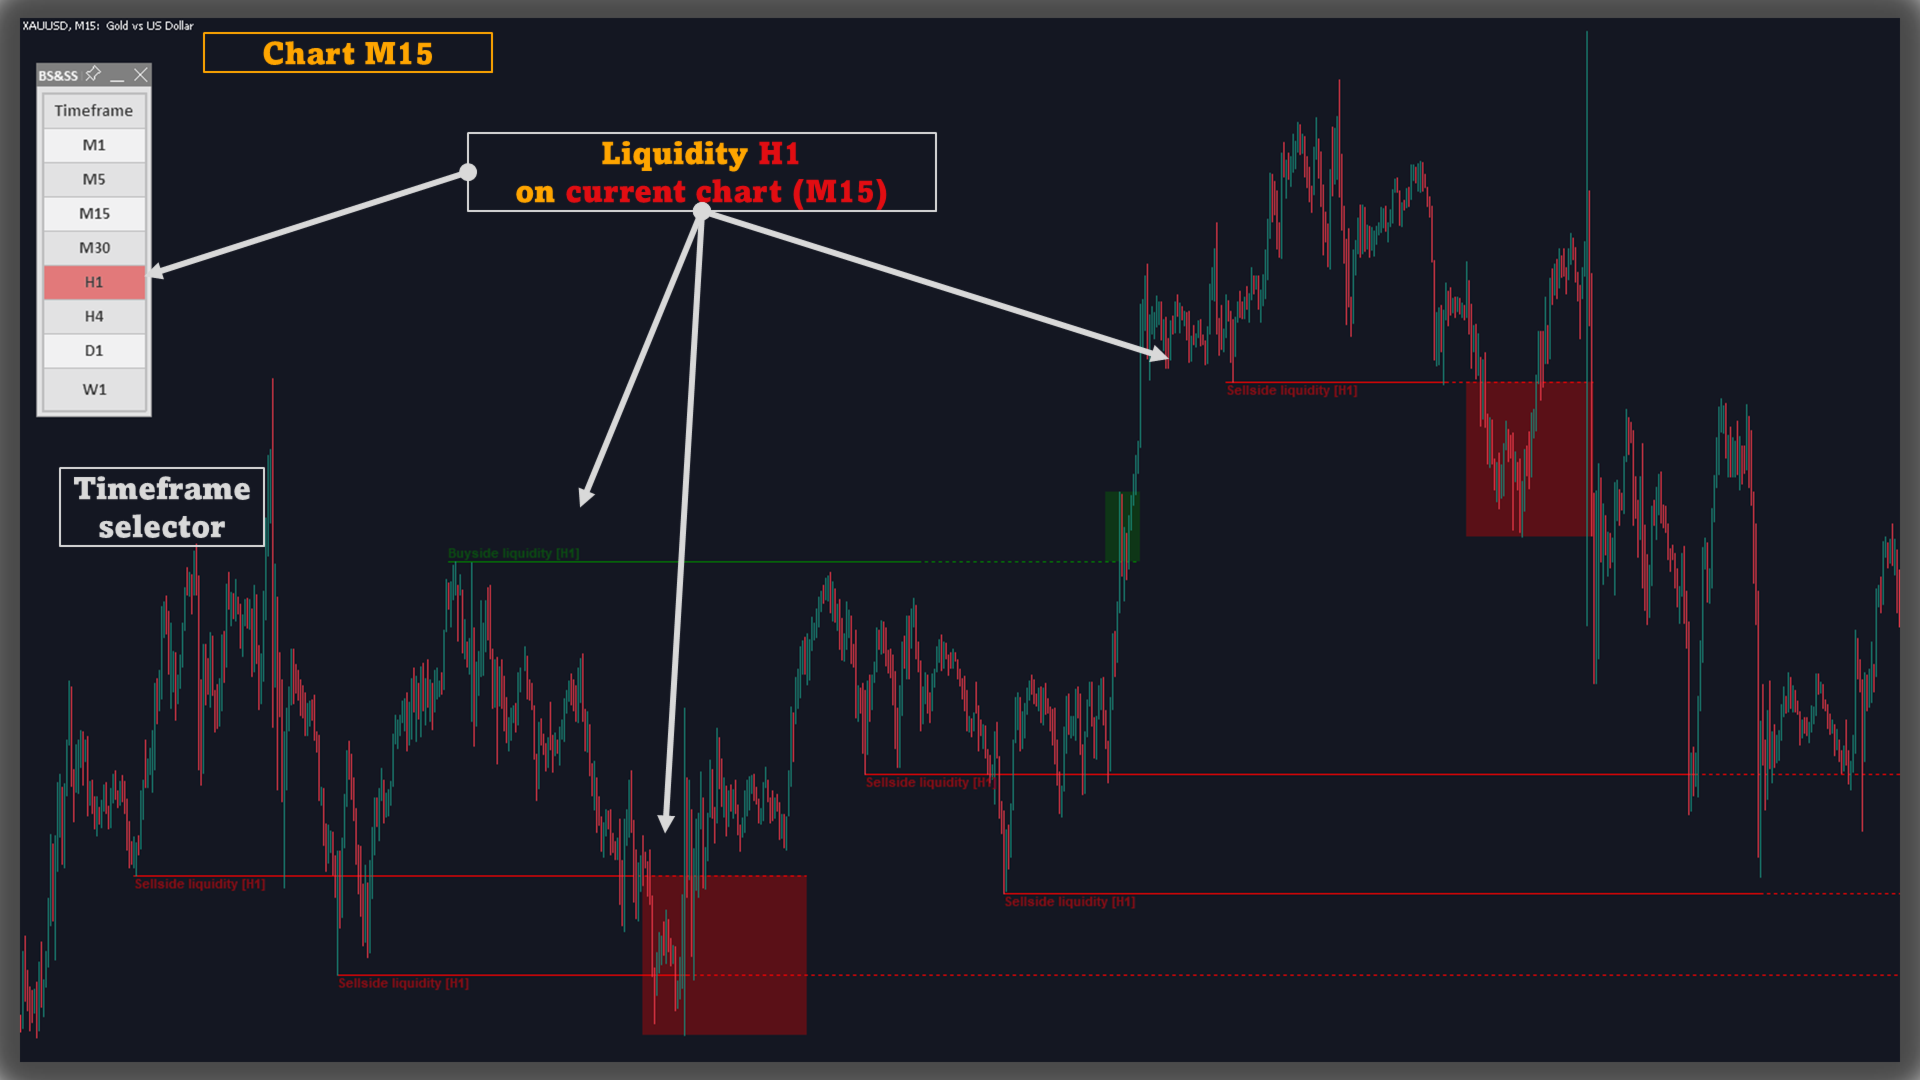
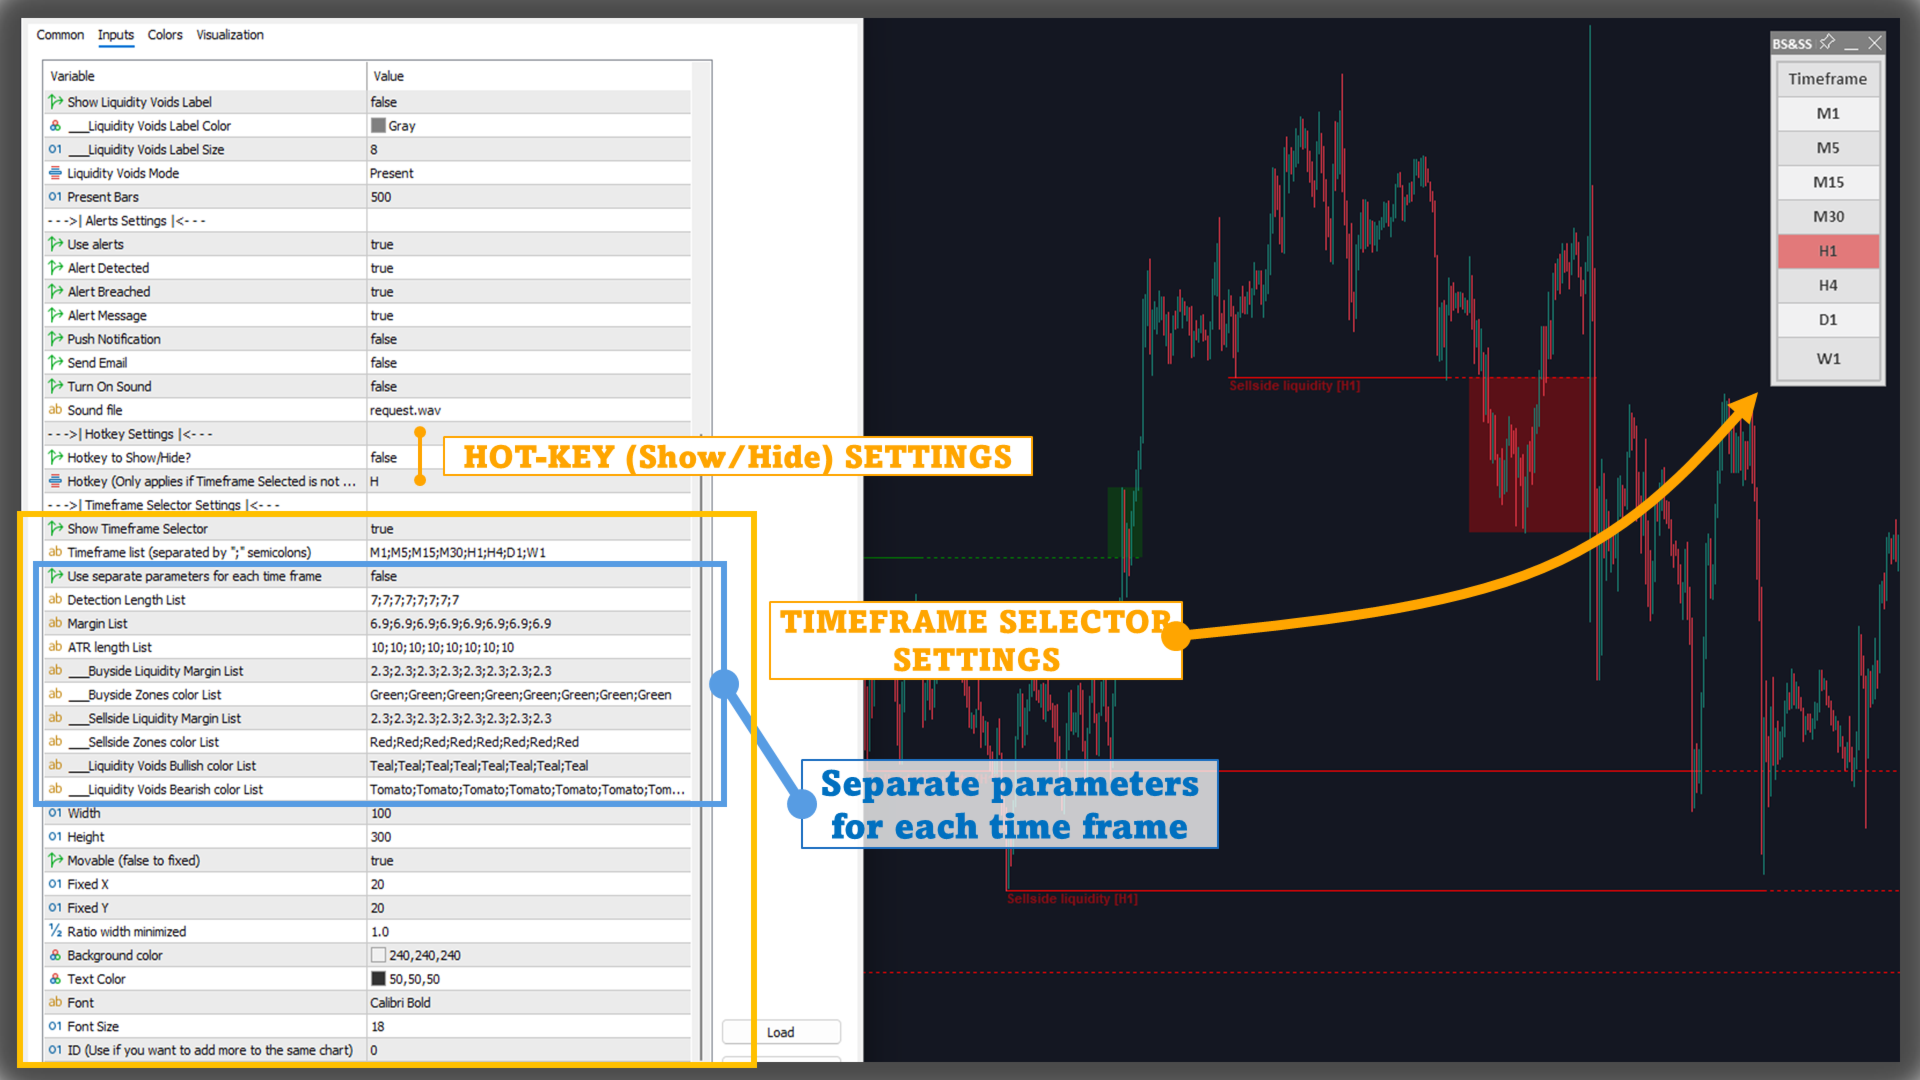
Multi-Timeframe Function (Timeframe Selector)
Users can enable/disable the timeframe they want to display at will, to suit their needs.For example, they can track the H1 indicator on the M5 chart, or M15 on the M5 chart instead of only being able to track M5 on the M5 chart.
Hot-key function
Used to hide/show the indicator on the chart. Note that this function only works when the Timeframe Selector is disabled (because the Timeframe Selector itself can hide/show the corresponding timeframe)
"Separate Parameters" function
To apply separate parameters to each timeframe, enable this feature in the input tab.
Note that the list of parameters is separated by a semicolon ";".
For example Timeframe list: "M1;M5;M15;M30;H1;H4;D1;W1"Detection Length List: "7;8;9;10;11;12;13;14"then the indicator will get the Detection Length value as follows:
M1: 7M5: 8M15: 9M30: 10H1: 11H4: 12D1: 13W1: 14
Conclusion
Buyside & Sellside Liquidity centers on levels, post-breach zones, and Liquidity Voids, with configurable visibility, data scope, colors, and alerts. It provides an orderly, event-focused view of liquidity structure so users can tailor what they monitor on their charts.