Buyside and Sellside Liquidity MT5 Multi Timeframe
- Indicatori
-
Duc Hoan Nguyen
 ->| Sono uno sviluppatore e programmatore dedicato, specializzato in MQL4, MQL5 e Pine Script per TradingView, con una comprovata esperienza nella creazione di soluzioni performanti e personalizzate per le piattaforme MT4, MT5 e TradingView. Nel corso degli anni, ho lavorato ampiamente nei settori
 - Versione: 1.10
- Aggiornato: 30 settembre 2025
- Attivazioni: 10
I nuovi strumenti saranno a $30 per la prima settimana o per i primi 3 acquisti!
Canale Trading Tools su MQL5: unisciti al mio canale MQL5 per ricevere le ultime novità
Vedi la versione MT5: Buyside and Sellside Liquidity MT5 Multi Timeframe
Vedi la versione MT4: Buyside and Sellside Liquidity MT4 Multi Timeframe
Vedi altri prodotti: All Products
Punti salienti
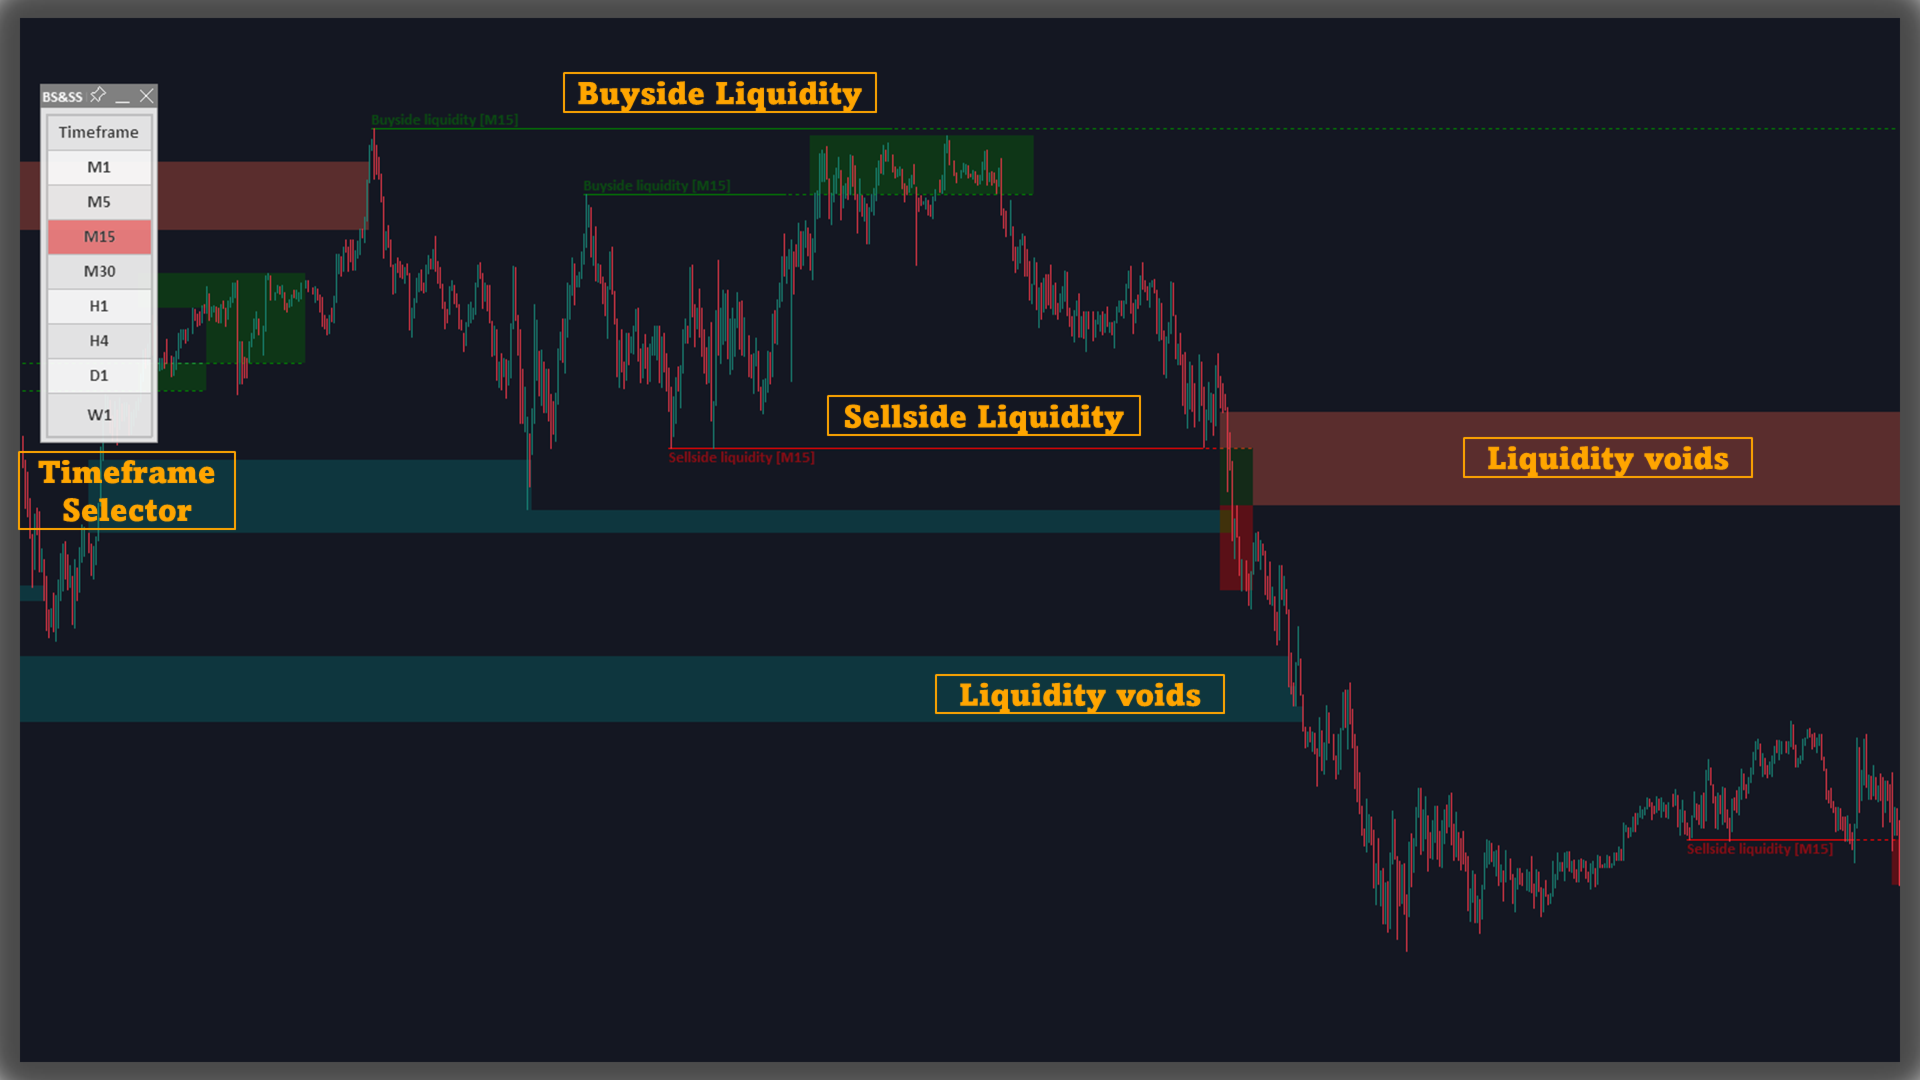
• Chiarisce la struttura di liquidità a due lati (buyside/sellside) con livelli e zone a colori
• Forma una zona subito dopo che un livello è stato trattato e la estende finché il prezzo rimane entro una banda controllata
• Visualizza i Liquidity Voids come sottili strati per monitorare il possibile riempimento nel tempo
• Offre modalità di visualizzazione finestra recente o intera storia e un limite agli oggetti visibili per mantenere i grafici ordinati
• Avvisi basati su eventi per nuovi/livelli aggiornati e per violazioni di livello (separati per buyside/sellside)
Cosa mostra
• Livelli di liquidità: derivati da cluster di massimi/minimi ripetuti situati entro uno stretto intervallo basato sulla volatilità
• Zone di liquidità: tracciate subito dopo la rottura di un livello per osservare il comportamento successivo nell’area
• Liquidity voids: sequenze di candele per lo più monodirezionali con corpi ampi e ombre corte, presentate come più riquadri sottili per il tracciamento visivo
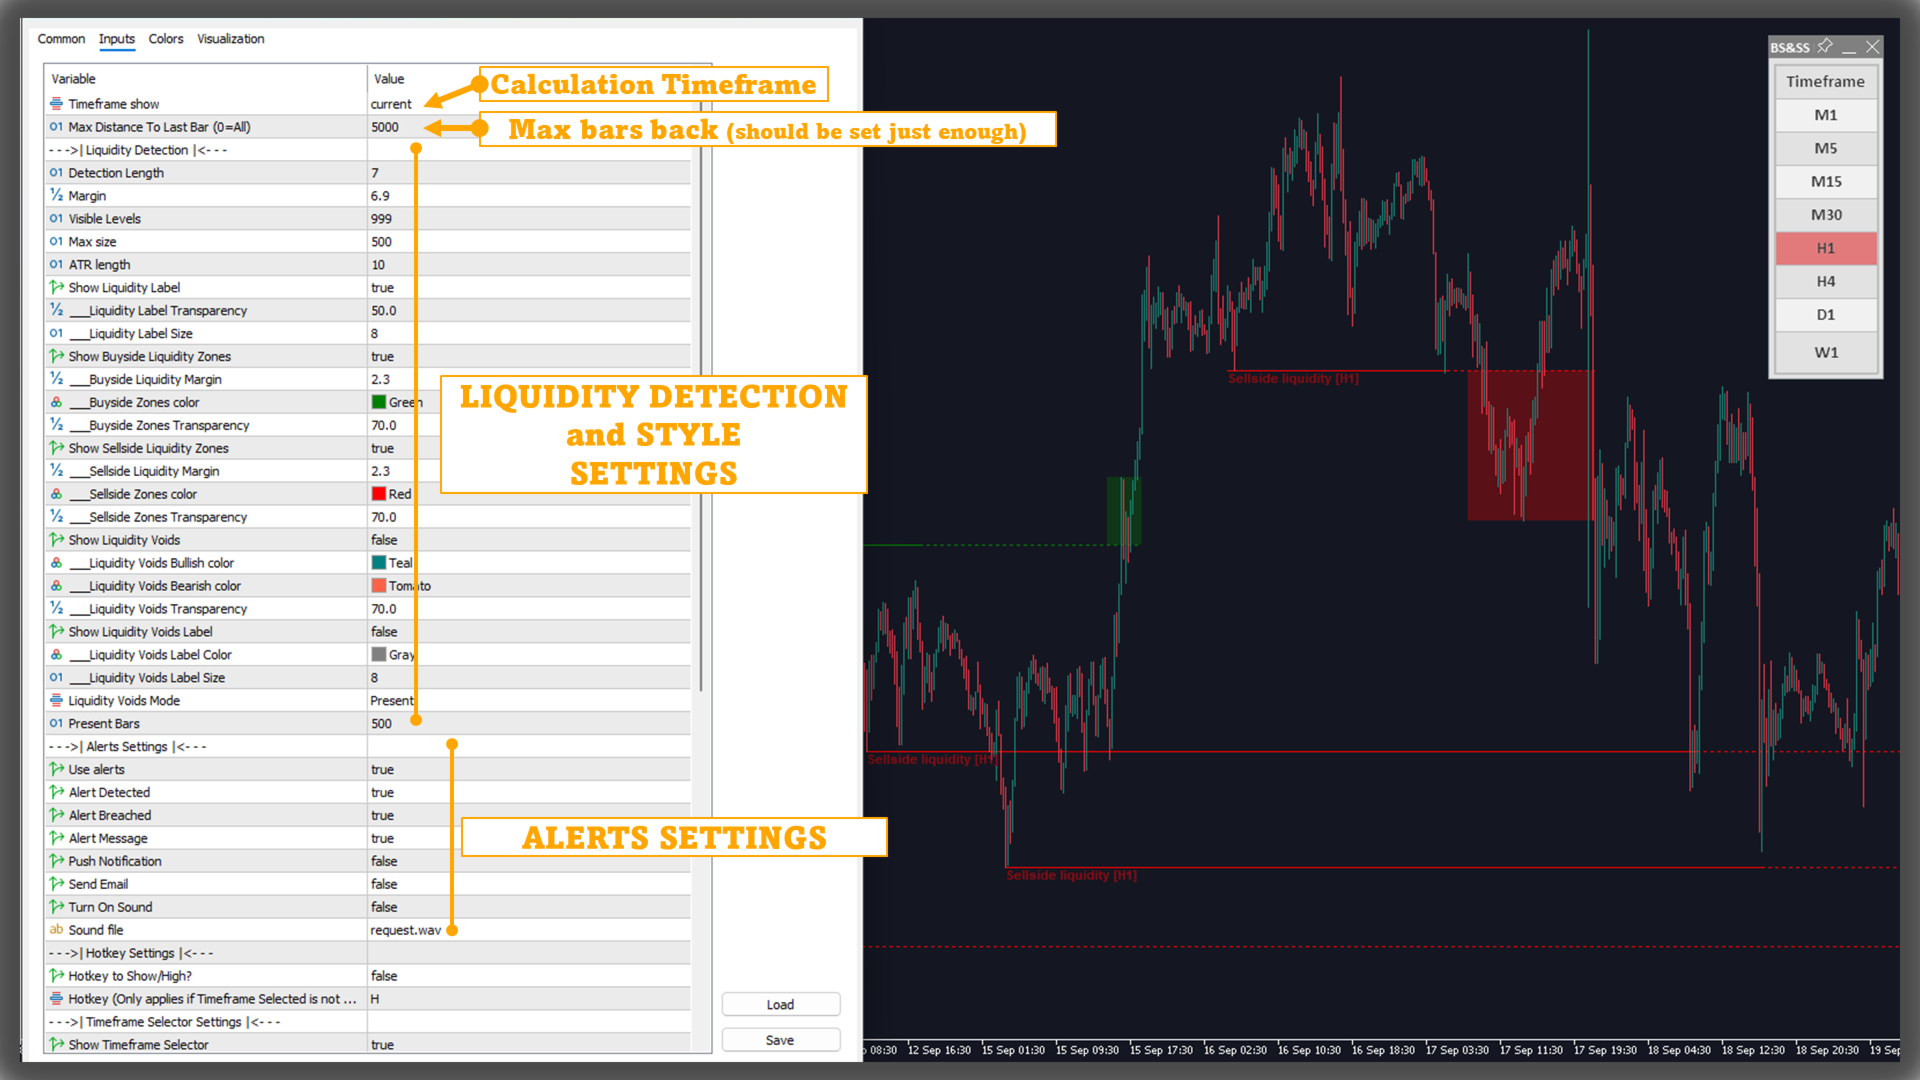
Impostazioni principali
Livelli di liquidità
• Ampiezza di lookback per identificare i livelli candidati
• Banda di sensibilità (consapevole della volatilità) per raggruppare massimi/minimi vicini
Zone di liquidità
• Abilita/disabilita zone lato acquisti e lato vendite
• Larghezza della zona definita dalla volatilità di mercato (basata su ATR)
• Opzioni colore indipendenti per ciascun lato
Liquidity Voids
• Abilita/disabilita in entrambe le direzioni
• Etichetta opzionale “Liquidity Void”
Opzioni di visualizzazione
Come funziona (breve)• Modalità: solo barre recenti o tutta la cronologia disponibile
• Numero massimo di livelli/zone mantenuti sullo schermo
-
Rilevamento livelli: trova cluster di punti swing ripetuti entro una tolleranza scalata alla volatilità; traccia un livello orizzontale con etichetta lato-specifica
-
Dopo la rottura: quando il prezzo attraversa un livello, viene creata una zona di liquidità intorno ad esso con una banda basata su ATR e si estende finché le barre successive rimangono all’interno della banda
-
Controllo visualizzazione: quando il numero di oggetti supera il limite dell’utente, livelli/zone più vecchi vengono rimossi per preservare la chiarezza
Avvisi
• Notifica quando viene rilevato un livello di liquidità (buyside/sellside)
• Notifica quando un livello di liquidità viene violato (buyside/sellside)
Lettura del grafico
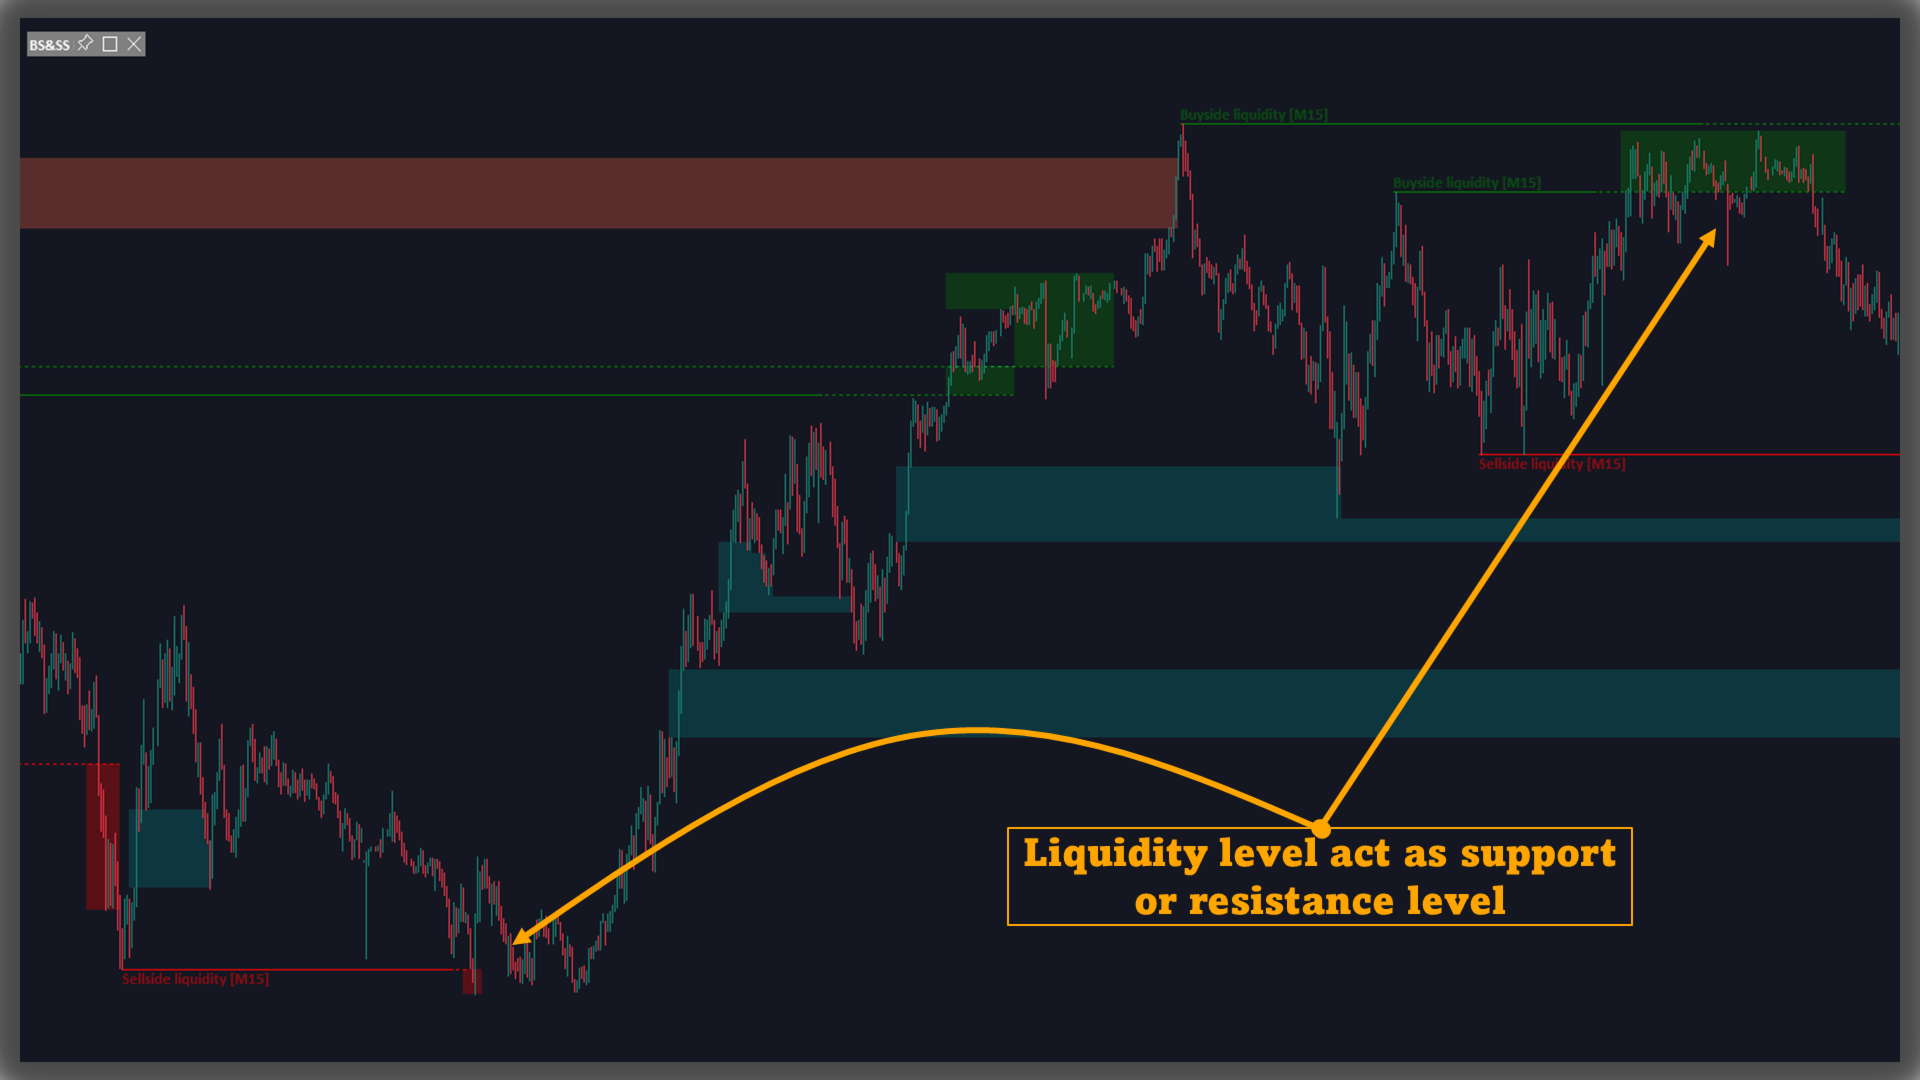
Note• I livelli lato acquisti spesso si allineano con cluster di massimi vicini; quelli lato vendite con cluster di minimi vicini
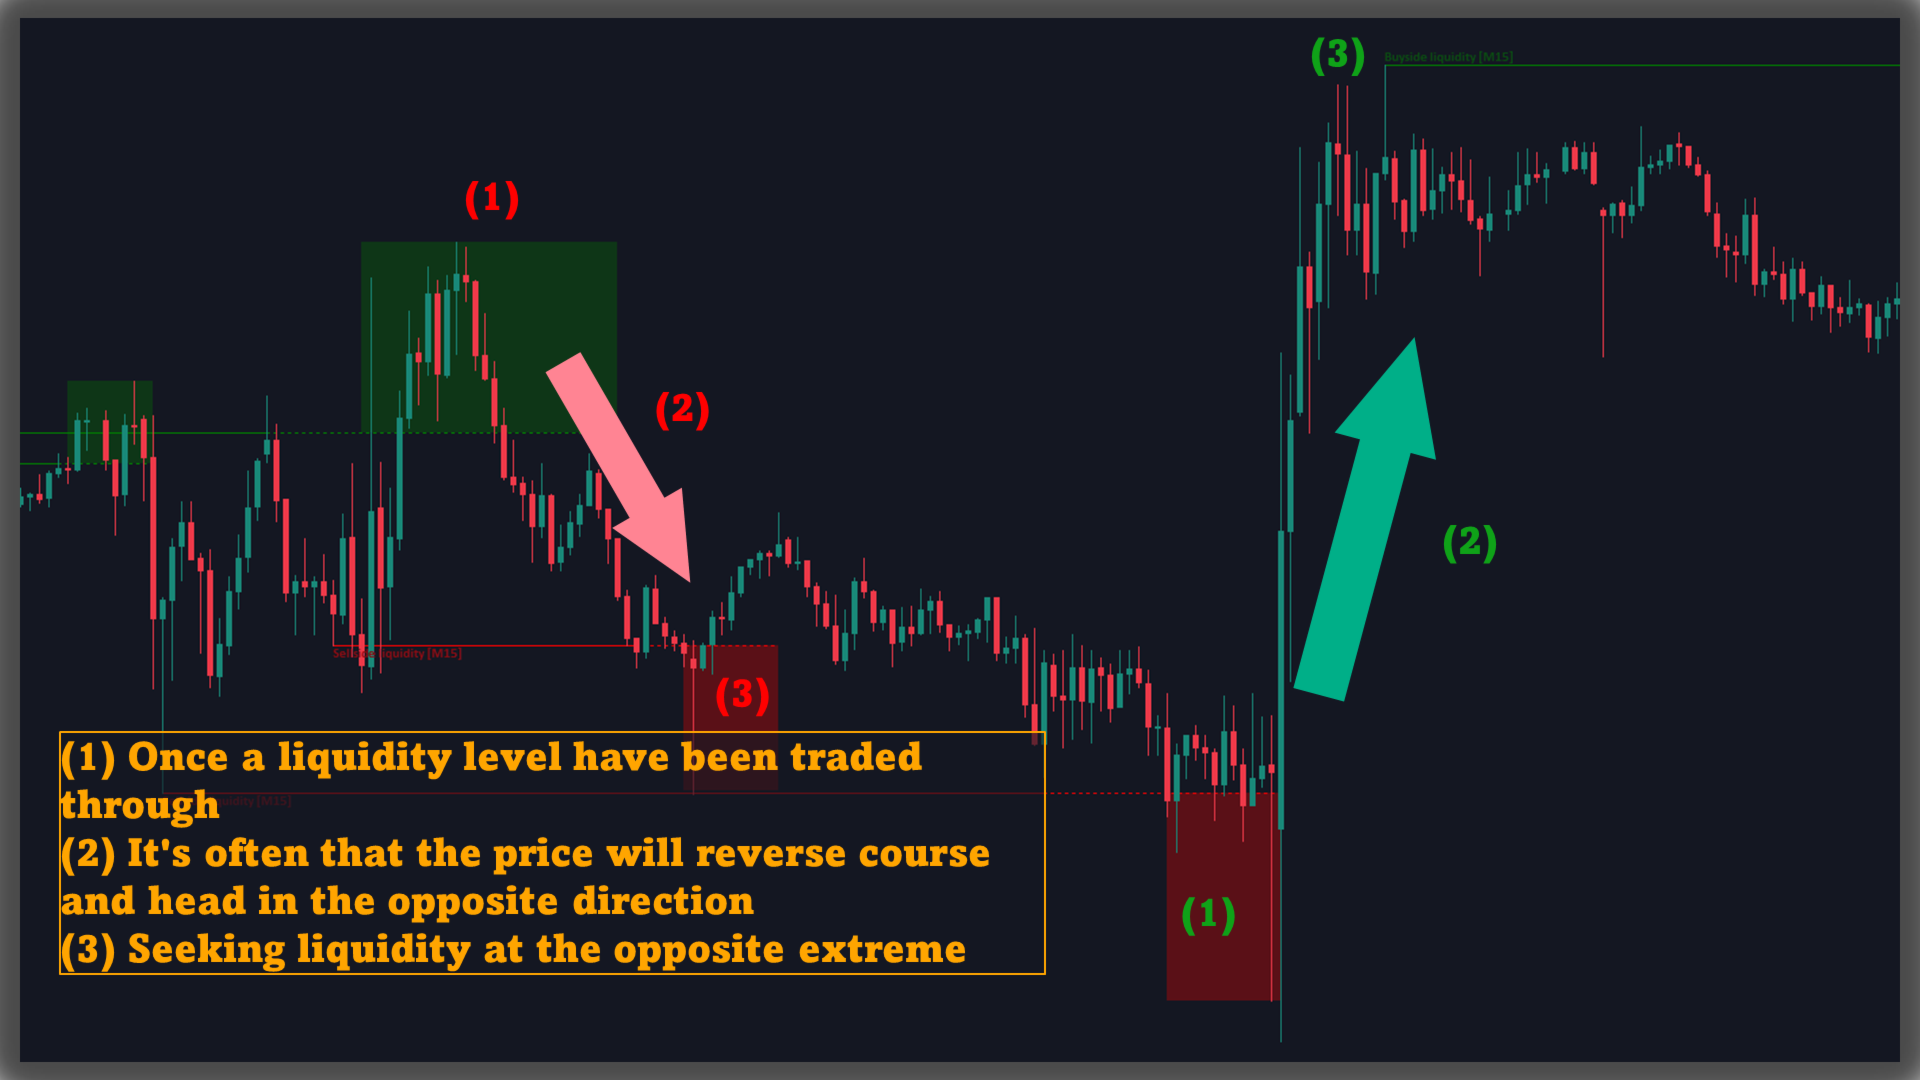
• Le zone post-rottura delineano l’area appena attraversata dal prezzo, utile per monitorare le reazioni nei dintorni
• I Liquidity Voids sono sezionati per valutare visivamente quanto dello spostamento venga colmato nel tempo
• Qui “liquidità” si riferisce alla disponibilità di ordini a prezzi specifici; gli oggetti tracciati forniscono contesto visivo delle aree in cui storicamente si sono raggruppati gli ordini
• I concetti seguono la metodologia ICT e possono differire da altri approcci
• Il rendering dipende dai dati di input e dai limiti grafici della piattaforma
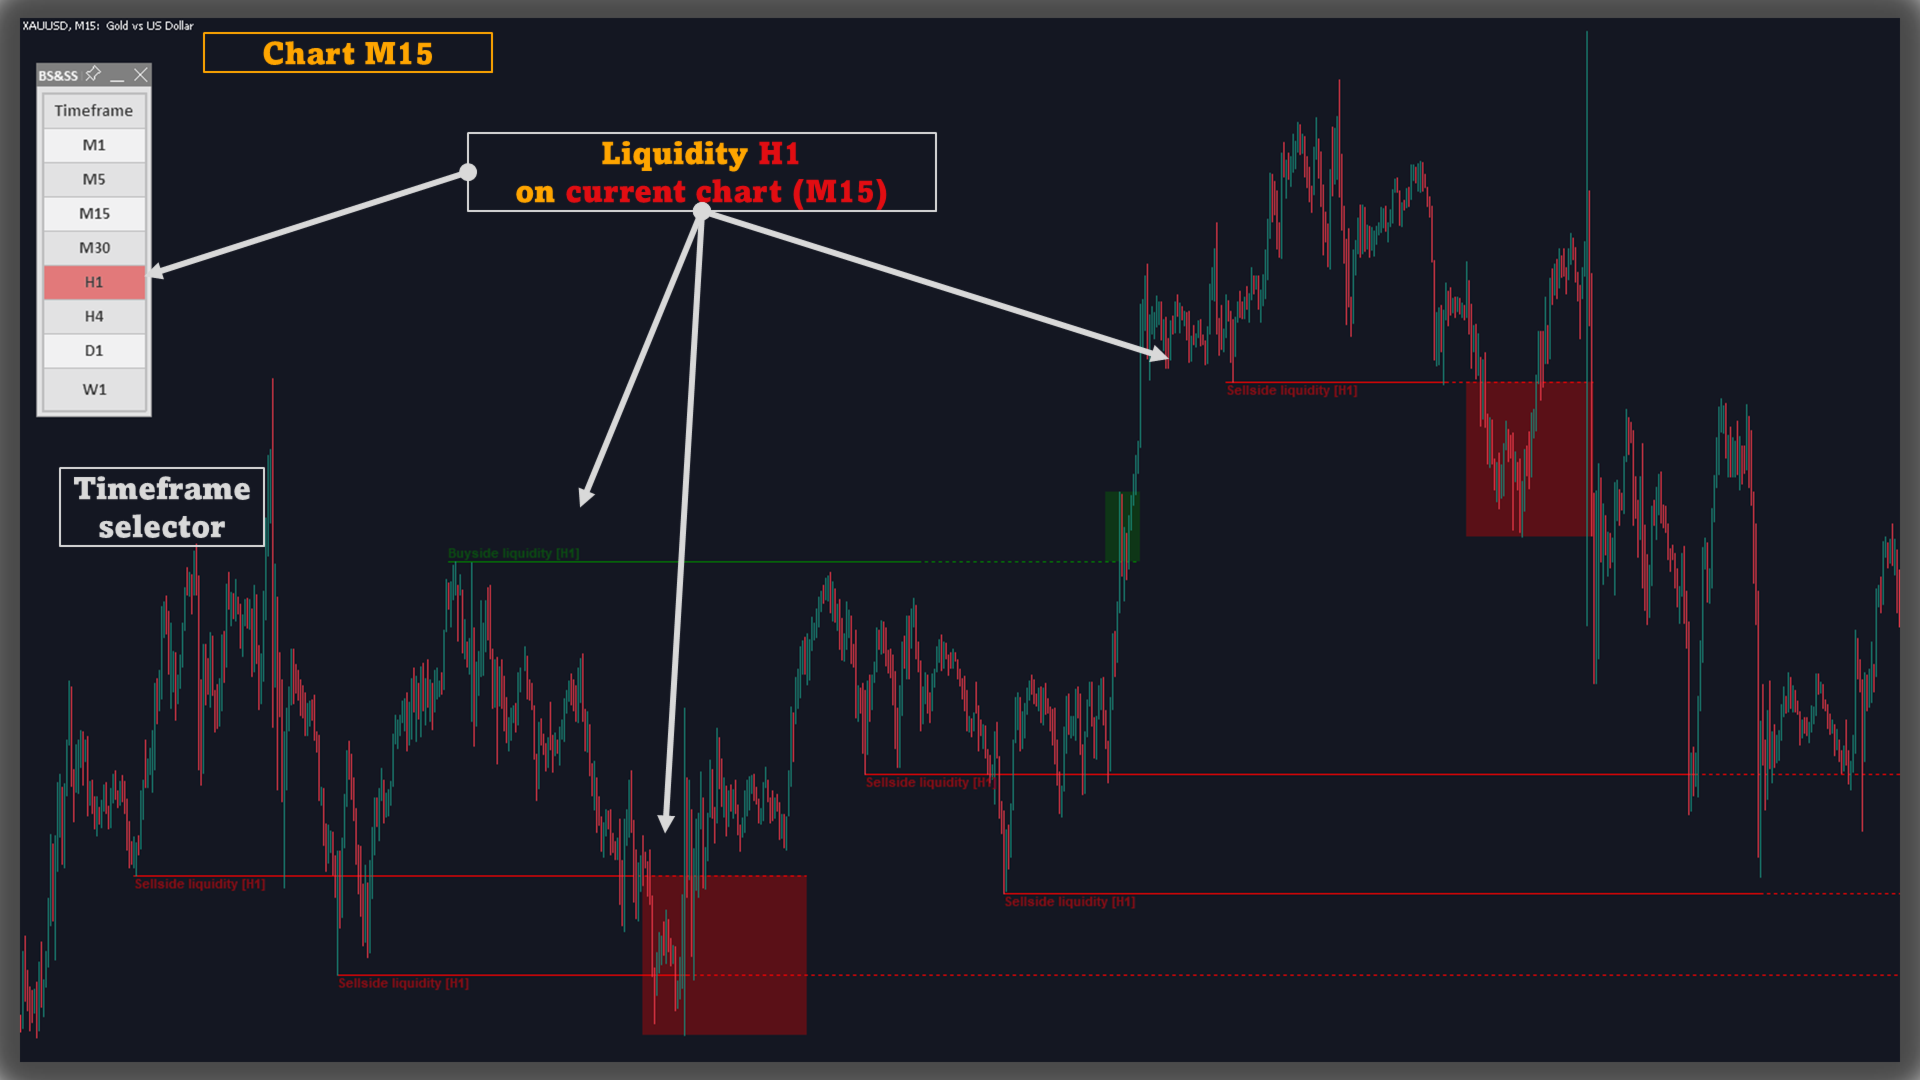
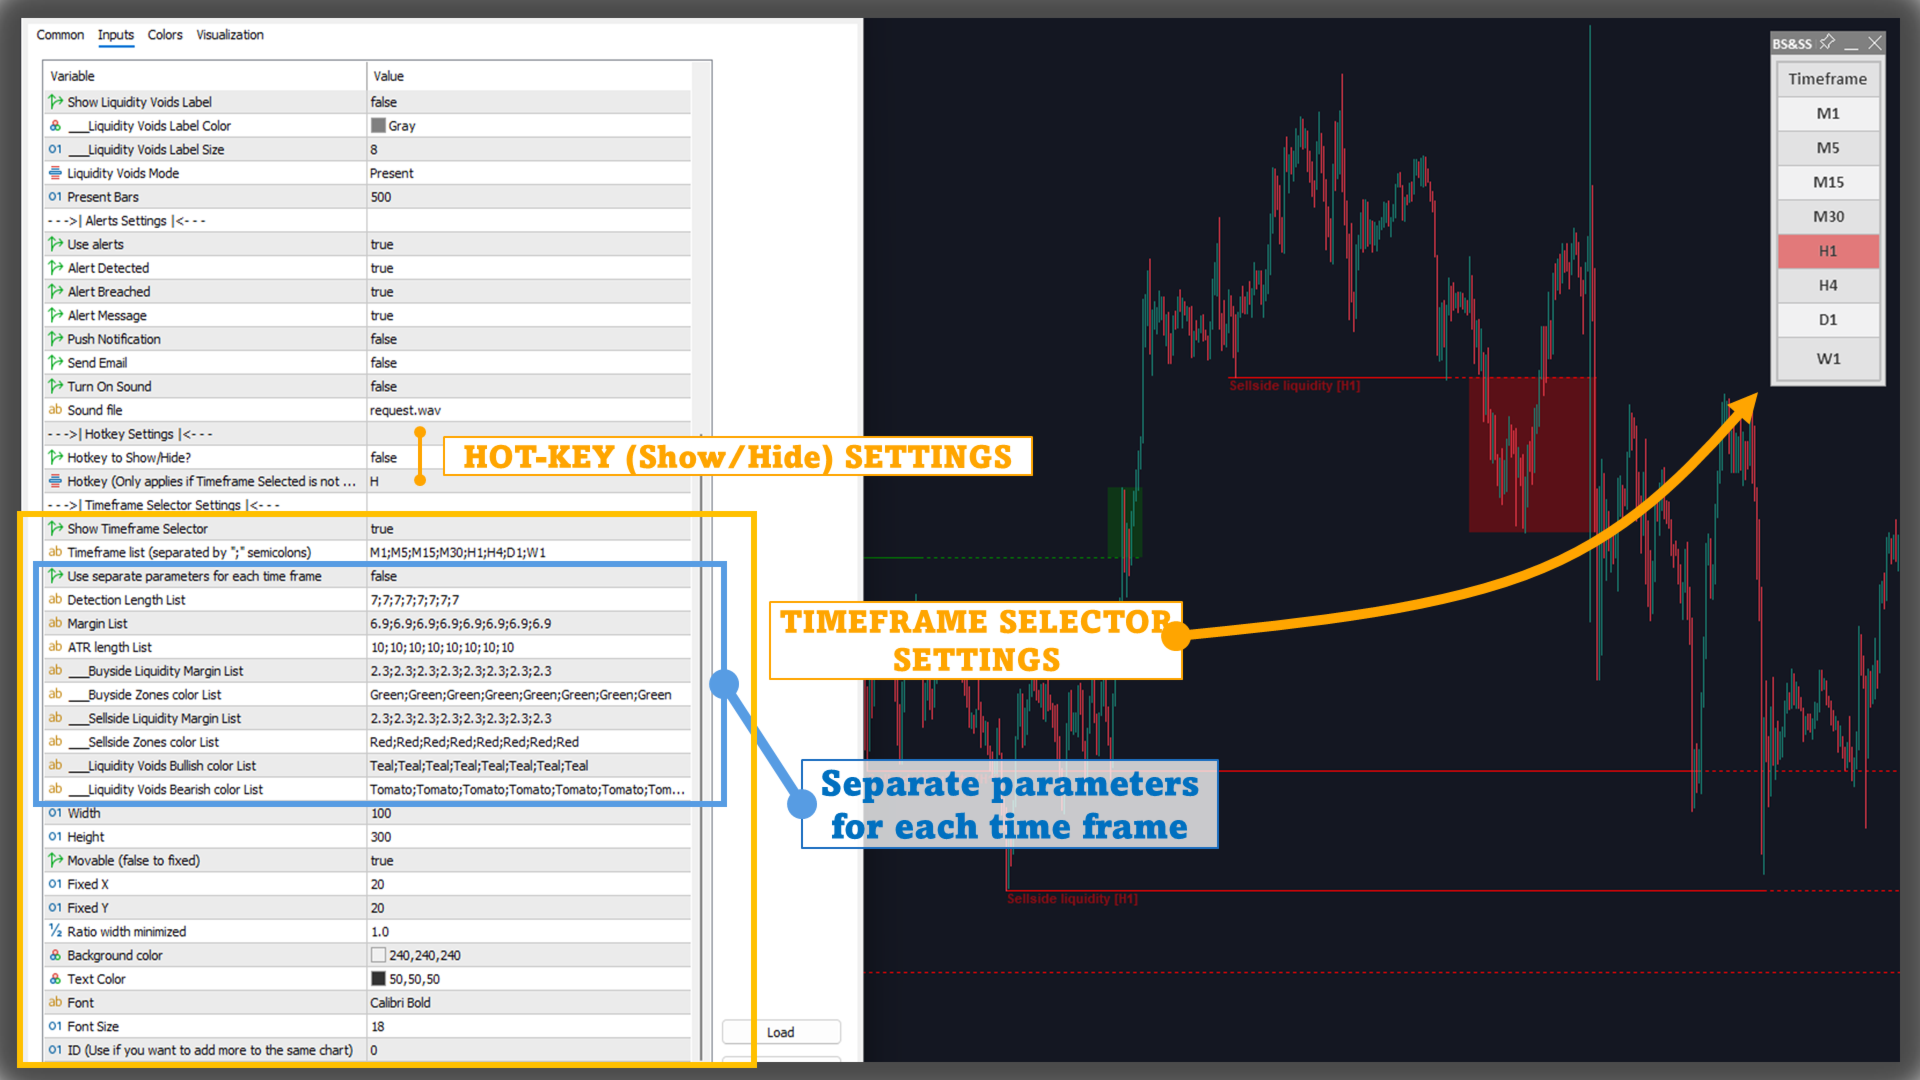
Funzione multi-timeframe (selettore timeframe)
Gli utenti possono abilitare/disabilitare a piacere il timeframe da visualizzare, in base alle esigenze.Ad esempio, è possibile seguire l’indicatore H1 su un grafico M5 o M15 su M5, invece di limitarsi a M5 su M5.
Funzione tasto rapido
Usata per nascondere/mostrare l’indicatore sul grafico. Funziona solo quando il selettore timeframe è disabilitato (poiché il selettore stesso può nascondere/mostrare il timeframe corrispondente).
Funzione “Separate Parameters”
Per applicare parametri separati a ciascun timeframe, abilita questa funzione nella scheda di input.
Nota: l’elenco dei parametri è separato da punto e virgola “;”.
Ad esempio, elenco timeframe: "M1;M5;M15;M30;H1;H4;D1;W1"Elenco Detection Length: "7;8;9;10;11;12;13;14"quindi l’indicatore acquisirà Detection Length come segue:
M1: 7M5: 8M15: 9M30: 10H1: 11H4: 12D1: 13W1: 14
Conclusione
Buyside & Sellside Liquidity si concentra su livelli, zone post-rottura e Liquidity Voids, con visibilità, ambito dati, colori e avvisi configurabili. Fornisce una vista ordinata e basata su eventi della struttura di liquidità, permettendo agli utenti di personalizzare il monitoraggio sui grafici.