Visual Wolf Momentum Indicator
- Indicators
- AL MOOSAWI ABDULLAH JAFFER BAQER
- Version: 1.0
- Activations: 5
Unleash the Power of Momentum with the Visual Wolf Indicator
Are you tired of momentum indicators that give false signals and leave you caught in market chop? The Visual Wolf Momentum Indicator is a professionally engineered tool designed to cut through the noise, identify dominant market trends, and provide clear, high-probability trading signals directly on your chart.
For just $30, you can equip yourself with an indicator that doesn't just follow the price—it understands the force behind it.
The Unique Logic: What is Wolf Momentum?
Traditional momentum oscillators often fail because they only look at the speed of price change. The Visual Wolf goes deeper, employing a unique proprietary logic to measure the persistence and dominance of buying or selling pressure.
Here is how it works in detail:
-
Price Smoothing: The indicator first applies a fully customizable moving average (EMA, SMA, etc.) to the source price. This creates a smoothed baseline to reduce random market noise from the very start.
-
Accumulated Force Calculation: For each bar, the indicator analyzes the change from the previous bar.
-
When the price moves up, it registers this as positive momentum. Crucially, it also adds to an "accumulated positive force" factor.
-
When the price moves down, it registers this as negative momentum and adds to an "accumulated negative force" factor.
-
-
The Tug-of-War: This is the secret behind the Wolf. The final momentum values are calculated in a unique way:
-
Up Momentum = Current Positive Change - Accumulated Negative Force
-
Down Momentum = Current Negative Change - Accumulated Positive Force
-
This creates a dynamic "tug-of-war" between buyers and sellers. A strong, persistent uptrend builds a large positive force, which actively suppresses the calculation of any minor down moves. Likewise, a dominant downtrend builds negative force that diminishes the impact of small bounces. The result is an indicator that intelligently filters out weak counter-moves and only highlights true, persistent momentum.
Key Features
-
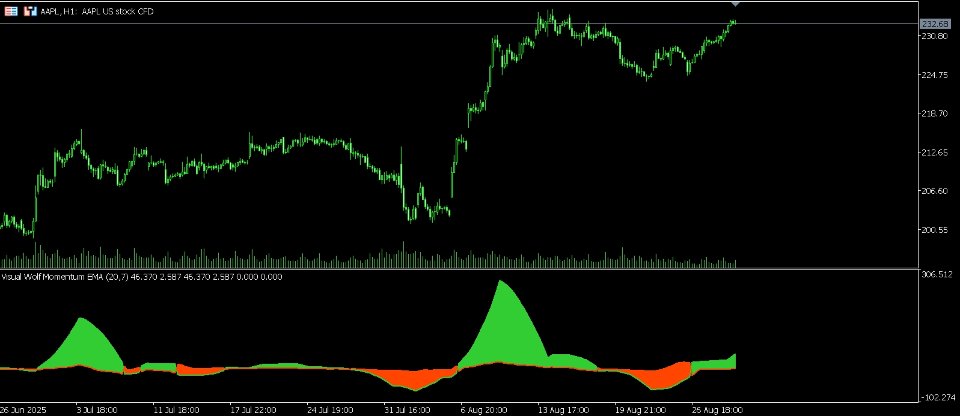
Intuitive Visual Histogram: See the battle between buyers and sellers unfold in a separate window. A solid green fill shows clear bullish dominance, while a solid red fill indicates that bears are in full control.
-
High-Probability Arrow Signals: Receive non-repainting buy and sell signals as arrows directly on your main chart, pointing out the exact moment momentum shifts decisively.
-
Advanced Signal Filtering: Signals are only generated when two conditions are met: a momentum crossover occurs, AND the momentum value exceeds a customizable threshold. This filters out weak, insignificant signals.
-
Built-in Cooldown Period: The exclusive "Bars Delay" feature prevents the indicator from generating too many signals in a row. You can define how many bars the indicator must wait before showing a new signal, helping you avoid over-trading and focus on more significant market moves.
-
Fully Customizable: Tailor every aspect of the indicator to your trading style. Adjust momentum periods, smoothing methods, signal thresholds, colors, and arrow sizes.
How to Trade with the Visual Wolf
Entry Signals:
-
Buy: Enter a long position when a green "Buy" arrow appears on your chart. For confirmation, the histogram in the indicator window should be green.
-
Sell: Enter a short position when a red "Sell" arrow appears. For confirmation, the histogram should be red.
Trend Riding and Exits:
-
Stay in your trade as long as the histogram color remains in your favor (green for buys, red for sells).
-
Consider exiting a position if the histogram color flips or when an opposite signal arrow appears.
The Visual Wolf Momentum Indicator is more than just a tool; it is a complete solution for traders who demand clarity and precision. Stop guessing and start trading with an edge.
Input Parameters
Wolf Momentum Settings
-
Momentum Period: The main lookback period for the momentum calculation.
-
Smoothing Period: The period for the initial moving average smoothing.
-
Smoothing Method: The type of moving average to use (EMA, SMA, SMMA, LWMA).
-
Applied Price: The price source for calculations (Close, Open, High, etc.).
Signal Settings
-
Enable bars between signals: Set to true to activate the signal cooldown feature.
-
Bars to wait between signals: The number of bars to wait before a new signal can be generated.
-
Signal Threshold: The minimum momentum value required to trigger a signal arrow.
-
Arrow Offset (points): How far the arrow appears from the price bar.
Visual Settings
-
Buy Signal Color: The color of the buy arrow.
-
Sell Signal Color: The color of the sell arrow.
-
Arrow Size (1-5): The size of the signal arrows.
Logging Settings
-
Show detailed logs: Enable expert logs for troubleshooting or analysis.
-
Log to file: Save logs to a file instead of the terminal.
-
Log file name prefix: The prefix for the log file name.
-
Maximum log file size in MB: Manages the size of the log file.
