Visual Dolphin Indicator
- Indicators
- AL MOOSAWI ABDULLAH JAFFER BAQER
- Version: 1.0
- Activations: 5
Visual Dolphin Indicator
Unlock the rhythm of the market with the Visual Dolphin Indicator, your ultimate tool for identifying and capitalizing on market trends with clarity and confidence. Designed for both novice and experienced traders, this indicator eliminates the noise and guesswork, providing crystal-clear buy and sell signals directly on your chart.
The Logic Behind the Waves
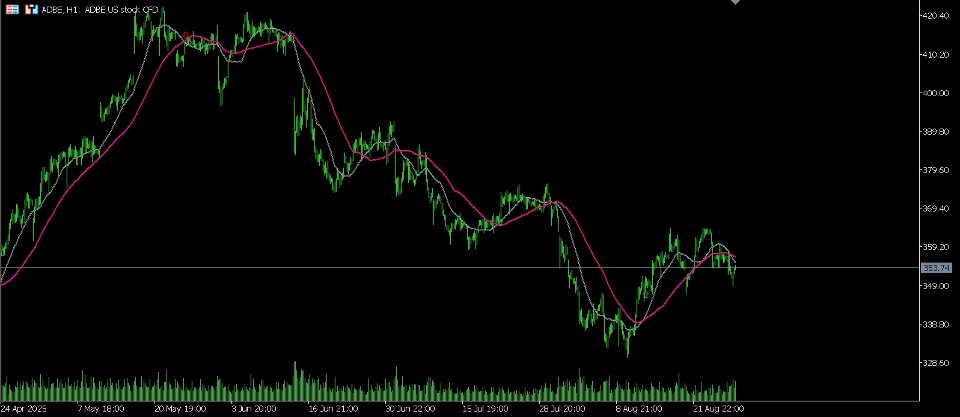
The core of the Visual Dolphin Indicator is a sophisticated yet intuitive dual-wave system based on moving averages. Think of the market as an ocean. Our indicator visualizes this ocean with two distinct lines:
-
The Fast Wave (Aqua Blue): This represents the "Dolphin," capturing the immediate momentum and short-term price action. It's agile and responsive to changes in the market.
-
The Slow Wave (Magenta): This represents the "Ocean Tide," indicating the underlying, more significant market trend. It provides stability and context to the price movements.
Trading signals are generated based on the interaction between these two waves, a classic and proven method for trend analysis:
-
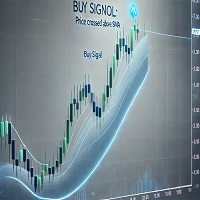
Buy Signal: A lime green arrow appears when the Fast Wave gracefully crosses above the Slow Wave. This indicates that short-term momentum is strengthening in the direction of a new potential uptrend, much like a dolphin leaping out of the water.
-
Sell Signal: A red arrow appears when the Fast Wave dives below the Slow Wave. This signifies that short-term momentum is shifting downwards, signaling a potential downtrend.
Key Features That Set It Apart
The Visual Dolphin Indicator is more than just a simple crossover tool. It is packed with essential features that give you full control and help you filter out market noise.
-
Crystal Clear, Non-Repainting Signals: The buy and sell arrows are plotted precisely when a crossover is confirmed on the close of a bar and they never repaint. What you see is what you get, allowing you to make decisions with confidence.
-
Intelligent Signal Filter: Avoid the chaos of choppy markets. The unique "Bars Delay" feature allows you to define the minimum number of bars that must pass before a new signal can appear. This powerful filter prevents over-trading during periods of consolidation and ensures you only act on more established, meaningful trend changes.
-
Complete Customization: Tailor the indicator to any market, any timeframe, and any trading style. You have full control over:
-
Periods: Adjust the sensitivity of the Fast and Slow Waves.
-
MA Method: Choose from Simple, Exponential, Smoothed, or Linear Weighted moving averages.
-
Applied Price: Apply the calculations to the Close, Open, High, Low, or other price points.
-
-
Personalized Visual Experience: Make the indicator your own. Customize the color of the waves and signals to match your preferred chart theme. You can also adjust the size and offset of the arrows for perfect visibility.
-
Advanced Logging for Analysis: For the data-driven trader, the indicator includes a comprehensive logging system. Keep detailed records of every signal generated, either in the terminal or in a separate file, to fine-tune your strategies.
How to Use the Visual Dolphin Indicator
-
Attach the indicator to your desired chart and timeframe.
-
Adjust the Wave Settings and Signal Settings in the input menu to match your trading strategy, or start with the robust default settings.
-
Wait for a clear Buy (Lime Arrow) or Sell (Red Arrow) signal to appear.
-
Combine the signal with your own analysis to execute your trade.
Stop guessing the trend and start trading in harmony with the market's flow. The Visual Dolphin Indicator provides the clarity you need to navigate the waves of any financial instrument.
Add the Visual Dolphin Indicator to your trading toolkit today for just $30 and transform the way you see the market.
Full List of Customizable Parameters
Wave Settings
-
Fast Wave Period
-
Slow Wave Period
-
Wave Step Size
-
Moving Average Method
-
Applied Price
Signal Settings
-
Enable bars between signals
-
Bars to wait between signals
-
Arrow offset from price (points)
-
Arrow size (1-5)
Visual Settings
-
Buy signal color
-
Sell signal color
-
Fast wave color
-
Slow wave color
Logging Settings
-
Show detailed logs in journal
-
Log to file instead of terminal
-
Log file name prefix
-
Maximum log file size in MB
Manual Trading
-
Manual lot size for signals

