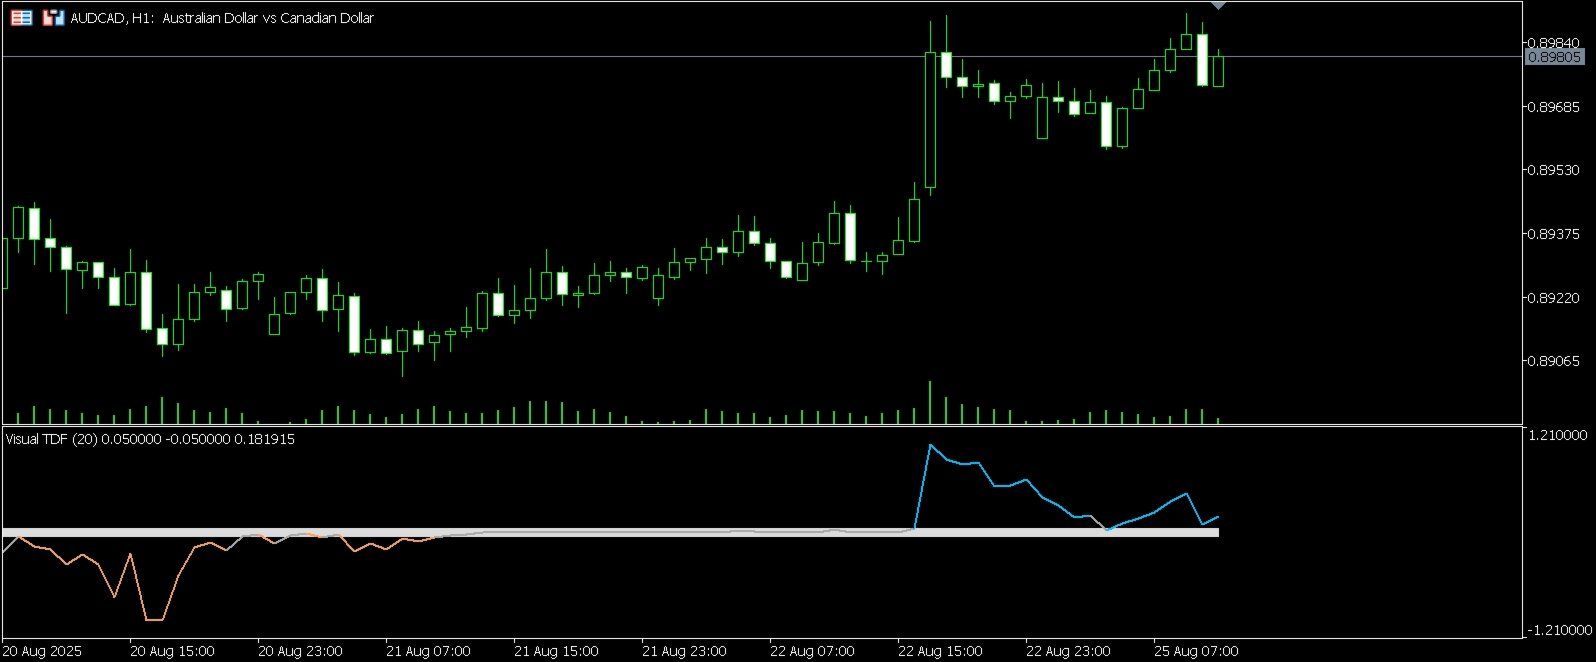
Visual Trend Direction and Force
- Indicators
-
AL MOOSAWI ABDULLAH JAFFER BAQER
 To trade successfully we need to go through the proven path that others had gone and reached!
Here are 17 quotes from such successful investors:
1- Limit your size in any position so that fear does not become the prevailing instinct guiding your judgment.
Joe Vidich - Version: 1.0
- Activations: 5
| • Please test the product in the Strategy Tester before purchasing to understand how it works. • If you face any issues, contact me via private message—I’m always available to help. • After purchase, send me a screenshot of your order to receive a FREE EA as a gift. |
|---|
Unlock the True Force of the Market and Trade with Unprecedented Clarity
Are you tired of trend indicators that lag, produce false signals in choppy markets, and fail to distinguish between a weak trend and a powerful, profitable move? The Visual Trend Direction and Force (TDF) Indicator is the definitive solution, engineered to provide a crystal-clear and immediate view of both the trend's direction and, more importantly, its underlying strength.
This is not just another moving average crossover tool. The TDF is a sophisticated instrument designed for serious traders who demand precision.
The Logic Behind the TDF Indicator
The power of the TDF Indicator lies in its unique and intelligent formula that analyzes price action on a deeper level. Here is a detailed breakdown of how it works:
-
Dual Smoothed Moving Averages: The calculation begins with a robust foundation, using a double-smoothed moving average. This technique effectively filters out market noise far better than a single moving average, providing a more stable and reliable baseline of the true underlying trend.
-
Measuring Market Dynamics: From this baseline, the indicator calculates two critical components of price movement:
-
Divergence: It measures the absolute separation between the fast-moving average and its smoothed counterpart. A wider separation indicates a stronger, more established trend.
-
Impetus: It calculates the average momentum, or rate-of-change, of both moving averages. This tells you how fast the price is accelerating in the trend's direction.
-
-
The "Force" Formula: This is where the TDF's unique advantage comes into play. The indicator combines the Divergence and the Impetus using a proprietary formula that gives exponential weight to the momentum ( Divergence * Impetus³ ). By cubing the impetus value, the indicator becomes exceptionally sensitive to accelerating momentum. This means:
-
Strong, powerful trends are significantly amplified, appearing as strong peaks and valleys on your chart.
-
Weak, low-momentum price action is suppressed, helping you ignore the chop and avoid false entries.
-
-
Normalization for Clarity: The final value is normalized over a specific period. This process scales the output into a consistent and easy-to-read oscillator, allowing you to compare trend strength across different timeframes and market conditions accurately.
Key Features and Benefits
-
Instantly Identify Trend Direction and Strength: The main line changes color to give you unambiguous signals: Deep Sky Blue for a bullish trend, Sandy Brown for a bearish trend, and Dark Gray for a neutral or non-trending market.
-
Advanced Noise Filtering: The core logic is specifically designed to minimize the impact of insignificant price fluctuations, keeping you out of volatile, directionless markets.
-
The "No Trend Zone": The indicator clearly plots a neutral zone. When the main line is within this area, it signals that no discernible trend is present, advising you to stay on the sidelines and protect your capital.
-
Trade with Confidence: By visualizing the force behind a trend, you can make more informed decisions. Enter the market when momentum is strong and accelerating, and consider exiting when the indicator shows the trend is losing its power.
-
Fully Customizable: Easily adjust the trend period and trigger levels to perfectly match your trading style, preferred timeframe, and specific instrument, from forex and commodities to indices and crypto.
-
No Repainting: The indicator's calculations are based on closed bars, ensuring that its signals are stable, reliable, and do not change after the fact.
How to Use the Visual TDF Indicator
The TDF is a versatile tool that can be the centerpiece of a trading strategy or a powerful confirmation tool.
-
Trend Following: Enter a long position when the indicator line turns blue and moves above the upper trigger level. Enter a short position when the line turns brown and moves below the lower trigger level.
-
Exit Strategy: When the indicator line turns gray and enters the "no trend zone," it's a clear signal that the trend's momentum is fading. This can be used as a signal to take profits or tighten your stop-loss.
-
Market Confirmation: Use the TDF to confirm signals from your existing strategies. If your system generates a buy signal, check the TDF. A strong blue reading confirms high conviction in the trade.
Input Parameters
-
Trend Period: The main lookback period for the moving average calculations. Higher values are smoother and better for long-term trends, while lower values are more responsive for short-term trading.
-
Trigger Up Level: The upper threshold that the indicator must cross to confirm a strong bullish trend.
-
Trigger Down Level: The lower threshold that the indicator must cross to confirm a strong bearish trend.
-
Logging Settings: Advanced options for enabling detailed logs for analysis and debugging.
For a modest, one-time price, the Visual Trend Direction and Force Indicator provides a level of market insight that can fundamentally enhance your trading decisions. Stop guessing the trend's strength—start measuring it.