Fractal Momentum Analyzer
- Indicators
- AL MOOSAWI ABDULLAH JAFFER BAQER
- Version: 2.0
- Activations: 5
Fractal Momentum Analyzer: Decode the Market's Hidden Structure
Unlock a new dimension of market analysis with the Fractal Momentum Analyzer. While traditional indicators measure price and volume, this powerful tool goes deeper, quantifying the underlying complexity and geometric structure of market movements. For just $30, you can gain a unique edge by understanding the very nature of price action before a major move occurs.
This is not just another oscillator. The Fractal Momentum Analyzer is built upon the sophisticated principles of fractal geometry and the Hurst exponent, designed to reveal the momentum of the market's own chaotic nature.
The Core Logic Explained
The indicator operates in a two-stage process to deliver its unique insights:
-
Measuring Fractal Dimension: First, the indicator analyzes the price action over a user-defined Analysis Period . It doesn't just look at the highest high or lowest low; instead, it measures the "roughness" or "complexity" of the path price takes to get from the beginning to the end of the period.
-
A smooth, directional, and trending market has a low degree of complexity. Its geometric path is relatively simple and direct.
-
A choppy, volatile, or sideways market has a high degree of complexity. Its path is jagged, erratic, and inefficient. The indicator calculates this geometric complexity and assigns it a numerical value known as the Fractal Dimension Index (FDI). A higher FDI signifies a more complex and chaotic market structure.
-
-
Calculating Momentum: The real predictive power comes from the second stage. The Fractal Momentum Analyzer calculates the rate of change, or momentum, of the Fractal Dimension Index itself. The value you see plotted on the chart is the difference between the current bar's FDI and the previous bar's FDI. This tells you whether the market is becoming more complex and chaotic, or simpler and more orderly.
How to Interpret the Signals
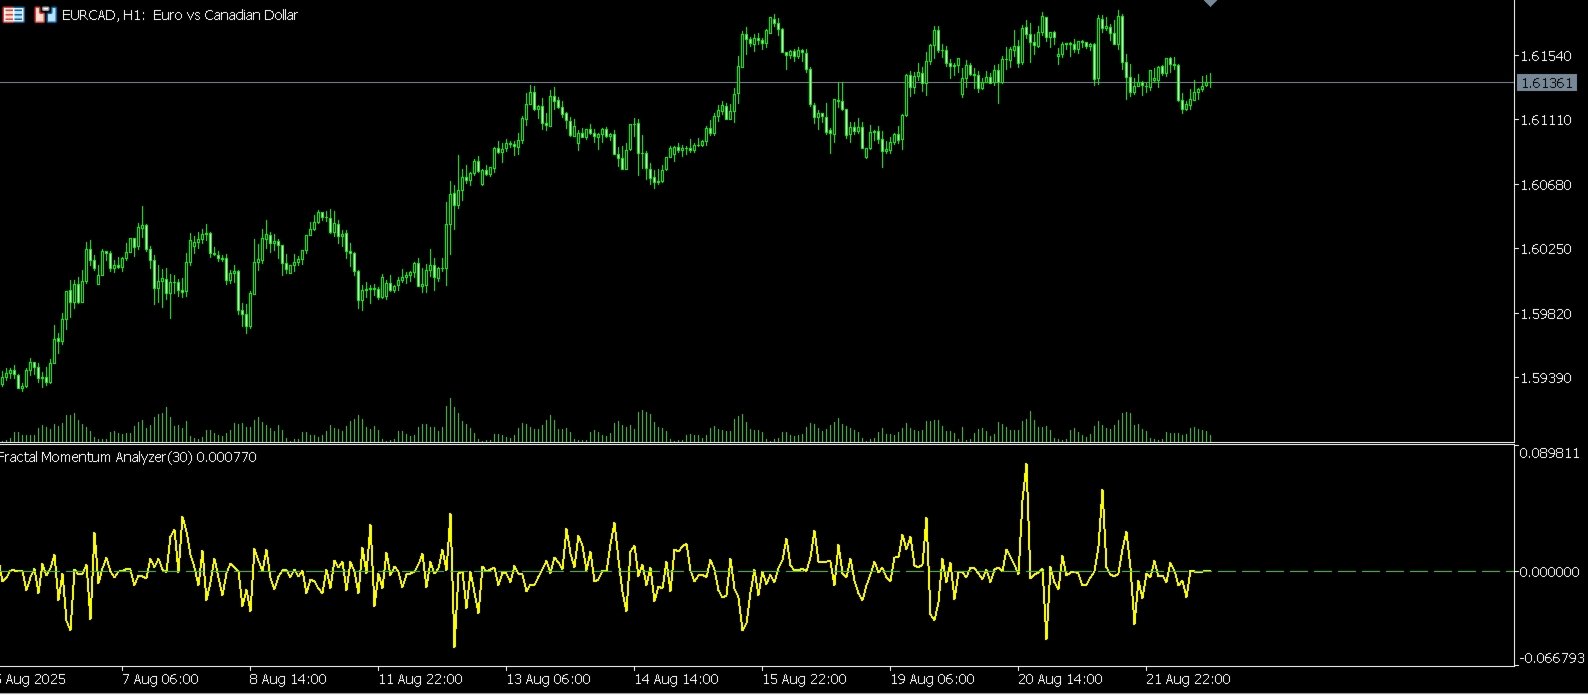
The Fractal Momentum Analyzer is displayed in a separate window as a single line oscillating around a central zero level.
-
Crossing Above Zero: When the indicator line crosses from negative to positive, it signals that the market's complexity is increasing. This is a powerful sign that the market is transitioning from a stable or trending phase into a more chaotic and volatile one. This can often precede strong breakouts as energy builds up.
-
Crossing Below Zero: When the indicator line crosses from positive to negative, it suggests the market's complexity is decreasing. The market is becoming more orderly and less chaotic. This can indicate that a volatile period is ending and a stable, directional trend is beginning to establish itself.
-
Divergence: Look for divergences between the indicator and the price. If the price is making new highs but the Fractal Momentum is failing to reach new peaks, it suggests that the underlying structural energy of the trend is weakening, potentially warning of an impending reversal.
Fully Customizable to Your Strategy
The Fractal Momentum Analyzer is designed for flexibility and can be adapted to any trading style or market.
-
Analysis Period: Adjust the lookback period to tune the indicator's sensitivity. A shorter period is ideal for scalping and identifying short-term volatility bursts, while a longer period is suited for swing and position traders focusing on larger market structure.
-
Price Source: Choose from seven different price sources ( Close , Open , High , Low , Median , Typical , Weighted ) to tailor the calculation to what you deem most important in your analysis.
Stop relying on lagging indicators that only tell you where the market has been. The Fractal Momentum Analyzer gives you a forward-looking perspective by measuring the very fabric of price movement. Add this professional-grade tool to your arsenal and start trading with a deeper understanding of market dynamics.