Ultimate Volatility Insight
- Indicators
-
Stanislav Konin
 I started my journey in Forex in 2017, and now I work in the stock market and futures.
I devote a lot of time to developing and testing effective trading systems. - Version: 1.1
- Updated: 2 June 2025
- Activations: 7
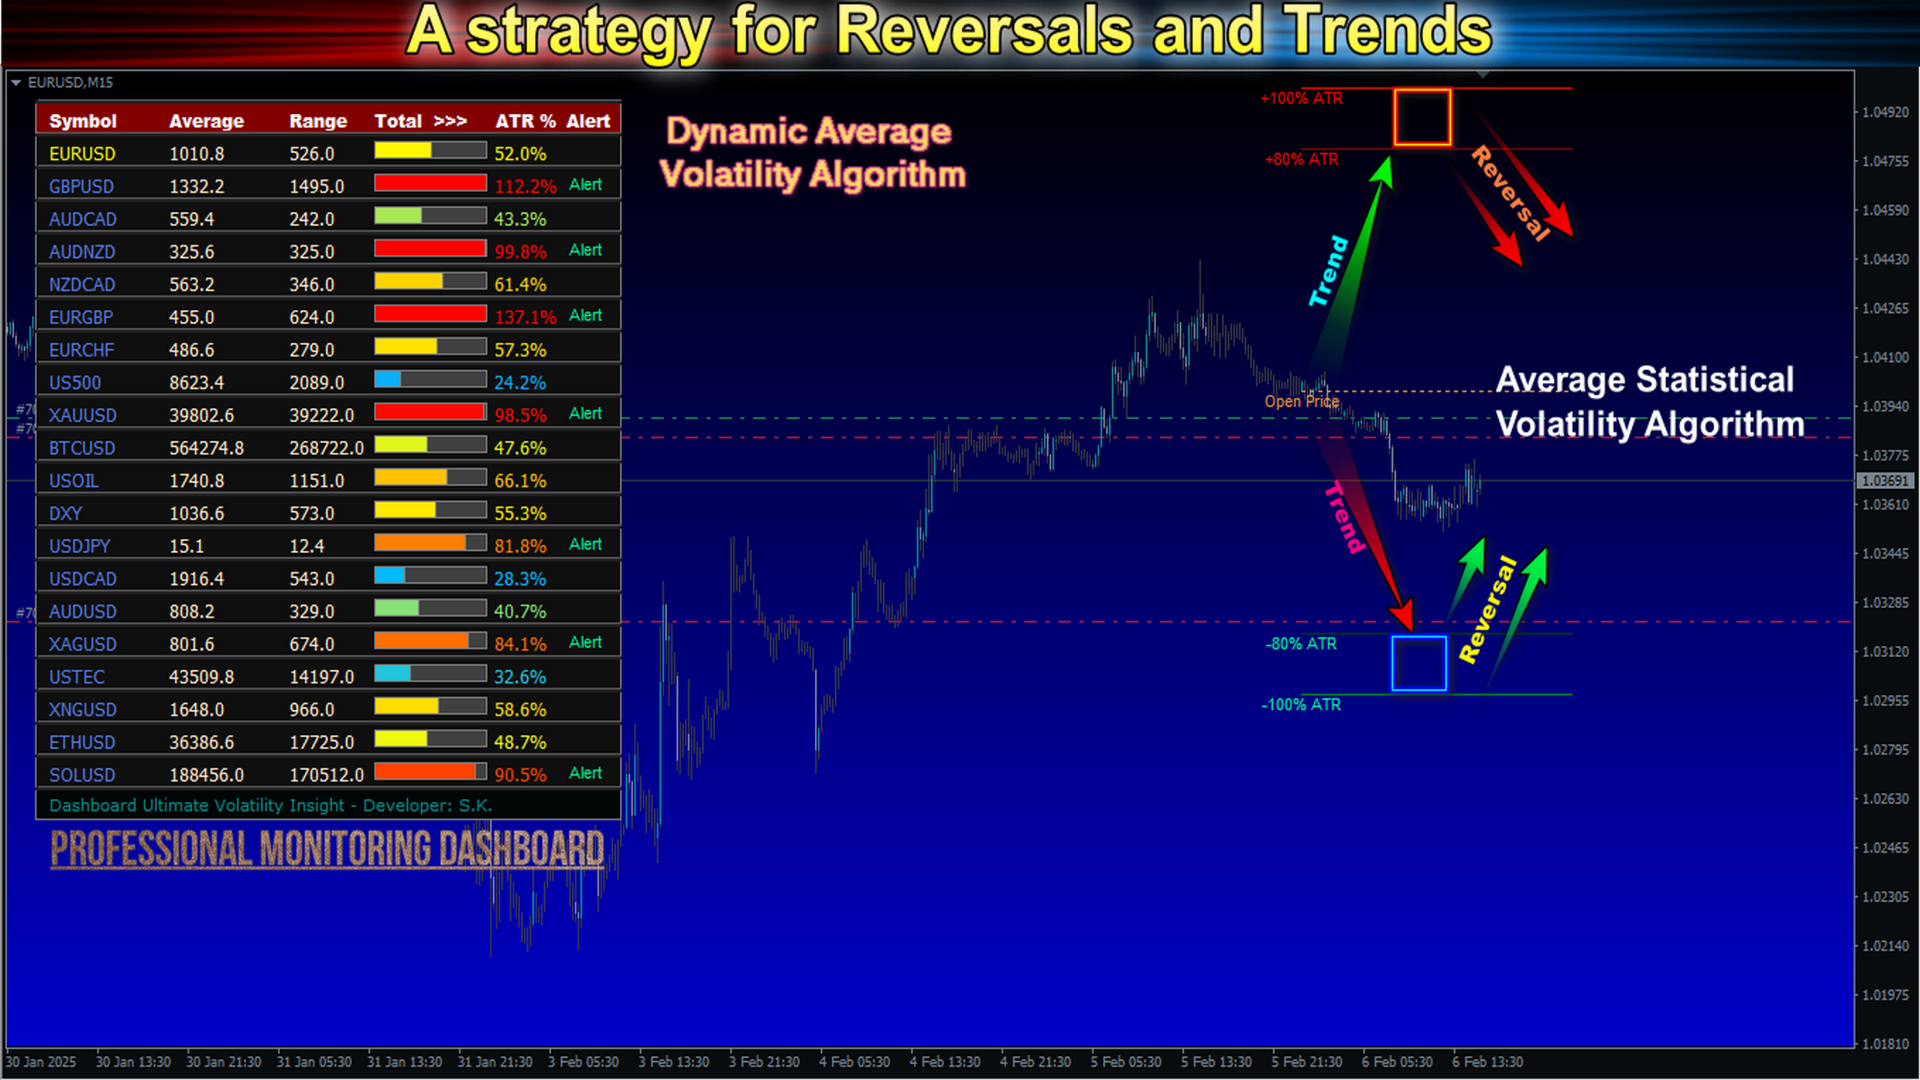
Ultimate Volatility Insight is a highly professional tool for analyzing and fully understanding market activity based on an advanced ATR with improved algorithms and calculation formulas. The indicator helps traders accurately assess market dynamics, identify key support and resistance levels, and effectively manage risks.
Ultimate Volatility Insight works only with real data using live statistics. The indicator has been developed for over two years, and its effectiveness has been proven through thousands of tests on real and demo accounts. This is an indicator that will turn you into a professional analyst!
Advantages:
The indicator has a number of advantages. Here are just a few of them:
-
High accuracy based on real market data.
-
Professional monitoring dashboard.
-
Real-time monitoring of multiple currency pairs in a single window.
-
Customizable selection of currency pairs.
-
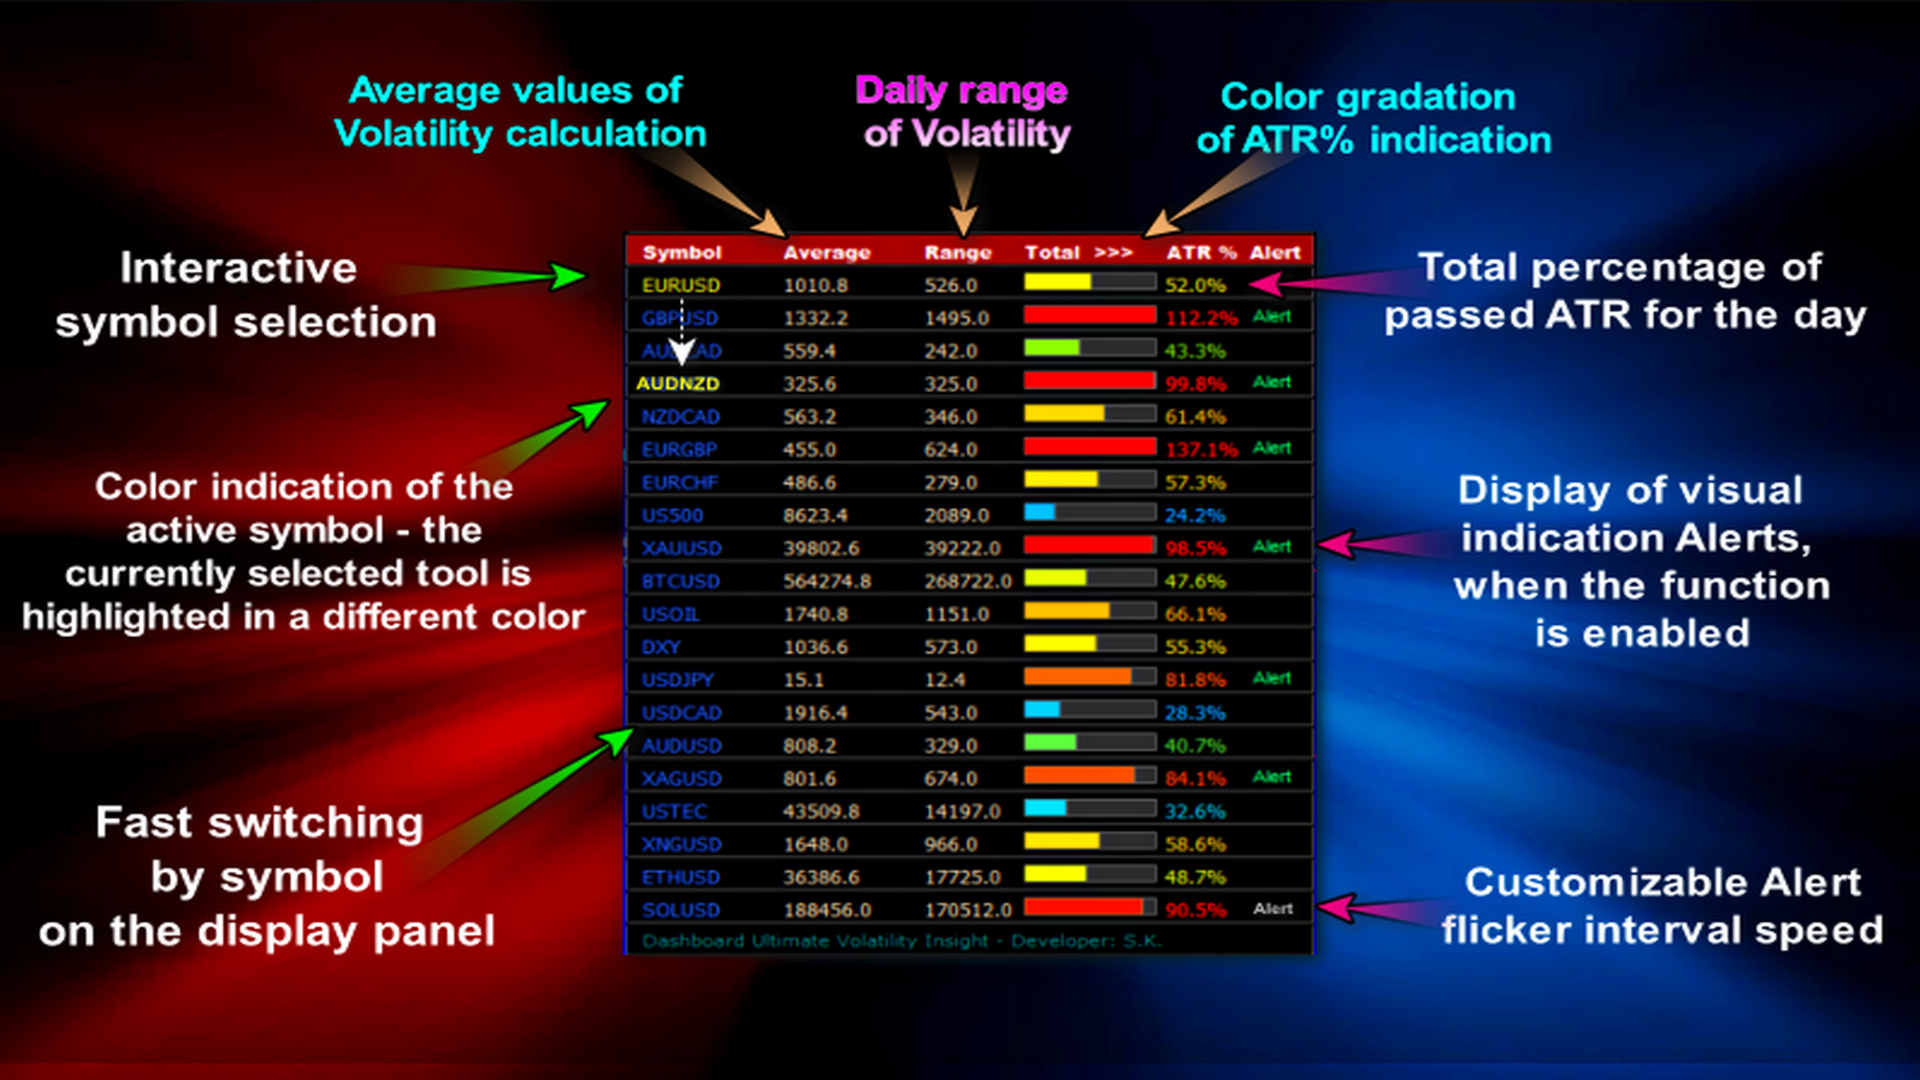
Interactive symbol selection.
-
Visualization of the percentage of ATR level achievement.
-
Visual alert indication – Alert Visual, displayed on the dashboard.
-
Automatic calculation of ATR levels 80-100%, used as target levels.
-
Flexible visual settings – colors, fonts, line styles.
-
Simple display of target levels directly on the chart.
-
Works with all instruments (Forex, Metals, CFD, Futures, Crypto).
-
Effective for determining Stop Loss and Take Profit levels.
-
Alerts available via smartphone, email, and MetaTrader notifications.
-
Easy to set up and install.
-
Suitable for both beginners and experienced traders.
Intelligent Visual Alerts
🚥 Color Gradation of ATR% Volatility Levels (from very low to very high).
🔋 Visual Alerts when critical levels are reached.
📣 Visual Alert Indication – 💡 Alert Visual – users can customize the alert label color and blinking speed in milliseconds ⏰ (Alert Blink Speed).
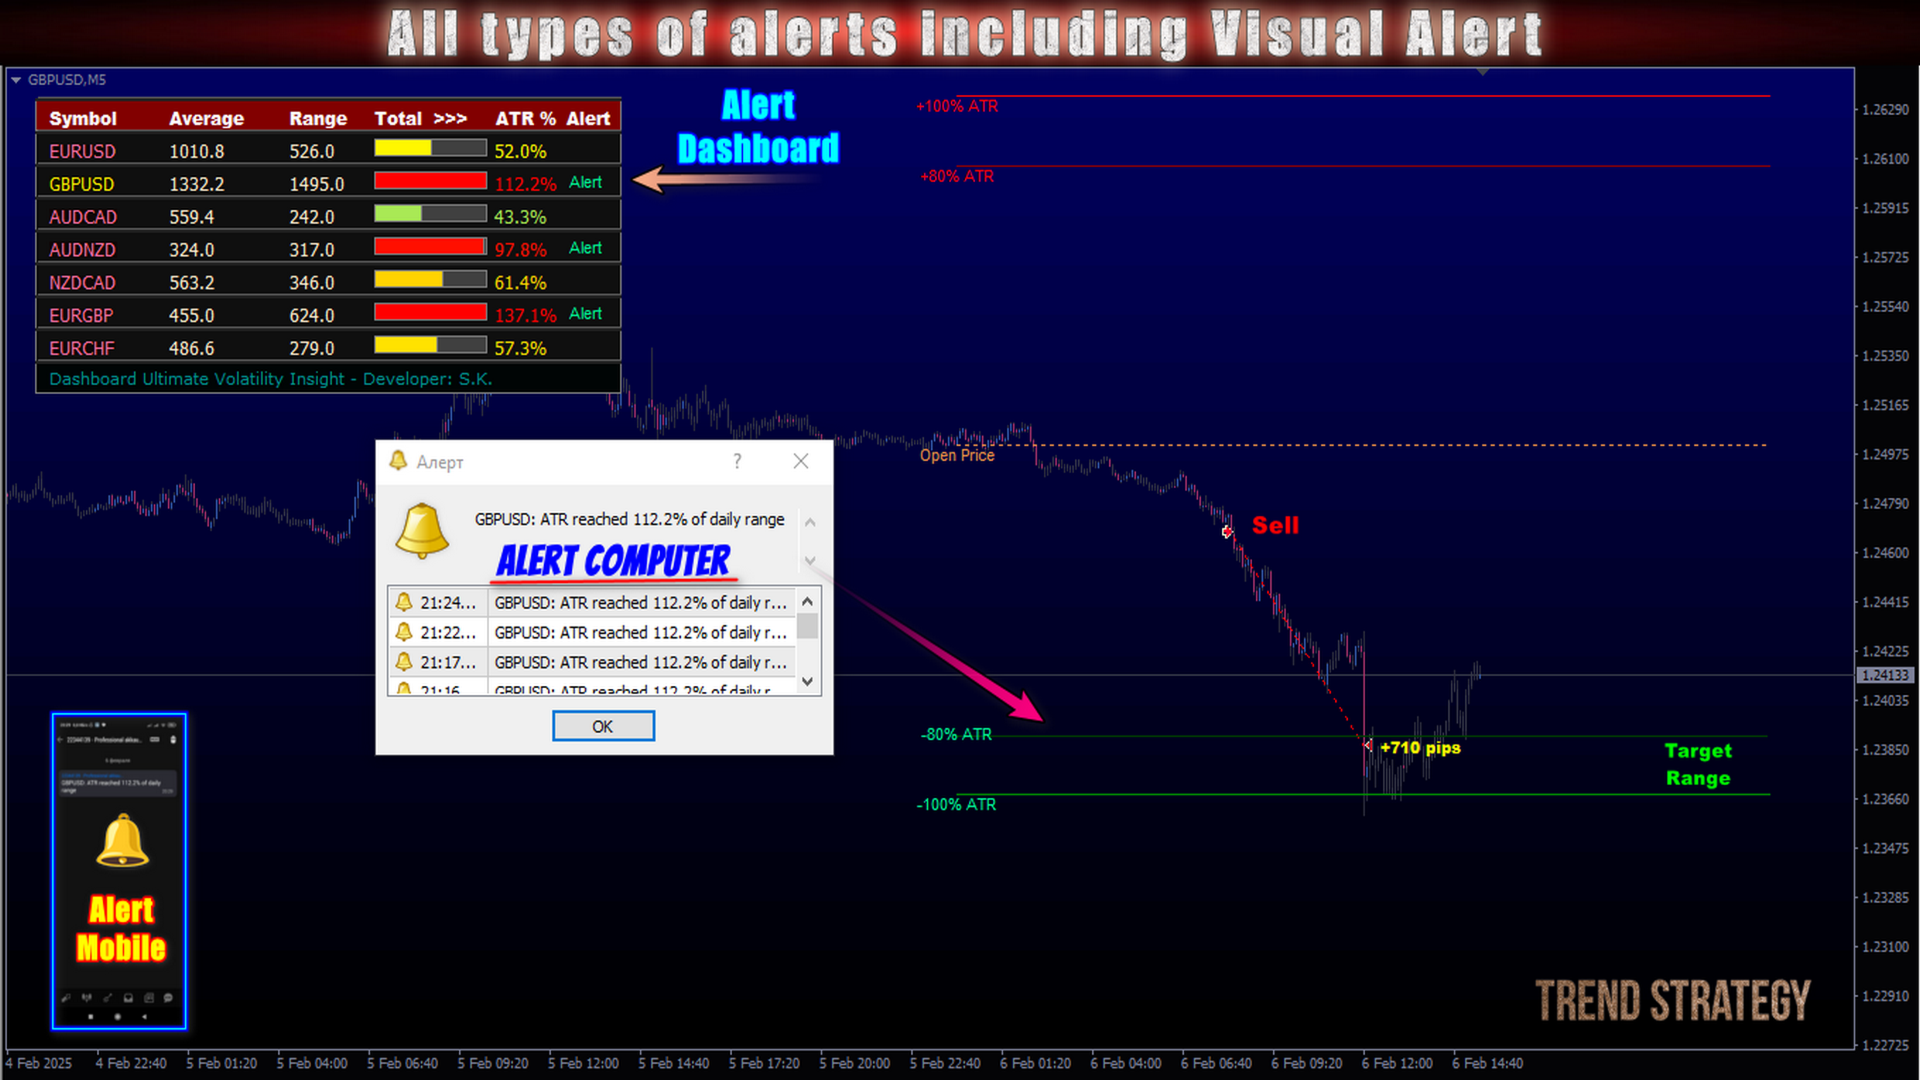
📢 Multiple alert types:
-
🔔 Pop-up notifications
-
🔔 Email alerts
-
🔔 Push notifications
-
🎵 Custom sound alert file selection
Additional Interactive Symbol Selection Features:
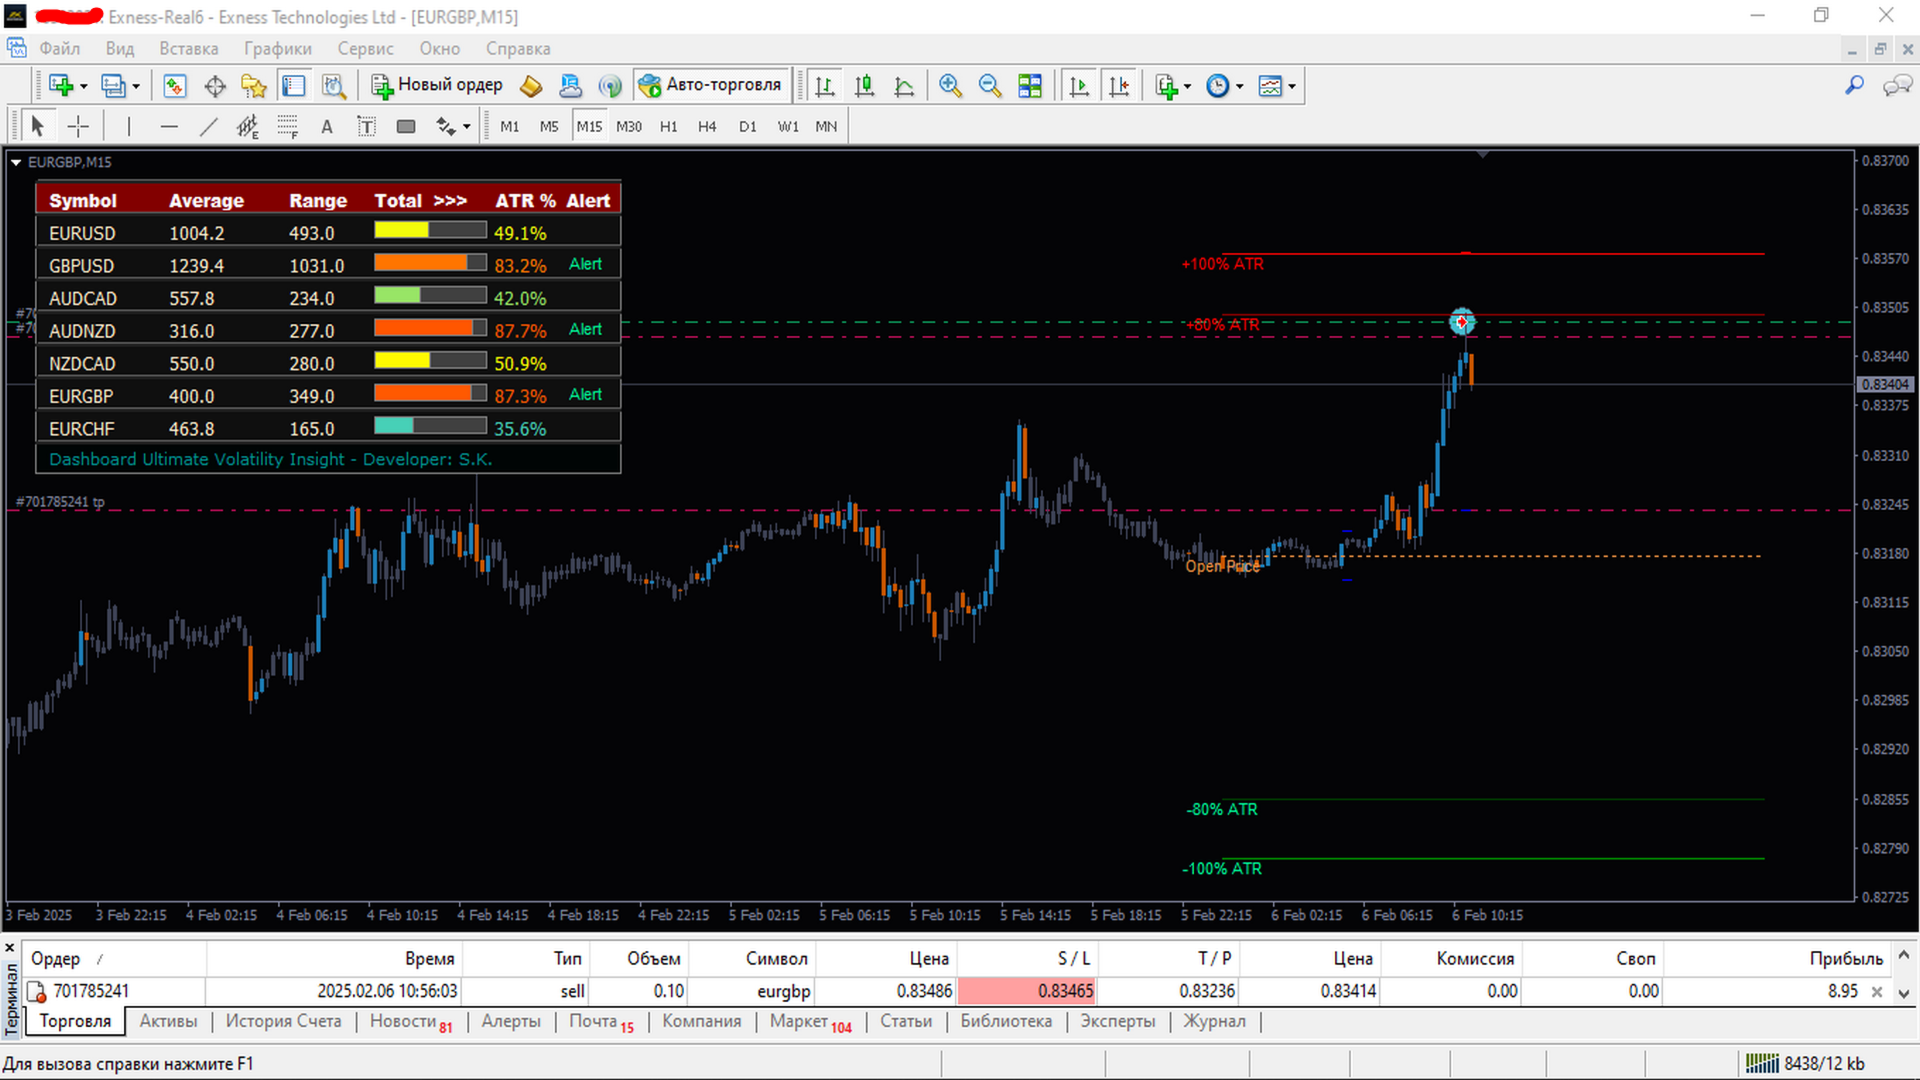
✅ Quick Switching – Clicking on a symbol in the indicator panel instantly loads it onto the chart.
✅ Selection of Multiple Instruments for Monitoring – Users can specify a list of active pairs.
✅ Color Indication of Active Symbol – The currently selected instrument is highlighted in a different color.
✅ Visual Alert Indication – Users can customize alert label color and blinking speed (Alert Blink Speed).
Algorithm Functionality:
Dynamic Algorithm – Data Displayed on the Panel: Utilizes proprietary development.
-
Improved ATR calculation with additional components for increased accuracy.
-
Uses the true range (high-low, high-prev Close, low-prev Close).
-
Accounts for continuous price movement, including gaps.
Thanks to the use of real data, the indicator achieves an overall ATR % accuracy of nearly 99%.
Statistical Level Calculation Algorithm: Uses mathematical calculations of average price movement over a specified period to assess market dynamics and identify key volatility levels.
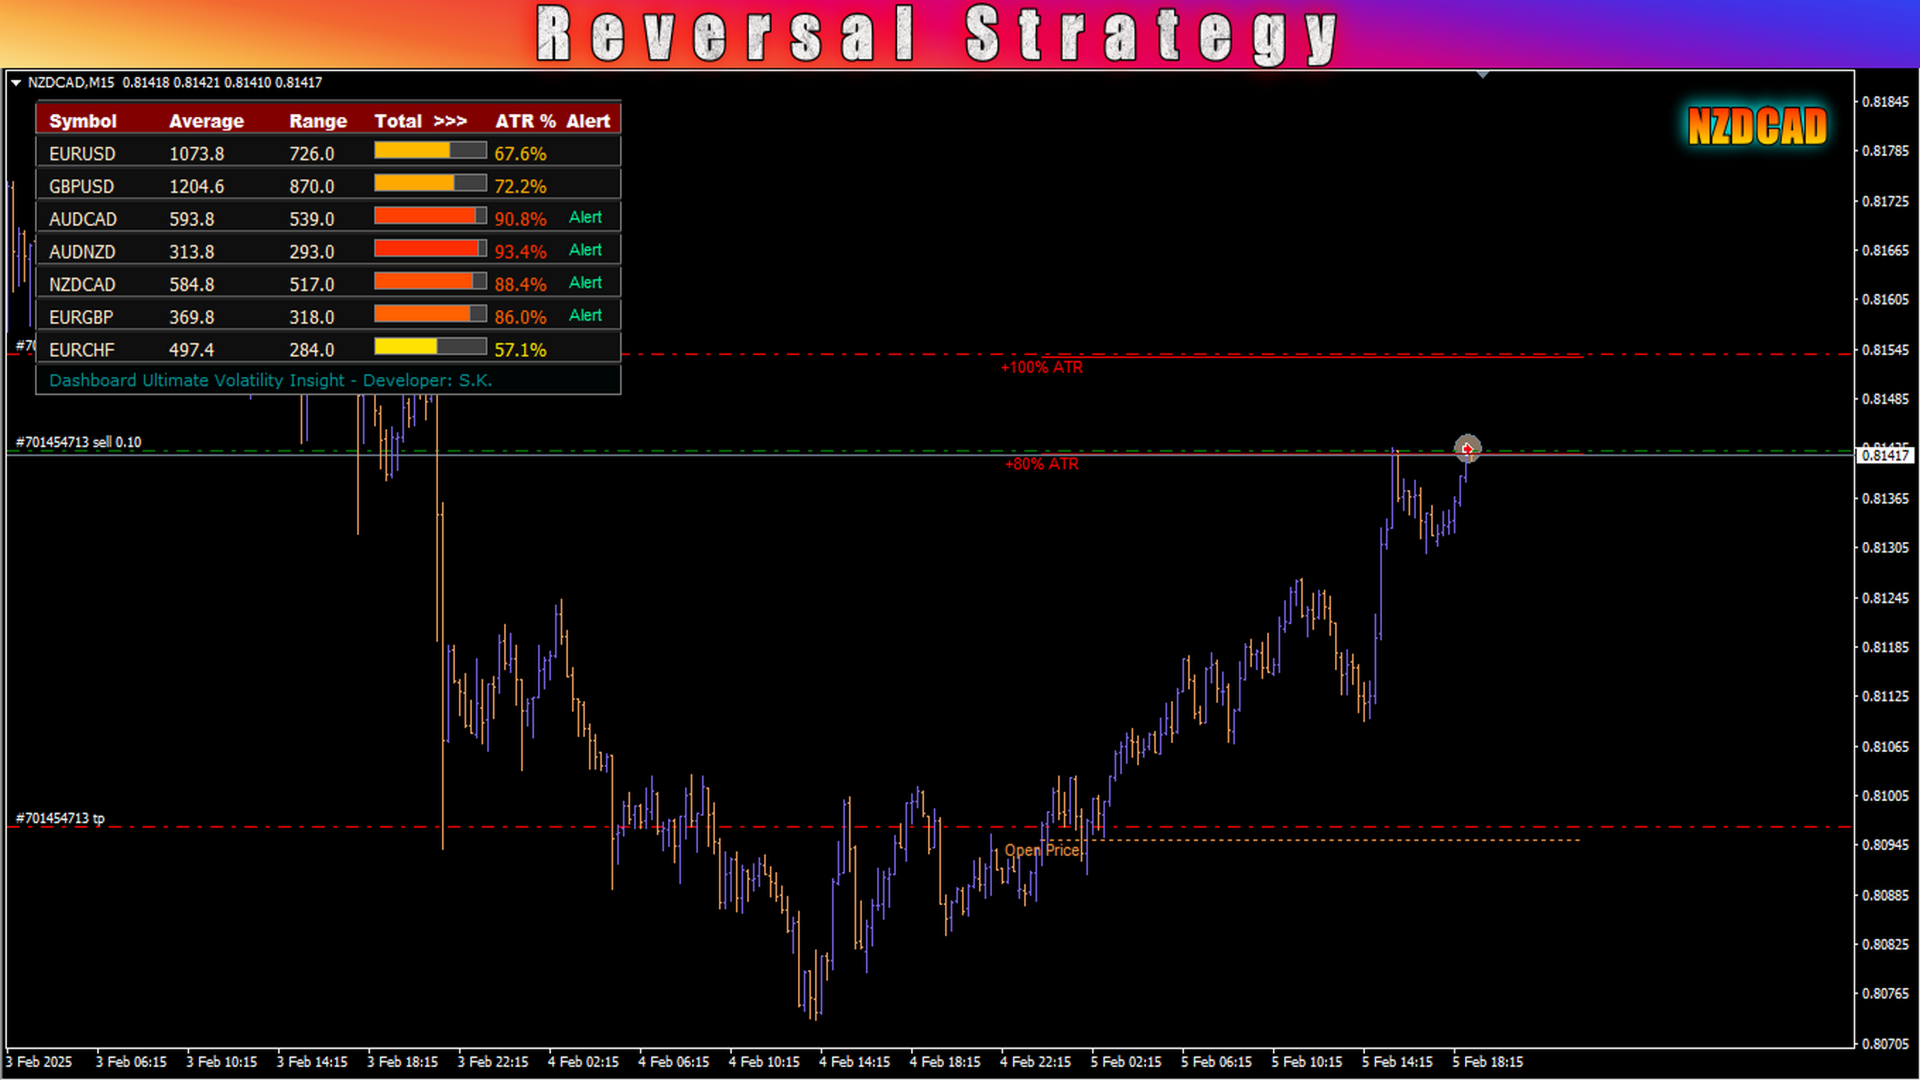
📍 80% ATR – A potential price reaction zone (correction, consolidation, or movement acceleration).
📍 100% ATR – The maximum average daily range, after which the probability of a reversal increases.
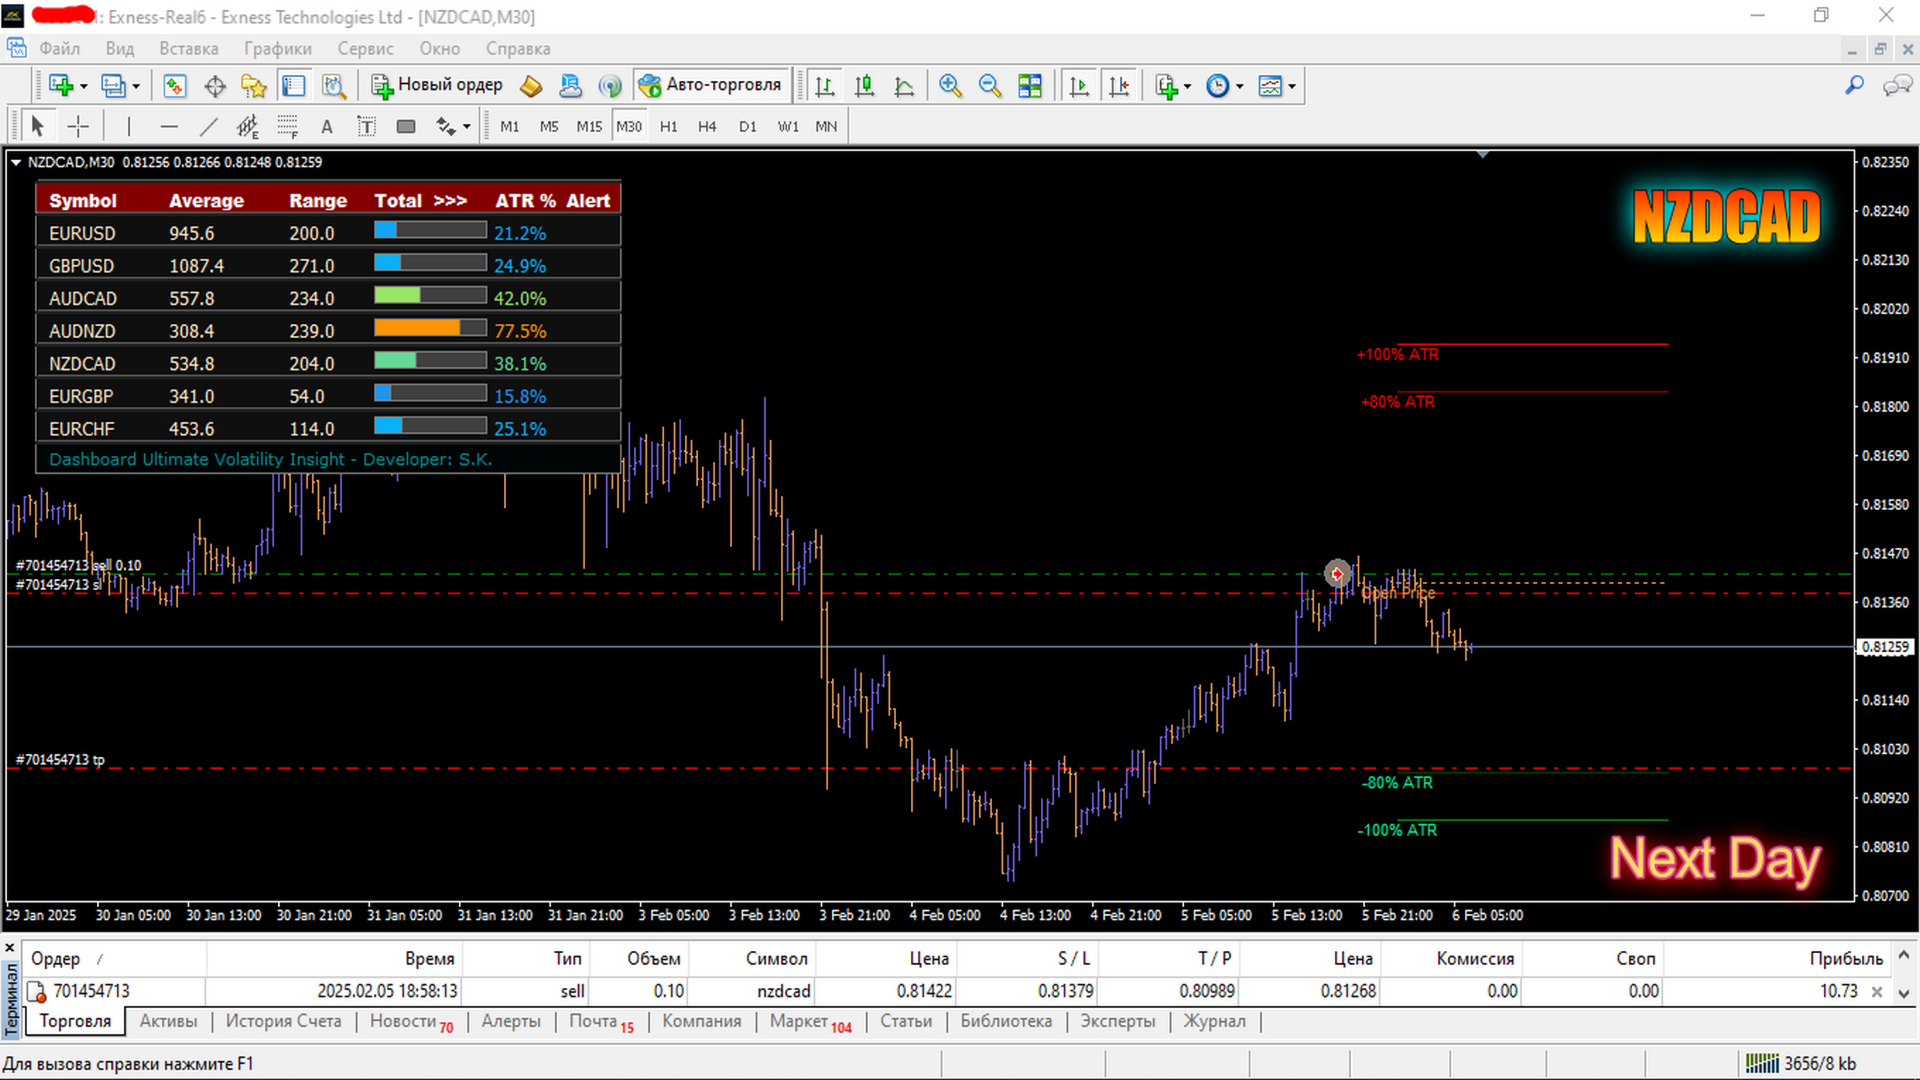
📍 Daily Open Line – Helps evaluate the current price movement relative to the day's opening level, providing a better understanding of the overall market context.
Statistical levels have a forecast accuracy of approximately 85-90%.
Overall Accuracy:
-
Cross-currency pairs: Accuracy 85-90%
-
Major currency pairs: Accuracy 80-85%
-
Cryptocurrencies: Accuracy 75-80%
Usage Recommendations:
Monitor the Overall ATR% level displayed in the dashboard, as the Dynamic Algorithm calculates volatility with the highest accuracy. If the price has not yet reached the 80-100% Statistical Levels, but the dashboard shows an excess of the Overall ATR%, this may indicate a possible partial position closure. The movement potential is not yet critical, but momentum is weakening, suggesting a potential reversal.
This is especially relevant for cross pairs such as (AUDCAD, NZDCAD, AUDNZD, EURGBP, and EURCHF), which have a strong tendency to return to their mean values.
For major pairs in a trend-following strategy, it is recommended to wait for at least a minimal touch of the 80% ATR Statistical Level before deciding on partial or full position closure. Look for reversal patterns and use them in conjunction with your trading system.
General Recommendations:
-
Recommended ATR calculation period: 3-5 days.
-
Use in combination with your trading system.
-
For trend strategies: Set Take Profit within designated levels and partially close positions when the Overall ATR exceeds 80%.
-
For mean-reversion strategies: Move to breakeven when the price returns 30-50% of the total ATR%.
-
Partially secure profits at the opening price levels.
-
Stop Loss should be placed beyond the ATR 100% levels.
Ultimate Volatility Insight is not just an indicator but a comprehensive analytical tool that will help you make well-informed trading decisions, minimize risks, and improve the efficiency of your strategy.
Take advantage of Ultimate Volatility Insight and gain control over market volatility today!
| Please contact me after purchase for recommendations. If you purchase Ultimate Volatility Insight you can get Reversal Zones Pro for free! Please contact me in private messages for more details. |