Orderflow Footprint

4
Asa Orderflow Footprint v3 — Product Description

Overview

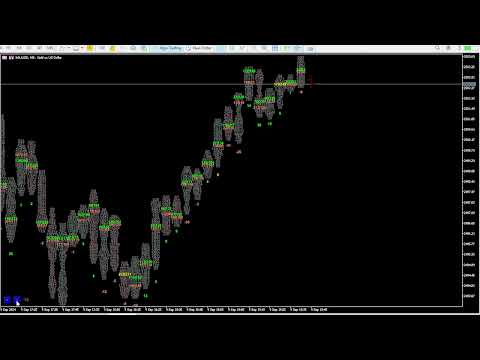
Asa Orderflow Footprint is a professional-grade footprint chart indicator for MetaTrader 5 that renders real-time Bid/Ask volume (or tick count) at every price level inside each candle. Built for serious order flow traders, it goes far beyond a basic footprint by adding POC migration analysis, a one-glance order-flow dashboard, stacked imbalance detection, absorption flags, and naked Point of Control (POC) lines — all inside the main chart window with no sub-window required.

Designed and tested on Gold (XAUUSD) feeds, the indicator uses a flag-based tick classification engine to separate buyer-initiated and seller-initiated activity on feeds that provide aggressor data, and falls back gracefully to pure volume-by-price analysis on feeds that do not (see Notes).

Key Features

📊 Footprint Chart (Bid | Ask per cell)

    Displays sell-side (Bid) and buy-side (Ask) volume side-by-side at every price bucket inside each candle
    Cell size is freely adjustable via on-chart < / > buttons — no need to re-open settings
    Choose between Tick Count mode (legacy) or Real Volume mode ( volume_real with fallback to volume )
    Fixed-grid price bucketing: cells never shift position while the forming bar is updating
    Point of Control (POC) automatically highlighted per candle

🧭 POC Migration (NEW)


    Tracks how each candle's POC shifts versus the previous bars — the cleanest read of where "value" is actually moving
    Measured across three configurable look-back windows (e.g. 3 / 5 / 15 bars)
    Instantly reveals a healthy trend (POC stepping up/down), a stall (POC flattening), or a divergence (price makes a new high/low while POC fails to follow)
    Works on any feed — based on volume-by-price, not delta

📋 Smart Dashboard (NEW)

    A single, glance-able panel that distils the whole order flow — see direction, conviction, and key levels in one look
    Bias headline — overall direction from short-weighted POC migration (configurable weights), color-coded UP / DOWN / RANGE
    Conviction meter — strong / medium / thin, driven by relative volume, so you know whether a move has real participation behind it
    POC Migration meter — 3 / 5 / 15-bar windows with selectable display: net steps, up-down counts, or percent
    POC trail sparkline — the last bars' POC drawn as a mini-profile to read migration shape at a glance
    Naked POC readout — nearest unfilled POC above and below price, with distance and a proximity highlight when price approaches
    Last-candle character — profile shape (P / b / balanced) and absorption state (buy / sell)
    Built-in scale controls — the < / > cell-size buttons are folded neatly into the panel
    Fully movable — place the dashboard in any chart corner with custom X / Y offset; auto-repositions on chart resize

🔴🟢 Imbalance &amp; Absorption Detection

    Absorption Candle — flags candles where the dominant side's POC is skewed, marked with a colored diamond above/below the bar (green = buy-side, salmon = sell-side)
    Stacked Diagonal Imbalance — highlights consecutive price levels where Ask dominates the Bid one cell lower (or vice versa) by a configurable ratio, colored in distinct Buy/Sell imbalance colors
    Imbalance stack length and ratio are fully configurable ( ImbRatio × ratio, ImbStack minimum rows)

📌 Naked POC Lines

    Automatically draws a horizontal line at each bar's Point of Control (highest combined Bid+Ask cell)
    Lines extend to the right and disappear automatically once a subsequent candle's range touches that price level
    Fully customizable color, style, and width — act as magnets and dynamic support/resistance

🎯 In-Candle POC Marker (NEW)


    Optional marker drawn at the exact POC price, centered inside each candle, so you can scan the whole migration staircase across the chart at a glance
    Configurable glyph/text, color, and font size

📋 Per-Candle Summary Line

    Optional one-line summary below each candle: B: [buys] S: [sells] T: [total] [delta%]
    Gives instant at-a-glance context without reading individual cells

🔔 Smart Alerts

    Popup and/or push notification alerts for:
        POC migration alignment — fires when the 3 / 5 / 15 windows all agree on direction (a strong-trend signal) (NEW)
        Imbalance / absorption candle detection
        Delta sign flip on the just-closed bar (on feeds with aggressor data)
    Alerts fire once per closed candle — no repeated spam on every tick

⚡ Performance Optimized

    Incremental redraw: only the forming candle (shift 0) is recalculated on each tick; all historical candles are drawn once per bar open
    Object reuse: chart objects are updated in-place rather than deleted and recreated, keeping CPU usage low even with 100+ candles displayed
    Heavy work (naked-POC scan, migration) runs on bar close; only relative volume and proximity update intratick

Input Parameters

Main
    ShowFootprint — Show/hide the footprint cell text
    ShowSummary — Show per-candle B/S/Total/Delta% summary line
    TPointScale — Initial cell size (in points); adjustable live with dashboard buttons
    CountMode — Cell value = tick count or real volume
    OFPercent — Absorption candle threshold (%)
    CountCandle — Number of candles to render (up to 100)
    FontSize — Cell text font size
    MBidColor / MAskColor — Highlight color for max Bid / max Ask cells
    sameColor — Color when max Bid and max Ask are on the same cell
    NormalColor / BlankDataColor — Colors for normal and empty cells

Imbalance
    ShowAbsorbCandle — Show absorption candle diamond markers
    ShowImbalance — Enable stacked diagonal imbalance highlight
    ImbRatio — Minimum Ask/Bid ratio to flag a diagonal imbalance cell
    ImbStack — Minimum consecutive imbalance cells required to highlight
    ImbBuyColor / ImbSellColor — Imbalance zone highlight colors

Alert
    AlertPopup / AlertPush — Enable popup / push notification alerts
    AlertOnImb / AlertOnFlip — Alert trigger: imbalance candle / delta flip

Naked POC lines

    ShowPOC — Show naked POC extension lines
    POCColor / POCStyle / POCWidth — POC line appearance settings

POC marker in candle
    ShowPOCInCandle — Show the centered in-candle POC marker
    POCInText — Marker glyph/text
    POCInColor — Marker color
    POCInFontSize — Marker font size

Dashboard
    ShowDashboard — Show/hide the order-flow dashboard
    DashCorner — Dashboard corner (any of the 4 corners)
    DashX / DashY — Dashboard offset from the corner (pixels)
    MigMode — Migration cell display: net steps / up-down / percent
    MigW1 / MigW2 / MigW3 — POC migration look-back windows (bars), default 3 / 5 / 15
    BiasWgt1 / BiasWgt2 / BiasWgt3 — Bias weighting per window (short-weighted by default, 3 / 2 / 1)
    RelVolPeriod — Relative-volume averaging period (bars)
    RelVolStrong / RelVolMedium — Relative-volume thresholds for strong / medium conviction
    ProximityPts — Distance (points) at which a naked POC counts as "near"
    AlertOnAlign — Alert when the 3 migration windows all align

How to Use

    Attach the indicator to any chart and timeframe (XAUUSD M1 recommended)
    Use the < > buttons in the dashboard footer to increase or decrease cell size until each bar shows a readable number of price rows
    Read the Dashboard first: the Bias headline gives direction + conviction; the 3 / 5 / 15 migration meter and POC trail show whether the trend is healthy, stalling, or diverging
    Trade with the migration — enter on pullbacks to a prior candle's POC or a naked POC level that holds; reversal-watch when migration stalls/diverges or an absorption diamond prints against the trend
    Watch the Naked POC readout for the nearest unfilled high-volume levels above/below — natural targets and reaction zones
    Watch for cyan highlighted zones (stacked buy imbalance) and magenta highlighted zones (stacked sell imbalance) as potential institutional order clusters
    Enable Alerts to get notified of migration alignment, imbalance/absorption candles, or delta flips without watching the screen

Notes & Requirements

    Requires a broker that provides tick history via CopyTicksRange() — most ECN/STP brokers on MT5 qualify
    Delta-based features (Delta %, delta-flip alert, and CVD where applicable) require a feed that flags ticks by aggressor side (Bid/Ask). Some accounts — common on certain CFD feeds — send combined Bid+Ask ticks, which makes Delta read ≈ 0. On those feeds, the indicator still works fully via its Volume-by-Price, POC, POC Migration, Naked POC, and Relative-Volume tools, which do not depend on aggressor data.
    Real Volume mode requires the broker to supply volume_real in tick data; the indicator automatically falls back to tick volume if unavailable
    Recommend running on M1 to H1 timeframes for meaningful order flow granularity
    Set CountCandle conservatively (30–50) on lower timeframes to keep chart objects manageable
    This is an analysis tool — it does not place trades, and no indicator guarantees profit. Always use proper risk management.

Reviews 1
Handy Abdel Aziz Oboulou
140
Handy Abdel Aziz Oboulou 2024.10.06 06:50 
 

Hello , i have bought your indicator but i cant use it properly because the data are not properly in line the same way as i can see it on your video datas frome previous candlestictk are mixed with data from the second candlestick even when i change the scale and this hapen no matter the TF i use , can you please share the seeting you used on your video ?? it could help a lot for your user :) plus , i see on your video , do you use your indicator on algotrading ?

Recommended products
Buy Sell Visual MTF
Naththapach Thanakulchayanan
This MT5 indicator, Bull Bear Visual MTF (21 Time Frames), summarize the strength color graphic and percentages of power for both  Bull and Bear in current market emotion stage which will show you in multi time frames and sum of the total Bull and Bear power strength which is an important information for traders especially you can see all Bull and Bear power in visualized graphic easily, Hope it will be helpful tool for you for making a good decision in trading.
An all‑in‑one trading assistant that blends AI candle synthesis with a 15‑pattern Heat Map, ATR‑scaled S/R & pivots, and a Vigilant risk monitor (LOC/TF/SR/PAT gates, Ready%, EM points, SR‑distance bar). The Opportunity Advisor adds ETAs, checklists and gate status; Multi‑TF Confluence confirms alignment from M1–D1. The Professional Trade Suggestion panel shows regime, session filter, R:R presets, Partials and Quality Pause. Clean, readable UI with one‑click S/R toggles, scanners and a built‑in,
MFOP Market Forecast
Oscar Josue Pin Bacuzoy
Develop this indicator for periods of 30 minutes or more, focus on getting market trends right and making sure they are met. MFOP v8.1 gets straight to the point: it scans the market and tells you exactly when there is enough strength to enter a trade. This indicator doesn't do magic, it uses mathematical algorithms to filter out market noise, not enter into false breakouts and show you clear BUY (blue arrow) and SELL (red arrow) opportunities. It is designed and optimized specifically to take
Pull It Back MT5
Salvatore Caligiuri
PROMOTIONAL PERIOD - ONLY 2 COPIES LEFT OF FIRST 10 BUYERS AT PRICE 300,00$!!! CHECK SCREENSHOTS AND COMMENTS FOR OUR STRATEGY RULES AND LIVE TRADES SIGNALS PULL IT BACK  is a revolutionary trading system and a complete strategy with advanced algorithm developed to detect the trend direction after a  PULLBACK , a  RETREACEMENT  or a  KEY LEVEL BOUNCE . The goal of this indicator is to get as many pips as possible from market trend. Following strictly the rules of the strategy, you can become a
Hydra Trend Rider is a non-repainting, multi-timeframe trend indicator that delivers precise buy/sell signals and real-time alerts for high-probability trade setups. With its color-coded trend line, customizable dashboard, and mobile notifications, it's perfect for traders seeking clarity, confidence, and consistency in trend trading. Setup & Guide:  Download  MT4 Version here. To learn how to use the Indicator: Indicator Manual & Guide -   Read Here Follow our MQL5 channel for daily market ins
Footprint MT5
Mahmoud Ahmed Abdou Ali
Footprint charts in MetaTrader 5 (MT5) provide traders with a detailed view of market activity, allowing for better analysis of price movements and trading decisions. What is a Footprint Chart? A footprint chart is a specialized visualization tool that displays market data beyond traditional candlestick or bar charts. It reveals how volume was distributed at each price level within a specific time frame, often segmented by bid and ask activity. This level of detail helps traders understand the
RSIScalperPro
PATRICK WENNING
Introducing RSIScalperPro - the revolutionary RSI-based indicator for Metatrader 5, specifically designed for scalping in the one-minute chart. With RSIScalperPro, you'll have a powerful toolkit for precise entry and exit signals to take your trading to the next level. RSIScalperPro utilizes two different RSI indicators that provide clear signals for overbought and oversold areas. You can customize the time periods and limit values of the two RSIs according to your preferences to achieve the be
Phase Accumulation Adaptive Market Mode
Mahmoud Helmy Sedik Mohamed Mansour
Phase accumulation adaptive bandpass filter MT5 Indicator is a Metatrader 5 (MT5) indicator and the essence of this technical indicator is to transform the accumulated history data. Phase accumulation adaptive bandpass filter MT5 Indicator provides for an opportunity to detect various peculiarities and patterns in price dynamics which are invisible to the naked eye. Based on this information, traders can assume further price movement and adjust their strategy accordingly.
SMG Guard Pro
Tanawut Wongmanee
Smart Money Guardian The Ultimate Trade Manager & Equity Protection Expert Transform your manual trading with professional-grade discipline. Smart Money Guardian is not just a tool; it is your "Digital CEO" that manages every trade with mathematical precision, protecting your capital from emotional decisions and unexpected market volatility. ️ Why Choose Smart Money Guardian? Most manual traders fail due to a lack of exit discipline and poor risk management. This EA solves that by automating
If you are unsure how to use this indicator, please feel free to reach out to me. I will explain it to you and provide reading materials to help you make the most of it. TD Sequential Scanner: An Overview The TD Sequential scanner is a powerful technical analysis tool designed to identify potential price exhaustion points and trend reversals in financial markets. Developed by Tom DeMark, this method is widely used by traders to gauge market cycles and potential turning points with precision. Ho
Forex Volumes
Marco Montemari
Forex is the most liquid market in the world. For this reason real volumes are not available. Some indicators use the number of ticks, in other cases the broker can supply volumes informations but they will be only data about that broker. Volumes are important becase they will form the price and volatility of the market. Using an algorithm this indicator can give you a very good approximation of the volumes for each candle. How to read the indicators? This version provides you many visualizati
ShortBS是一个很好的短线交易指示器,能很好与 BestPointOfInitiation ( https://www.mql5.com/zh/market/product/96671 )配合,能让你找到最合适的buy和sell位置,指标不含有未来函数,不会重新绘制。是一个针对(如果你感觉到这个指标能够帮助你进行更准确的交易,请帮忙给个好评,希望我的作品能够帮助更多有需要的人) ===================参数列表===================== maPeriod: 25 slowPeriod:20 fastPeriod:10 stepPeriod:5 =================参考使用方法=================== 此指标可以适用于任何交易品种,能够用在任何周期。
A complex of indicators of recognizing reversal moments. Detects the peaks and hollows according to the combinations of candles after they deduct from two MA. Applicable for trading systems when using early inputs. You can use a trend for scalping and intraday trade, and for detecting a trend in the early stages. Possibilities The parameters provide flexible settings for any time floms and trading tools. There are several types of warning for signals. Yellow arrow - Sell signal , pink arrow -
Elliott Wave Pro
Timothy Chuma Ifiora
Elliot Wave Pro is an MT5 indicator that automatically detects Elliott Wave structures (impulse and corrective behavior) and calculates key Fibonacci-based retracement/limit levels from the most recent completed wave. It helps turn wave structure into a tradable setup: enter on the pullback, target Wave 1 , and place your stop beyond the wave high / invalidation level . That gives you a clear risk-to-reward model where a single valid setup can outweigh multiple small losses. In short, it shows w
Samurai sun
Saiful Izham Bin Hassan
Samurai Sun is an advanced algorithmic trading system designed for modern forex and precious metals markets. It combines a robust trend-following engine with dynamic, institutional-grade risk management. The system is engineered to protect capital while maximizing trend capture through adaptive trailing stops and partial close mechanics. The Expert Advisor uses a combination of Moving Averages, RSI, and MACD to filter market noise and identify high-probability entry points. It operates fully aut
AlgoKing Chandelier Exit Indicator (MT5) The Chandelier Exit Indicator is a volatility based indicator that maximizes returns using the Average True Range (ATR) value and the highest high or lowest low of a period. Benefits Should be used as a trailing stop. Helps you exit a position when you have a respectable profit. Identifies a high probability of a trend reversal when the price moves against the prevailing trend by a distance equal to 3x the average volatility. Join the AlgoKing Lightning
XAU ZENITH GRID PROTOCOL     Institutional Averaging Engine & Basket Recovery Protocol    Xau Zenith Grid Protocol represents the pinnacle of institutional-grade automated trading software. Fusing the concept of **dynamic grid-based averaging** (inspired by AnE Gold Grid) with our proprietary **Basket Take-Profit Engine** and **Aegis Drawdown Armor**, this robot is built exclusively for XAUUSD (Gold).  By tracking extreme overbought and oversold market conditions on the M15 timeframe, the EA s
Unveil the Hidden Institutional Order Flow with AI-Powered Clustering. Most retail traders lose money because they trade based on empty price action and imaginary support/resistance lines. Titan AI: Volume Cluster Sniper changes the game entirely. Powered by a sophisticated K-Means Machine Learning Algorithm , this premium tool scans the historical price memory and real tick volume to reveal exactly where "Smart Money" is accumulating or distributing their positions. How the AI Engine Works:
Vwap Institutional Pro
Jehisson Jaime Navajas Quintero
Take your trading to the institutional level with Vwap Institutional Pro. This high-performance dashboard is designed specifically for Scalpers and Day Traders who demand precision on fast-moving indices like NAS100 (Nasdaq) and US30 (Dow Jones) , as well as Major Forex pairs. Why choose Vwap Institutional Pro? Unlike standard indicators that clutter your chart, this tool offers an interactive Multi-Timeframe Dashboard . Toggle between 7 different VWAP periods with a single click, allowing you t
Sigma VWAP Bands Sigma VWAP Bands (Rolling) is a technical analysis indicator that plots upper and lower bands based on the statistical deviation of price from a rolling Volume-Weighted Average Price (VWAP). The indicator is designed to visualize price dispersion around VWAP using a user-defined lookback window and a configurable standard deviation multiplier. Parameters Lookback Period Number of bars used for VWAP and standard deviation calculations. Sigma Factor Multiplier applied to the cal
Institutional Tick Engine Pro: Tick Velocity & Heatmap Analysis Institutional Tick Engine Pro is a technical analysis suite designed to process raw Tick Data directly from the broker. It synthesizes Order Flow metrics including Velocity, Heatmaps, and Micro-Structure patterns without requiring Level 2 (DOM) data feeds. The tool analyzes the speed and aggression of price movements, allowing traders to distinguish between slow price drifts and high-momentum impulses. Key Features 1. Tick Velocity
BreakoutMatrix Pro
Nadjib Amari
5 (2)
BreakoutMatrix Pro — Institutional-Grade Breakout System BreakoutMatrix Pro is an automated, institutional-grade breakout trading system designed to capitalize on market momentum. While it is highly optimized as a Gold (XAU/USD) trading machine, its universal architecture allows it to adapt to any major symbol. Forget endless optimization. The core strategy relies on a single master input: The Volatility Scale Factor . Backtest Highlights (Jan 2025 – March 2026) - XAUUSD 1H - Screenshots atta
Volatility zone
Slobodan Manovski
ATR Volatility Zones Indicator Multi-Level Volatility Measurement Tool with Visual Alerts This advanced indicator analyzes market volatility using Average True Range (ATR) to identify five distinct volatility zones, helping traders adapt their strategies to current market conditions. Key Features: 5-Zone Volatility Classification - Precisely identifies: • LOW (Cyan) • MEDIUM-LOW (Lime Green) • MEDIUM (Yellow) • HIGH-MEDIUM (Orange) • HIGH (Red) Smart Dynamic Ranges - Automatically adjust
SMC Market Blueprint
Alex Amuyunzu Raymond
SMC Market Blueprint Institutional Market Structure Analyzer Based on Smart Money and ICT Concepts Overview SMC Market Blueprint is a comprehensive institutional-grade indicator designed to decode the true structure of the market using Smart Money Concepts (SMC) and ICT (Inner Circle Trader) methodology. It maps the internal market framework — identifying structure shifts, liquidity zones, and order flow transitions across multiple timeframes — giving traders a clear blueprint of how institution
Ultimate Double Top & Bottom (Pro Volume Matrix) Stop trading retail breakouts. Start trading Institutional Traps. The   Ultimate Double Top & Bottom   is not a standard, lagging pattern scanner. It is a highly advanced, non-repainting structural engine equipped with a proprietary   3-Leg Volume Matrix . Designed exclusively for Smart Money Concepts (SMC) and order flow traders, this indicator mathematically dissects the tick volume inside M and W patterns to reveal true institutional intent:  
One Man Army Pro
Steven David Macswayne
Thank you for checking out One Man Army Pro USE THE DEMO FEATURE - Start with $10000 with 0.02 lots on any pair and any time frame and watch the profit come in. **PAIRS**      Look for ranging pairs Such as USD Pairs **Timeframe**   15 m (Recommended) **Lots**       0.05 for every $ 1000 in your account **LIVE SIGNAL COMING SOON** Come trade with us: https://discord.gg/KrZ8rqWEJ5 Variables: (See Screenshots for a recommended settings)  Mode_Of_Strategy: Use only Strategy_4 – This is the lat
Algo octa
Firas Al-qasimi
Algo Octa - Indicateur d'Analyse Technique Avancé Indicateur professionnel combinant ZigZag, SAR parabolique, canaux de tendance et niveaux de Fibonacci pour une analyse technique complète.  if you don't understand how to use Technical Support via product feedback or MQL5 messaging system.  Fonctionnalités Principales Analyse Multi-Composants  ZigZag coloré avec détection automatique des extremums  Intégration du SAR parabolique pour la confirmation de tendance  Création automatique de canau
Epic Sails PRO is a clean, session-anchored VWAP indicator designed to provide a clear institutional price framework — not trade signals. It plots a stable VWAP with non-overlapping volatility bands and a real-time VWAP angle (in degrees) to help traders assess directional bias, slope strength, and market state. This tool is ideal for traders who prefer structure, context, and mechanical confirmation over subjective indicators. Key Features Session-anchored VWAP (resets at user-defined session s
Trading Vision Ex
Vitalii Zakharuk
Product Description: Trading Vision – Automated Assistant for Forex Traders Introduction In today's financial markets, automating Forex trading is not just desirable but essential for success. The primary goal of automated trading systems like Trading Vision is to simplify the trading process by implementing advanced algorithms to analyze market trends. This allows traders to focus on strategic thinking while leaving routine operations to technology. What is Trading Vision? Trading Vision is a p
Veda Trend Hunter
Sachin Kumar Singh
Veda Trend Hunter EA — Intelligent XAUUSD Expert Advisor Ancient Wisdom. Modern Precision. Institutional-Grade Gold Trading. XAUUSD · M15 99% History Quality Sharpe Ratio: 5.11 72.73% Win Rate Parabolic SAR Trailing Smart Money Management +1,975% on $250 Deposit Veda Trend Hunter EA   is a fully automated MetaTrader 5 Expert Advisor engineered exclusively for   XAUUSD (Gold/USD)   on the M15 timeframe. Combining a proprietary multi-signal entry system — built on Moving Average trend directio
Buyers of this product also purchase
Neuro Poseidon MT5
Daria Rezueva
4.94 (17)
Neuro Poseidon is a new indicator by Daria Rezueva. It combines precise trading signals with adaptive TP/SL levels - creating best possible trades as a result! Message me and get  Neuro Poseidon Assistant  as a gift to automize your trading process! What makes it stand out? 1. Proven profitability on all assets and timeframes 2. Only confirmed BUY and SELL signals present on the chart 3. Adaptive TP & SL levels generated by the software for each trade 4. Easy to understand - suitable for al
Divergence Bomber
Ihor Otkydach
4.9 (89)
Each buyer of this indicator also receives the following for free: The custom utility "Bomber Utility", which automatically manages every trade, sets Stop Loss and Take Profit levels, and closes trades according to the rules of this strategy Set files for configuring the indicator for various assets Set files for configuring Bomber Utility in the following modes: "Minimum Risk", "Balanced Risk", and "Wait-and-See Strategy" A step-by-step video manual to help you quickly install, configure, and s
SignalTech MT5 is an unique fully rule based trading system for EURUSD, USDCHF, USDJPY, AUDUSD, NZDUSD, EURJPY, AUDJPY, NZDJPY, CADJPY.  All the winning trades with chart setups are published on the comments page. 2026-05 4107 Pips (Until 05-29 NY Closed) 2026-04 2243 Pips 2026-03 2165 Pips 2026-02 2937 Pips 2026-01 2624 Pips 2025-12 1174 Pips It can generate signals with Buy/Sell Arrows and Pop-Up/Sound Alerts. Each signal has clear Entry and Stop Loss levels, which should be automatically flag
Introducing   Quantum Breakout PRO , the groundbreaking MQL5 Indicator that's transforming the way you trade Breakout Zones! Developed by a team of experienced traders with trading experience of over 13 years,   Quantum Breakout PRO   is designed to propel your trading journey to new heights with its innovative and dynamic breakout zone strategy. Quantum Breakout Indicator will give you signal arrows on breakout zones with 5 profit target zones and stop loss suggestion based on the breakout b
Quantum TrendPulse
Bogdan Ion Puscasu
5 (25)
Introducing Quantum TrendPulse , the ultimate trading tool that combines the power of SuperTrend , RSI , and Stochastic into one comprehensive indicator to maximize your trading potential. Designed for traders who seek precision and efficiency, this indicator helps you identify market trends, momentum shifts, and optimal entry and exit points with confidence. Key Features: SuperTrend Integration: Easily follow the prevailing market trend and ride the wave of profitability. RSI Precision: Detect
Azimuth Pro
Ottaviano De Cicco
5 (7)
Azimuth Pro V2: Synthetic Fractal Structure and Confirmed Entries for MT5 Overview Azimuth Pro is a multi-level swing structure indicator by Merkava Labs . Four nested swing layers, swing-anchored VWAP, ABC pattern detection, three-timeframe structural filtering, and closed-bar confirmed entries — one chart, one workflow from micro-swings to macro-cycles. This is not a blind signal product. It is a structure-first workflow for traders who care about location, context, and timing. V2 Launch Offe
M30/H1/H4 Swing Version Available Want to catch the big moves that M5/M15 can't reach? Gold Signal Swing Pro (M30/H1/H4) is now available. Target $20-$80+ per trade. https://www.mql5.com/en/market/product/177643 KURAMA GOLD SIGNAL PRO (MT5) — 7-Layer Filter XAUUSD Complete Trading System No repaint. No redraw. No lag. Every signal stays fixed once confirmed. Buyer bonus: Anyone who purchases the buy-out license gets AI Zone Radar ($59 value) + PDF m
RelicusRoad Pro MT5
Relicus LLC
4.96 (24)
RelicusRoad Pro: Quantitative Market Operating System 70% OFF LIFETIME ACCESS (LIMITED TIME) - JOIN 2,000+ TRADERS Why do most traders fail even with "perfect" indicators? Because they trade Single Concepts in a vacuum. A signal without context is a gamble. To win consistently, you need CONFLUENCE . RelicusRoad Pro is not a simple arrow indicator. It is a complete Quantitative Market Ecosystem . It maps the "Fair Value Road" price travels on, distinguishing between random noise and true structur
ARIPoint
Temirlan Kdyrkhan
1 (1)
ARIPoint is a powerful trading companion designed to generate high-probability entry signals with dynamic TP/SL/DP levels based on volatility. Built-in performance tracking shows win/loss stats, PP1/PP2 hits, and success rates all updated live. Key Features: Buy/Sell signals with adaptive volatility bands Real-time TP/SL/DP levels based on ATR Built-in MA Filter with optional ATR/StdDev volatility Performance stats panel (Success, Profit/Loss, PP1/PP2) Alerts via popup, sound, push, or email Cu
Trend Forecaster
Alexey Minkov
5 (7)
Trend Forecaster – Since 2023. The Trend Forecaster indicator utilizes a unique proprietary algorithm to determine entry points for a breakout trading strategy. The indicator identifies price clusters, analyzes price movement near levels, and provides a signal when the price breaks through a level. The Trend Forecaster indicator is suitable for all financial assets, including currencies (Forex), metals, stocks, indices, and cryptocurrencies. You can also adjust the indicator to work on any time
This product was   updated   for the   2026 market   and   optimized   for the   latest MT5 builds . PRICE UPDATEe NOTICE: Smart Price Action Concepts   is currently available for $200. The price will   increase to $299   after the next   30 purchases. SPECIAL OFFER:  After purchasing , send me a private message to claim FREE Bonus + Gift. First of all Its worth emphasizing here that this Trading Tool is Non Repainting , Non Redrawing and Non Lagging Indicator , Which makes it ideal for profe
PZ Swing Trading MT5
PZ TRADING SLU
5 (5)
Protect against whipsaws: revolutionize your swing trading approach Swing Trading is the first indicator designed to detect swings in the direction of the trend and possible reversal swings. It uses the baseline swing trading approach, widely described in trading literature. The indicator studies several price and time vectors to track the aggregate trend direction and detects situations in which the market is oversold or overbought and ready to correct. [ Installation Guide | Update Guide | Tro
PZ Trend Trading MT5
PZ TRADING SLU
3.8 (5)
Capture every opportunity: your go-to indicator for profitable trend trading Trend Trading is an indicator designed to profit as much as possible from trends taking place in the market, by timing pullbacks and breakouts. It finds trading opportunities by analyzing what the price is doing during established trends. [ Installation Guide | Update Guide | Troubleshooting | FAQ | All Products ] Trade financial markets with confidence and efficiency Profit from established trends without getting whips
Btmm state engine pro
Garry James Goodchild
5 (5)
BTMM State Engine Pro is a MetaTrader 5 indicator for traders who use the Beat The Market Maker approach: Asian session context, kill zone timing, level progression, peak formation detection, and a multi-pair scanner from a single chart. It combines cycle state logic with a built-in scanner dashboard so you do not need the same tool on many charts at once. What it does Draws the Asian session range; session times can follow broker server offset or be set in inputs. Tracks level progression (L
Meridian Pro
Ottaviano De Cicco
5 (2)
Meridian Pro 2.00: Professional Multi-Timeframe Trend Matrix for MT5 Meridian Pro 2.00 is a professional adaptive trend matrix for MetaTrader 5. It combines the original Meridian trend engine, a clean chart ribbon, closed-bar signal arrows, an 8-timeframe dashboard, Fuel momentum, weighted consensus, synthetic HTF processing and chart-native higher-timeframe context lines. The goal is simple: read current trend, multi-timeframe structure, strength, momentum and EA-ready state from one discipline
Contact me after purchase to get EA based on this indicator as Bonus ChandraSAR Optimizer: The Self-Adapting Quantitative Trend Engine Most trend indicators fail for one simple reason: markets change, but static parameters don't. ChandraSAR Optimizer bridges the gap between simple signal generation and advanced algorithmic testing. It is a dynamic trend-following system for MetaTrader 5 that solves the problem of shifting volatility by embedding a highly efficient, array-based Walk-Forward opti
KT Alpha Hunter Arrows MT5
KEENBASE SOFTWARE SOLUTIONS
Most arrow indicators give you a signal and leave you to figure out the rest. KT Alpha Hunter Arrows gives you the full trading plan. Every signal arrow prints with a full plan already drawn: entry line, stop-loss, four take-profit levels, and a live edge verdict telling you whether this symbol and time-frame is worth trading right now. An included Trade Manager EA handles the execution after you enter, so discipline stays intact when the market gets loud. Non-repaint. Closed-bar signals only. B
Smart Multi-Layer Breakout & Pullback Detector for MetaTrader 5 "Smart Simple Fast!" Are you tired of missing high-probability breakout entries? Are you spending hours scanning multiple charts, trying to align breakouts with trend direction and currency momentum — only to miss the move? Break Pullback solves all of that in one indicator. What Is Break Pullback? Break Pullback is a professional-grade MetaTrader 5 indicator built specifically for traders who trade market structure, breakouts, an
Meta Trend PRO MT5
Roman Podpora
5 (1)
META TREND PRO       — is a trend-following tool that takes the guesswork out of trading and shows where the market has already made its decision. The indicator identifies key points where trends, trends, and structures change, and highlights areas where the price returns for major players to take positions. You don't just see the movement—you understand the logic behind it. All signals are recorded after the candle closes, are not redrawn, and are saved on the chart, allowing you to confidently
PZ Divergence Trading MT5
PZ TRADING SLU
3.71 (7)
Unlock hidden profits: accurate divergence trading for all markets Tricky to find and scarce in frequency, divergences are one of the most reliable trading scenarios. This indicator finds and scans for regular and hidden divergences automatically using your favourite oscillator. [ Installation Guide | Update Guide | Troubleshooting | FAQ | All Products  ] Easy to trade Finds regular and hidden divergences Supports many well known oscillators Implements trading signals based on breakouts Displays
CRT Multi-Timeframe Market Structure & Liquidity Sweep Indicator Non-Repainting | Multi-Asset | MT4 Version Available MT4 Version: https://www.mql5.com/en/market/product/162556 Full Setup Guide: https://www.mql5.com/en/blogs/post/767525 Indicator Overview CRT Ghost Candle HTF Fractal is a complete institutional-grade market structure toolkit for MetaTrader 5. It projects higher-timeframe candle structure, CRT trap levels, session levels, previous period highs and lows, pivot points, and a real
ARICoins
Temirlan Kdyrkhan
ARICoin is a powerful trading companion designed to generate high-probability entry signals with dynamic TP/SL/DP levels based on volatility. Built-in performance tracking shows win/loss stats, PP1/PP2 hits, and success rates all updated live. Key Features: Buy/Sell signals with adaptive volatility bands Real-time TP/SL/DP levels based on ATR Built-in MA Filter with optional ATR/StdDev volatility Performance stats panel (Success, Profit/Loss, PP1/PP2) Alerts via popup, sound, push, or email Cust
OrderFlux | Footprint Orderflow for MetaTrader 5 Version 2.0 – Real-time Bid/Ask Visualization for Active Traders OrderFlux is a footprint and orderflow indicator for MT5. It shows not only where the price has moved, but what happens inside the movement: Bid/Ask volume per price level, delta, imbalance, and volume distribution. Many charts only show you the final result of a candle. OrderFlux shows you the path to get there. This is exactly what helps when you want to read market participation i
RFI levels PRO MT5
Roman Podpora
4 (4)
The indicator accurately shows the reversal points and price return zones where the   Major players . You see where new trends are forming and make decisions with maximum precision, maintaining control over every trade. VERSION MT4     -    Reveals its maximum potential when combined with the   TREND LINES PRO   indicator What the indicator shows: Reversal structures and reversal levels with activation at the beginning of a new trend. Display of   TAKE PROFIT   and   STOP LOSS   levels with min
ICT PO3 (Power of 3) AMD Protocol Framework Indicator True Time & Structure Integration   |  Non-Repainting | Real-Time  | Multi-Asset  | MT4 Version Available Full Setup Guide & Strategy Playbook: https://www.mql5.com/en/blogs/post/768683 MT4 Version: https://www.mql5.com/en/market/product/171742 Indicator Overview The ICT PO3 AMD Protocol Framework is a complete structural overlay for MetaTrader 5 that maps the True Daily Cycle directly onto your lower-timeframe execution chart. It projects
Precision Spike Detector
Francisco Mandomo Simbine
5 (1)
Precision Spike Detector V3 – Institutional-Grade AI Trading System Attention: The price increases by US$50 for every 10 purchases.  Final price: US$599 Precision Spike Detector V3   is a   state-of-the-art, institutional-grade market analysis system   for   MetaTrader 5 , designed to detect   high-probability market movements   in synthetic indices such as   Boom, Crash, GainX, and PainX . After purchase, please contact me through the MQL5 messaging system to receive the order management tool
Trend Lines PRO MT5
Roman Podpora
5 (1)
TREND LINES PRO  -   helps understand where the market is truly changing direction. The indicator shows real trend reversals and points where major players re-enter. You see   BOS lines   Trend changes and key levels on higher timeframes — without complex settings or unnecessary noise. Signals don't repaint and remain on the chart after the bar closes. MT4 VERSION   - Reveals its maximum potential when combined with the   RFI LEVELS PRO   indicator What the indicator shows: Real shifts   trend
OmniSync Projection
Antonio-alin Teculescu
5 (1)
Chronos Fractal Engine is an innovative price projection indicator for MetaTrader 5, designed to transform your technical analysis by intelligently identifying and projecting historical price patterns. Built upon an advanced correlation algorithm and the fractal principles of the market, this powerful tool visualizes potential future price movements, giving you a unique edge in your trading decisions. What is Chronos Fractal Engine? At its core, the Chronos Fractal Engine employs a sophisticat
Weltrade Spike Sentinel
Batsirayi L Marango
5 (1)
Introducing Indicator for PainX and GainX Indices Traders on Weltrade Get ready to experience the power of trading with our indicator, specifically designed for Weltrade   broker's PainX and GainX Indices.  Advanced Strategies for Unbeatable Insights Our indicator employs sophisticated strategies to analyze market trends, pinpointing optimal entry and exit points.  Optimized for Maximum Performance To ensure optimal results, our indicator is carefully calibrated for 5-minute timeframe charts on
Grabber System MT5
Ihor Otkydach
4.83 (23)
Let me introduce you to an excellent technical indicator – Grabber, which works as a ready-to-use "All-Inclusive" trading strategy. Within a single code, it integrates powerful tools for technical market analysis, trading signals (arrows), alert functions, and push notifications. Every buyer of this indicator also receives the following for free: Grabber Utility for automatic management of open orders Step-by-step video guide: how to install, configure, and trade with the indicator Custom set fi
More from author
Asa Manual Grid Buy Sell with UI is made for Grid trading when orders are placed above and below a set price, creating a grid of orders at incrementally increasing and decreasing prices. Main Features Ability to set buy grid with 3 maximum orders. (200 in full version) Ability to set sell grid with 3 maximum orders. (200 in full version) Easy to use with simple interface. Have 2 mode of Take Profit and 1 for Stop Loss. Real time information for the current open positions and calculate averag
FREE
Asa Manual Grid Buy Sell with UI is made for Grid trading when orders are placed above and below a set price, creating a grid of orders at incrementally increasing and decreasing prices. Main Features Ability to set buy grid with 200 maximum orders. Ability to set sell grid with 200 maximum orders. Easy to use with simple interface. Have 2 mode of Take Profit and 1 for Stop Loss. Real time information for the current open positions and calculate average sum of order price. How to use STEP 1
The reason why many traders new to using the Fibonacci retracement tool find it hard to effectively use it is because they are having trouble identifying swing points that are significant enough to be considered. Main Features Show Fibonacci number with LL to HH in multitimeframe Show 23.6,38.2,50,61.8,78.6,88.6,100,112.8,127.2,141.4,161.8,200,224,261.8,314,361.8 and 423 of Fibonacci number Easy to use with simple interface. Real time information for the Fibonacci number . Settings Global Sett
Trade Manager Panel is an on-chart utility that helps you open, manage, and close trades with one click. It is designed for manual and semi-manual traders who want fast order execution and clear risk control directly from the chart. The lot size is calculated automatically from your account balance, your chosen risk percent, and the distance to your Stop Loss line. Position size and money value are computed using the broker tick value and tick size, so the calculation is correct on all symbols,
1 of 10 for 69$ . Next Price is 89$ SMC Unmitigated Finding is a indicator for find unmitigated supply and demand in previous legs of price Settings Zigzag Settings ZZDepth - by Default is 12. ZZDeviation - by Default is 5. ZZBackStep - by Default is 3. Rectangle Settings SupportColor-  color for Support line.  ResistanceColor  -  color for Resistance line. Settings Num of Show -  Number of Support & Resistance Show.
Close All and Change Take Profit and Stop Loss All Orders. Main Features     Ability to Close All Orders the Symbol you put this EA.     Ability to Change Take Profit to All Order.     Ability to Change Stop Loss to All Order.     Show Order count.     Show Average price with info and Horizontal Line.     Show lot open.     Show Price diff from average to price now     Show broken price with info and Horizontal Line.     Easy to use . How to use Close All (Symbol) PC : you can click on CloseAl
SMC Unmitigated Finding is a indicator for find unmitigated supply and demand in previous legs of price Settings Zigzag Settings ZZDepth - by Default is 12. ZZDeviation - by Default is 5. ZZBackStep - by Default is 3. Horizontal Line Settings SupportColor-  color for Support line.  ResistanceColor  -  color for Resistance line. Settings Num of Show -  Number of Support & Resistance Show.
Asa VWAP
Panthita Aichoi
ASA VWAP is a Volume Weighted Average Price indicator for MetaTrader 5  that supports seven reset periods: M15, M30, H1, H2, H4, Daily, and  Weekly. Unlike fixed-session VWAP tools, this indicator allows traders  to choose the reset interval that best suits their trading style — from  intraday scalping to multi-day swing analysis. The calculation uses the standard VWAP formula: Typical Price (TP) = (High + Low + Close) / 3 VWAP = Cumulative(TP x Volume) / Cumulative(Volume) The indicator accum
Filter:
Handy Abdel Aziz Oboulou
140
Handy Abdel Aziz Oboulou 2024.10.06 06:50 
 

Hello , i have bought your indicator but i cant use it properly because the data are not properly in line the same way as i can see it on your video datas frome previous candlestictk are mixed with data from the second candlestick even when i change the scale and this hapen no matter the TF i use , can you please share the seeting you used on your video ?? it could help a lot for your user :) plus , i see on your video , do you use your indicator on algotrading ?

Panthita Aichoi
1378
Reply from developer Panthita Aichoi 2024.10.06 13:00
Please send me a picture of the issue so I can try to suggest a solution.
Reply to review