Orderflow Footprint
- 지표
-
Panthita Aichoi
 BTC Wallet :
bc1qx685px03km775uapdvje8qz6t839g3fzt0gegv
ETH ERC20
USDT Address:
0x57cF049c965fbE4D25bD2a9aE02B27a04F5574F9 - 버전: 3.3
- 업데이트됨: 3 6월 2026
- 활성화: 5
Asa Orderflow Footprint v3 — 제품 설명서
개요
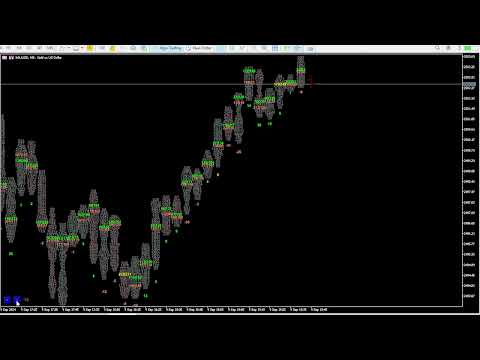
Asa Orderflow Footprint는 MetaTrader 5 전용 전문 등급 풋프린트(Footprint) 차트 지표로, 각 캔들 내부의 모든 가격 수준에서 실시간 매도/매수 거래량(또는 틱 수)을 렌더링합니다. 진지한 오더플로우(주문 흐름) 트레이더를 위해 구축된 이 지표는 기본 풋프린트를 훨씬 뛰어넘어 POC 이동 분석, 한눈에 보는 오더플로우 대시보드, 쌓인 불균형(Stacked Imbalance) 감지, 흡수(Absorption) 플래그, 미체결 POC(Naked POC) 라인을 제공하며, 이 모든 것이 하위 창 없이 메인 차트 창 내부에서 구현됩니다.
골드(XAUUSD) 피드에서 설계 및 테스트된 이 지표는 공격적 성향(Aggressor) 데이터를 제공하는 피드에서는 플래그 기반 틱 분류 엔진을 사용하여 매수자 주도 활동과 매도자 주도 활동을 분리하고, 데이터를 제공하지 않는 피드에서는 순수 가격별 거래량(Volume-by-Price) 분석으로 부드럽게 전환됩니다(참고 사항 참조).
주요 특징
📊 풋프린트 차트 (셀당 Bid | Ask 표시)
- 각 캔들 내부의 가격 버킷별로 매도측(Bid)과 매수측(Ask) 거래량을 나란히 표시합니다.
- 셀 크기는 차트 위의 < / > 버튼을 통해 자유롭게 조절할 수 있어 설정을 다시 열 필요가 없습니다.
- 틱 수 모드(레거시) 또는 리얼 볼륨 모드(volume_real 제공 시 사용, 미제공 시 일반 volume으로 자동 전환) 중에서 선택할 수 있습니다.
- 고정 그리드 가격 버킷: 형성 중인 바가 업데이트되는 동안 셀 위치가 절대 변경되지 않습니다.
- 캔들별 제어 지점(POC)이 자동으로 하이라이트됩니다.
🧭 POC 이동 분석 (신기능)
- 각 캔들의 POC가 이전 바에 비해 어떻게 이동하는지 추적하여 "가치(Value)"가 실제로 어디로 움직이고 있는지 가장 명확하게 읽어냅니다.
- 세 가지 구성 가능한 룩백 윈도우(예: 3 / 5 / 15바)에서 측정됩니다.
- 건강한 추세(POC가 계단식으로 상승/하락), 정체(POC 평탄화) 또는 다이버전스(가격은 새로운 고점/저점을 만들지만 POC는 따라가지 못함)를 즉시 드러냅니다.
- 델타가 아닌 가격별 거래량을 기반으로 하므로 모든 피드에서 작동합니다.
📋 스마트 대시보드 (신기능)
- 전체 주문 흐름을 압축하여 한눈에 볼 수 있는 단일 패널로 방향, 확신도, 주요 레벨을 즉시 확인할 수 있습니다.
- 방향성 헤드라인(Bias headline) — 단기 가중치 POC 이동(가중치 설정 가능)에서 도출된 전반적인 방향을 UP / DOWN / RANGE로 색상 표시합니다.
- 확신도 미터(Conviction meter) — 상대 거래량에 의해 구동되는 strong(강함) / medium(보통) / thin(약함) 단계로, 움직임 배후에 실제 시장 참여가 있는지 알려줍니다.
- POC 이동 미터 — 3 / 5 / 15바 윈도우로 순수 단계, 상승-하락 카운트 또는 백분율 중 선택하여 표시할 수 있습니다.
- POC 트레일 스파크라인 — 최근 바들의 POC를 미니 프로필로 그려 이동 형태를 한눈에 읽을 수 있습니다.
- Naked POC 판독 — 가격 위아래로 가장 가까운 미체결 POC를 거리 및 가격 접근 시 근접 하이라이트와 함께 표시합니다.
- 마지막 캔들 특성 — 프로필 형태(P형 / b형 / 균형 잡힌 형) 및 흡수 상태(매수 / 매도).
- 빌트인 스케일 제어 — < / > 셀 크기 버튼이 패널 하단에 깔끔하게 통합되어 있습니다.
- 자유로운 위치 이동 — 사용자 지정 X / Y 오프셋을 사용하여 대시보드를 차트의 원하는 모서리에 배치할 수 있으며, 차트 크기 변경 시 자동으로 재배치됩니다.
🔴🟢 불균형 및 흡수 감지
- 흡수 캔들(Absorption Candle) — 지배적인 측의 POC가 왜곡된 캔들을 표시하며, 바의 위/아래에 유색 다이아몬드 마커로 표시됩니다(녹색 = 매수측, 연어색 = 매도측).
- 쌓인 대각선 불균형(Stacked Diagonal Imbalance) — 설정된 비율에 따라 Ask가 한 셀 아래의 Bid를 압도하는(또는 그 반대) 연속적인 가격 수준을 고유한 매수/매도 불균형 색상으로 하이라이트합니다.
- 불균형 스택 길이와 비율은 완전히 구성 가능합니다(ImbRatio 비율, ImbStack 최소 행 수).
📌 Naked POC 라인
- 각 바의 제어 지점(Bid+Ask 합산 거래량이 가장 높은 셀)에 수평선을 자동으로 그립니다.
- 선은 오른쪽으로 연장되며, 후속 캔들의 범위가 해당 가격 수준에 닿으면 자동으로 사라집니다.
- 색상, 스타일, 너비를 완전히 맞춤 설정할 수 있으며 마그넷 및 동적 지지/저항 역할을 합니다.
🎯 캔들 내 POC 마커 (신기능)
- 각 캔들 내부 중앙의 정확한 POC 가격에 그려지는 옵션 마커로, 차트 전체의 이동 계단을 한눈에 스캔할 수 있습니다.
- 구성 가능한 문자/텍스트, 색상 및 글꼴 크기.
📋 캔들별 요약 라인
- 각 캔들 아래에 표시되는 옵션 요약 라인: B: [매수] S: [매도] T: [총량] [델타%].
- 개별 셀을 읽지 않고도 즉각적인 한눈에 보는 컨텍스트를 제공합니다.
🔔 스마트 알림
- 다음 조건에 대한 팝업 및/또는 푸시 알림:
- POC 이동 정렬 — 3 / 5 / 15 윈도우의 방향이 모두 일치할 때 발생(강한 추세 신호) (신기능).
- 불균형 / 흡수 캔들 감지.
- 직전 마감된 바의 델타 부호 반전(공격적 성향 데이터가 있는 피드에서).
- 알림은 마감된 캔들당 한 번만 발생하므로 매 틱마다 반복되는 스팸이 없습니다.
⚡ 성능 최적화
- 증분 재동기화: 매 틱마다 형성 중인 캔들(Shift 0)만 다시 계산되고, 모든 과거 캔들은 바가 열릴 때 한 번만 그려집니다.
- 객체 재사용: 차트 객체를 삭제하고 다시 생성하는 대신 제자리에서 업데이트하여 100개 이상의 캔들이 표시되더라도 CPU 사용량을 낮게 유지합니다.
- 무거운 작업(Naked-POC 스캔, 이동 분석)은 바 마감 시 실행되며, 틱 내부에서는 상대 거래량과 근접도만 업데이트됩니다.
입력 매개변수
메인 (Main)
- ShowFootprint — 풋프린트 셀 텍스트 표시/숨기기.
- ShowSummary — 캔들별 B/S/Total/Delta% 요약 라인 표시.
- TPointScale — 초기 셀 크기(포인트 단위), 대시보드 버튼으로 실시간 조절 가능.
- CountMode — 셀 값 = 틱 수 또는 리얼 볼륨.
- OFPercent — 흡수 캔들 임계값(%).
- CountCandle — 렌더링할 캔들 수(최대 100개).
- FontSize — 셀 텍스트 글꼴 크기.
- MBidColor / MAskColor — 최대 Bid / 최대 Ask 셀의 하이라이트 색상.
- sameColor — 최대 Bid와 최대 Ask가 동일한 셀에 있을 때의 색상.
- NormalColor / BlankDataColor — 일반 셀 및 데이터가 없는 빈 셀의 색상.
불균형 (Imbalance)
- ShowAbsorbCandle — 흡수 캔들 다이아몬드 마커 표시.
- ShowImbalance — 쌓인 대각선 불균형 하이라이트 활성화.
- ImbRatio — 대각선 불균형 셀을 표시하기 위한 최소 Ask/Bid 비율.
- ImbStack — 영역을 하이라이트하는 데 필요한 최소 연속 불균형 셀 수.
- ImbBuyColor / ImbSellColor — 매수/매도 불균형 영역 하이라이트 색상.
알림 (Alert)
- AlertPopup / AlertPush — 팝업 / 푸시 알림 알림 활성화.
- AlertOnImb / AlertOnFlip — 알림 트리거: 불균형 캔들 / 델타 반전.
미체결 POC 라인 (Naked POC lines)
- ShowPOC — Naked POC 연장선 표시.
- POCColor / POCStyle / POCWidth — POC 라인 외관 설정.
캔들 내 POC 마커 (POC marker in candle)
- ShowPOCInCandle — 캔들 내 중앙 POC 마커 표시.
- POCInText — 마커 문자/텍스트.
- POCInColor — 마커 색상.
- POCInFontSize — 마커 글꼴 크기.
대시보드 (Dashboard)
- ShowDashboard — 오더플로우 대시보드 표시/숨기기.
- DashCorner — 대시보드 모서리 위치 (4개 모서리 중 선택).
- DashX / DashY — 모서리로부터의 대시보드 오프셋(픽셀).
- MigMode — 이동 셀 표시: 순수 단계 / 상승-하락 / 백분율.
- MigW1 / MigW2 / MigW3 — POC 이동 룩백 윈도우(바 수), 기본값 3 / 5 / 15.
- BiasWgt1 / BiasWgt2 / BiasWgt3 — 윈도우별 방향성 가중치(기본값은 단기 가중치, 3 / 2 / 1).
- RelVolPeriod — 상대 거래량 평균화 기간(바 수).
- RelVolStrong / RelVolMedium — 강함 / 보통 확신도를 위한 상대 거래량 임계값.
- ProximityPts — Naked POC가 "가깝다"고 간주되는 거리(포인트).
- AlertOnAlign — 3개의 이동 윈도우가 모두 일치할 때 알림.
사용 방법
1. 지표를 원하는 차트와 타임프레임에 적용합니다(XAUUSD M1 권장).
2. 대시보드 하단의 < > 버튼을 사용하여 각 바가 읽기 쉬운 수의 가격 행을 표시할 때까지 셀 크기를 늘리거나 줄입니다.
3. 대시보드를 먼저 읽으십시오: Bias 헤드라인은 방향 + 확신도를 제공하며, 3 / 5 / 15 이동 미터와 POC 트레일은 추세가 건강한지, 정체되었는지 또는 다이버전스가 발생하는지 보여줍니다.
4. 이동 방향을 따라 거래하십시오 — 이전 캔들의 POC 또는 유지되고 있는 Naked POC 레벨로 풀백할 때 진입하고, 이동이 정체/다이버전스를 보이거나 추세와 반대되는 흡수 다이아몬드가 찍힐 때 반전을 감시하십시오.
5. 위아래로 가장 가까운 미테스트 고거래량 레벨을 파악하기 위해 Naked POC 판독값을 주시하십시오 — 자연스러운 타겟 및 반응 존이 됩니다.
6. 청록색 하이라이트 영역(쌓인 매수 불균형)과 자홍색 하이라이트 영역(쌓인 매도 불균형)을 잠재적인 기관 주문 클러스터로 주목하십시오.
7. 알림을 활성화하면 화면을 계속 주시하지 않아도 이동 정렬, 불균형/흡수 캔들 또는 델타 반전에 대한 알림을 받을 수 있습니다.
참고 및 요구 사항
- `CopyTicksRange()`를 통해 틱 이력을 제공하는 브로커가 필요합니다 — MT5의 대부분의 ECN/STP 브로커가 이에 해당합니다.
- 델타 기반 기능(델타 %, 델타 반전 알림 및 해당되는 경우 CVD)은 공격적 성향 측(Bid/Ask)별로 틱을 분류하는 피드가 필요합니다. 특정 CFD 피드에서 흔히 볼 수 있는 일부 계정은 결합된 Bid+Ask 틱을 전송하므로 델타 판독값이 거의 0이 됩니다. 이러한 피드에서도 지표는 공격적 성향 데이터에 의존하지 않는 가격별 거래량, POC, POC 이동, Naked POC 및 상대 거래량 도구를 통해 완전히 작동합니다.
- 리얼 볼륨 모드는 브로커가 틱 데이터 내에서 `volume_real`을 제공해야 합니다. 사용할 수 없는 경우 지표는 자동으로 틱 볼륨으로 전환됩니다.
- 의미 있는 오더플로우 세분성을 확보하기 위해 M1에서 H1 타임프레임에서 실행하는 것을 권장합니다.
- 차트 객체를 관리 가능한 수준으로 유지하기 위해 낮은 타임프레임에서는 `CountCandle`을 보수적으로 설정(30–50)하십시오.
- 이 지표는 분석 도구일 뿐입니다 — 자동으로 거래를 체결하지 않으며, 어떤 지표도 수익을 보장하지 않습니다. 항상 올바른 리스크 관리를 사용하십시오.
개요
Asa Orderflow Footprint는 MetaTrader 5 전용 전문 등급 풋프린트(Footprint) 차트 지표로, 각 캔들 내부의 모든 가격 수준에서 실시간 매도/매수 거래량(또는 틱 수)을 렌더링합니다. 진지한 오더플로우(주문 흐름) 트레이더를 위해 구축된 이 지표는 기본 풋프린트를 훨씬 뛰어넘어 POC 이동 분석, 한눈에 보는 오더플로우 대시보드, 쌓인 불균형(Stacked Imbalance) 감지, 흡수(Absorption) 플래그, 미체결 POC(Naked POC) 라인을 제공하며, 이 모든 것이 하위 창 없이 메인 차트 창 내부에서 구현됩니다.
골드(XAUUSD) 피드에서 설계 및 테스트된 이 지표는 공격적 성향(Aggressor) 데이터를 제공하는 피드에서는 플래그 기반 틱 분류 엔진을 사용하여 매수자 주도 활동과 매도자 주도 활동을 분리하고, 데이터를 제공하지 않는 피드에서는 순수 가격별 거래량(Volume-by-Price) 분석으로 부드럽게 전환됩니다(참고 사항 참조).
주요 특징
📊 풋프린트 차트 (셀당 Bid | Ask 표시)
- 각 캔들 내부의 가격 버킷별로 매도측(Bid)과 매수측(Ask) 거래량을 나란히 표시합니다.
- 셀 크기는 차트 위의 < / > 버튼을 통해 자유롭게 조절할 수 있어 설정을 다시 열 필요가 없습니다.
- 틱 수 모드(레거시) 또는 리얼 볼륨 모드(volume_real 제공 시 사용, 미제공 시 일반 volume으로 자동 전환) 중에서 선택할 수 있습니다.
- 고정 그리드 가격 버킷: 형성 중인 바가 업데이트되는 동안 셀 위치가 절대 변경되지 않습니다.
- 캔들별 제어 지점(POC)이 자동으로 하이라이트됩니다.
🧭 POC 이동 분석 (신기능)
- 각 캔들의 POC가 이전 바에 비해 어떻게 이동하는지 추적하여 "가치(Value)"가 실제로 어디로 움직이고 있는지 가장 명확하게 읽어냅니다.
- 세 가지 구성 가능한 룩백 윈도우(예: 3 / 5 / 15바)에서 측정됩니다.
- 건강한 추세(POC가 계단식으로 상승/하락), 정체(POC 평탄화) 또는 다이버전스(가격은 새로운 고점/저점을 만들지만 POC는 따라가지 못함)를 즉시 드러냅니다.
- 델타가 아닌 가격별 거래량을 기반으로 하므로 모든 피드에서 작동합니다.
📋 스마트 대시보드 (신기능)
- 전체 주문 흐름을 압축하여 한눈에 볼 수 있는 단일 패널로 방향, 확신도, 주요 레벨을 즉시 확인할 수 있습니다.
- 방향성 헤드라인(Bias headline) — 단기 가중치 POC 이동(가중치 설정 가능)에서 도출된 전반적인 방향을 UP / DOWN / RANGE로 색상 표시합니다.
- 확신도 미터(Conviction meter) — 상대 거래량에 의해 구동되는 strong(강함) / medium(보통) / thin(약함) 단계로, 움직임 배후에 실제 시장 참여가 있는지 알려줍니다.
- POC 이동 미터 — 3 / 5 / 15바 윈도우로 순수 단계, 상승-하락 카운트 또는 백분율 중 선택하여 표시할 수 있습니다.
- POC 트레일 스파크라인 — 최근 바들의 POC를 미니 프로필로 그려 이동 형태를 한눈에 읽을 수 있습니다.
- Naked POC 판독 — 가격 위아래로 가장 가까운 미체결 POC를 거리 및 가격 접근 시 근접 하이라이트와 함께 표시합니다.
- 마지막 캔들 특성 — 프로필 형태(P형 / b형 / 균형 잡힌 형) 및 흡수 상태(매수 / 매도).
- 빌트인 스케일 제어 — < / > 셀 크기 버튼이 패널 하단에 깔끔하게 통합되어 있습니다.
- 자유로운 위치 이동 — 사용자 지정 X / Y 오프셋을 사용하여 대시보드를 차트의 원하는 모서리에 배치할 수 있으며, 차트 크기 변경 시 자동으로 재배치됩니다.
🔴🟢 불균형 및 흡수 감지
- 흡수 캔들(Absorption Candle) — 지배적인 측의 POC가 왜곡된 캔들을 표시하며, 바의 위/아래에 유색 다이아몬드 마커로 표시됩니다(녹색 = 매수측, 연어색 = 매도측).
- 쌓인 대각선 불균형(Stacked Diagonal Imbalance) — 설정된 비율에 따라 Ask가 한 셀 아래의 Bid를 압도하는(또는 그 반대) 연속적인 가격 수준을 고유한 매수/매도 불균형 색상으로 하이라이트합니다.
- 불균형 스택 길이와 비율은 완전히 구성 가능합니다(ImbRatio 비율, ImbStack 최소 행 수).
📌 Naked POC 라인
- 각 바의 제어 지점(Bid+Ask 합산 거래량이 가장 높은 셀)에 수평선을 자동으로 그립니다.
- 선은 오른쪽으로 연장되며, 후속 캔들의 범위가 해당 가격 수준에 닿으면 자동으로 사라집니다.
- 색상, 스타일, 너비를 완전히 맞춤 설정할 수 있으며 마그넷 및 동적 지지/저항 역할을 합니다.
🎯 캔들 내 POC 마커 (신기능)
- 각 캔들 내부 중앙의 정확한 POC 가격에 그려지는 옵션 마커로, 차트 전체의 이동 계단을 한눈에 스캔할 수 있습니다.
- 구성 가능한 문자/텍스트, 색상 및 글꼴 크기.
📋 캔들별 요약 라인
- 각 캔들 아래에 표시되는 옵션 요약 라인: B: [매수] S: [매도] T: [총량] [델타%].
- 개별 셀을 읽지 않고도 즉각적인 한눈에 보는 컨텍스트를 제공합니다.
🔔 스마트 알림
- 다음 조건에 대한 팝업 및/또는 푸시 알림:
- POC 이동 정렬 — 3 / 5 / 15 윈도우의 방향이 모두 일치할 때 발생(강한 추세 신호) (신기능).
- 불균형 / 흡수 캔들 감지.
- 직전 마감된 바의 델타 부호 반전(공격적 성향 데이터가 있는 피드에서).
- 알림은 마감된 캔들당 한 번만 발생하므로 매 틱마다 반복되는 스팸이 없습니다.
⚡ 성능 최적화
- 증분 재동기화: 매 틱마다 형성 중인 캔들(Shift 0)만 다시 계산되고, 모든 과거 캔들은 바가 열릴 때 한 번만 그려집니다.
- 객체 재사용: 차트 객체를 삭제하고 다시 생성하는 대신 제자리에서 업데이트하여 100개 이상의 캔들이 표시되더라도 CPU 사용량을 낮게 유지합니다.
- 무거운 작업(Naked-POC 스캔, 이동 분석)은 바 마감 시 실행되며, 틱 내부에서는 상대 거래량과 근접도만 업데이트됩니다.
입력 매개변수
메인 (Main)
- ShowFootprint — 풋프린트 셀 텍스트 표시/숨기기.
- ShowSummary — 캔들별 B/S/Total/Delta% 요약 라인 표시.
- TPointScale — 초기 셀 크기(포인트 단위), 대시보드 버튼으로 실시간 조절 가능.
- CountMode — 셀 값 = 틱 수 또는 리얼 볼륨.
- OFPercent — 흡수 캔들 임계값(%).
- CountCandle — 렌더링할 캔들 수(최대 100개).
- FontSize — 셀 텍스트 글꼴 크기.
- MBidColor / MAskColor — 최대 Bid / 최대 Ask 셀의 하이라이트 색상.
- sameColor — 최대 Bid와 최대 Ask가 동일한 셀에 있을 때의 색상.
- NormalColor / BlankDataColor — 일반 셀 및 데이터가 없는 빈 셀의 색상.
불균형 (Imbalance)
- ShowAbsorbCandle — 흡수 캔들 다이아몬드 마커 표시.
- ShowImbalance — 쌓인 대각선 불균형 하이라이트 활성화.
- ImbRatio — 대각선 불균형 셀을 표시하기 위한 최소 Ask/Bid 비율.
- ImbStack — 영역을 하이라이트하는 데 필요한 최소 연속 불균형 셀 수.
- ImbBuyColor / ImbSellColor — 매수/매도 불균형 영역 하이라이트 색상.
알림 (Alert)
- AlertPopup / AlertPush — 팝업 / 푸시 알림 알림 활성화.
- AlertOnImb / AlertOnFlip — 알림 트리거: 불균형 캔들 / 델타 반전.
미체결 POC 라인 (Naked POC lines)
- ShowPOC — Naked POC 연장선 표시.
- POCColor / POCStyle / POCWidth — POC 라인 외관 설정.
캔들 내 POC 마커 (POC marker in candle)
- ShowPOCInCandle — 캔들 내 중앙 POC 마커 표시.
- POCInText — 마커 문자/텍스트.
- POCInColor — 마커 색상.
- POCInFontSize — 마커 글꼴 크기.
대시보드 (Dashboard)
- ShowDashboard — 오더플로우 대시보드 표시/숨기기.
- DashCorner — 대시보드 모서리 위치 (4개 모서리 중 선택).
- DashX / DashY — 모서리로부터의 대시보드 오프셋(픽셀).
- MigMode — 이동 셀 표시: 순수 단계 / 상승-하락 / 백분율.
- MigW1 / MigW2 / MigW3 — POC 이동 룩백 윈도우(바 수), 기본값 3 / 5 / 15.
- BiasWgt1 / BiasWgt2 / BiasWgt3 — 윈도우별 방향성 가중치(기본값은 단기 가중치, 3 / 2 / 1).
- RelVolPeriod — 상대 거래량 평균화 기간(바 수).
- RelVolStrong / RelVolMedium — 강함 / 보통 확신도를 위한 상대 거래량 임계값.
- ProximityPts — Naked POC가 "가깝다"고 간주되는 거리(포인트).
- AlertOnAlign — 3개의 이동 윈도우가 모두 일치할 때 알림.
사용 방법
1. 지표를 원하는 차트와 타임프레임에 적용합니다(XAUUSD M1 권장).
2. 대시보드 하단의 < > 버튼을 사용하여 각 바가 읽기 쉬운 수의 가격 행을 표시할 때까지 셀 크기를 늘리거나 줄입니다.
3. 대시보드를 먼저 읽으십시오: Bias 헤드라인은 방향 + 확신도를 제공하며, 3 / 5 / 15 이동 미터와 POC 트레일은 추세가 건강한지, 정체되었는지 또는 다이버전스가 발생하는지 보여줍니다.
4. 이동 방향을 따라 거래하십시오 — 이전 캔들의 POC 또는 유지되고 있는 Naked POC 레벨로 풀백할 때 진입하고, 이동이 정체/다이버전스를 보이거나 추세와 반대되는 흡수 다이아몬드가 찍힐 때 반전을 감시하십시오.
5. 위아래로 가장 가까운 미테스트 고거래량 레벨을 파악하기 위해 Naked POC 판독값을 주시하십시오 — 자연스러운 타겟 및 반응 존이 됩니다.
6. 청록색 하이라이트 영역(쌓인 매수 불균형)과 자홍색 하이라이트 영역(쌓인 매도 불균형)을 잠재적인 기관 주문 클러스터로 주목하십시오.
7. 알림을 활성화하면 화면을 계속 주시하지 않아도 이동 정렬, 불균형/흡수 캔들 또는 델타 반전에 대한 알림을 받을 수 있습니다.
참고 및 요구 사항
- `CopyTicksRange()`를 통해 틱 이력을 제공하는 브로커가 필요합니다 — MT5의 대부분의 ECN/STP 브로커가 이에 해당합니다.
- 델타 기반 기능(델타 %, 델타 반전 알림 및 해당되는 경우 CVD)은 공격적 성향 측(Bid/Ask)별로 틱을 분류하는 피드가 필요합니다. 특정 CFD 피드에서 흔히 볼 수 있는 일부 계정은 결합된 Bid+Ask 틱을 전송하므로 델타 판독값이 거의 0이 됩니다. 이러한 피드에서도 지표는 공격적 성향 데이터에 의존하지 않는 가격별 거래량, POC, POC 이동, Naked POC 및 상대 거래량 도구를 통해 완전히 작동합니다.
- 리얼 볼륨 모드는 브로커가 틱 데이터 내에서 `volume_real`을 제공해야 합니다. 사용할 수 없는 경우 지표는 자동으로 틱 볼륨으로 전환됩니다.
- 의미 있는 오더플로우 세분성을 확보하기 위해 M1에서 H1 타임프레임에서 실행하는 것을 권장합니다.
- 차트 객체를 관리 가능한 수준으로 유지하기 위해 낮은 타임프레임에서는 `CountCandle`을 보수적으로 설정(30–50)하십시오.
- 이 지표는 분석 도구일 뿐입니다 — 자동으로 거래를 체결하지 않으며, 어떤 지표도 수익을 보장하지 않습니다. 항상 올바른 리스크 관리를 사용하십시오.


Hello , i have bought your indicator but i cant use it properly because the data are not properly in line the same way as i can see it on your video datas frome previous candlestictk are mixed with data from the second candlestick even when i change the scale and this hapen no matter the TF i use , can you please share the seeting you used on your video ?? it could help a lot for your user :) plus , i see on your video , do you use your indicator on algotrading ?