Orderflow Footprint
- Indicatori
-
Panthita Aichoi
 BTC Wallet :
bc1qx685px03km775uapdvje8qz6t839g3fzt0gegv
ETH ERC20
USDT Address:
0x57cF049c965fbE4D25bD2a9aE02B27a04F5574F9 - Versione: 3.3
- Aggiornato: 3 giugno 2026
- Attivazioni: 5
Asa Orderflow Footprint v3 — Descrizione del prodotto
Panoramica
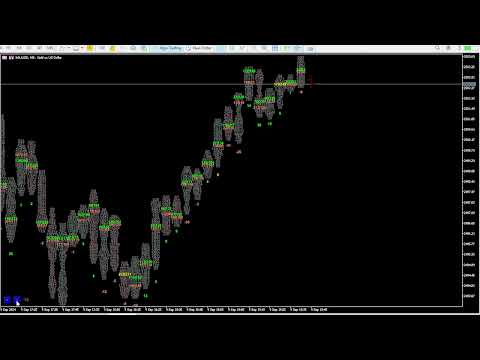
Asa Orderflow Footprint è un indicatore professionale di grafici footprint per MetaTrader 5 che renderizza in tempo reale il volume Bid/Ask (o il conteggio dei tick) a ogni livello di prezzo all'interno di ciascuna candela. Sviluppato per i trader di order flow professionisti, va ben oltre un footprint di base aggiungendo l'analisi della migrazione del POC, un pannello di controllo dell'order flow consultabile a colpo d'occhio, il rilevamento degli sbilanciamenti cumulati (stacked imbalances), i marker di assorbimento e le linee di Point of Control non testate (Naked POC) — il tutto all'interno della finestra principale del grafico, senza richiedere sotto-finestre.
Progettato e testato sui feed dell'Oro (XAUUSD), l'indicatore utilizza un motore di classificazione dei tick basato su flag per separare l'attività avviata da compratori e venditori sui feed che forniscono i dati dell'aggressore, e passa automaticamente a una pura analisi del volume per prezzo sui feed che non li forniscono (vedere Note).
Caratteristiche principali
📊 Grafico Footprint (Bid | Ask per cella)
- Mostra il volume lato vendita (Bid) e lato acquisto (Ask) l'uno accanto all'altro a ogni livello di prezzo all'interno di ciascuna candela.
- La dimensione della cella è liberamente regolabile tramite i pulsanti < / > sul grafico — non è necessario riaprire le impostazioni.
- Scegli tra la modalità Conteggio Tick (legacy) o la modalità Volume Reale (volume_real con fallback sul volume standard).
- Griglia di prezzo fissa: le celle non cambiano mai posizione mentre la candela in formazione si aggiorna.
- Il Point of Control (POC) viene evidenziato automaticamente su ogni candela.
🧭 Migrazione del POC (NUOVO)
- Traccia come il POC di ogni candela si sposta rispetto alle barre precedenti — la lettura più pulita di dove si sta effettivamente muovendo il "valore".
- Misurato su tre finestre di look-back configurabili (es. 3 / 5 / 15 barre).
- Rivela istantaneamente un trend sano (il POC sale/scende a gradini), uno stallo (il POC si appiattisce) o una divergenza (il prezzo fa un nuovo massimo/minimo mentre il POC non lo segue).
- Funziona su qualsiasi feed — basato sul volume per prezzo, non sul delta.
📋 Pannello di controllo intelligente / Dashboard (NUOVO)
- Un unico pannello visibile a colpo d'occhio che condensa l'intero flusso d'ordini: osserva la direzione, la convinzione e i livelli chiave in un istante.
- Titolo del bias (Bias headline) — direzione generale derivata dalla migrazione del POC ponderata a breve termine (pesi configurabili), codificata a colori UP (Rialzista) / DOWN (Ribassista) / RANGE (Range).
- Misuratore di convinzione (Conviction meter) — forte / medio / debole, guidato dal volume relativo, per sapere se un movimento è supportato da una reale partecipazione del mercato.
- Misuratore di migrazione del POC — finestre a 3 / 5 / 15 barre con visualizzazione selezionabile: passi netti, conteggi up-down o percentuale.
- Sparkline del percorso del POC — il POC delle ultime barre disegnato come un mini-profilo per leggere la forma della migrazione a colpo d'occhio.
- Lettura del Naked POC — i POC non testati più vicini sopra e sotto il prezzo, con distanza e un'evidenziazione di prossimità quando il prezzo si avvicina.
- Carattere dell'ultima candela — forma del profilo (Profilo a P / a b / equilibrato) e stato di assorbimento (acquisto / vendita).
- Controlli di scala integrati — i pulsanti < / > per la dimensione delle celle sono integrati nel pannello.
- Completamente mobile — posiziona la dashboard in qualsiasi angolo del grafico con un offset X / Y personalizzato; si riposiziona automaticamente ridimensionando il grafico.
🔴🟢 Rilevamento di sbilanciamento e assorbimento
- Candela di assorbimento (Absorption Candle) — segnala le candele in cui il POC del lato dominante è sbilanciato, contrassegnata con un diamante colorato sopra/sotto la barra (verde = lato acquisto, salmone = lato vendita).
- Sbilanciamento diagonale cumulato (Stacked Diagonal Imbalance) — evidenzia livelli di prezzo consecutivi in cui l'Ask domina il Bid una cella più in basso (o viceversa) in base a un rapporto configurabile, colorato con i colori distinti dello sbilanciamento di Acquisto/Vendita.
- La lunghezza del blocco di sbilanciamento e il rapporto sono interamente configurabili (ImbRatio rapporto, righe minime ImbStack).
📌 Linee di POC non testate (Naked POC)
- Disegna automaticamente una linea orizzontale in corrispondenza del Point of Control di ciascuna barra (la cella con il volume combinato Bid+Ask più alto).
- Le linee si estendono verso destra e scompaiono automaticamente non appena il range di una candela successiva tocca quel livello di prezzo.
- Colore, stile e larghezza completamente personalizzabili — fungono da magneti e da supporti/resistenze dinamici.
🎯 Marcatore POC nella candela (NUOVO)
- Marcatore opzionale disegnato all'esatto prezzo del POC, centrato all'interno di ciascuna candela, per scansionare l'intera scala di migrazione sul grafico a colpo d'occhio.
- Simbolo/testo, colore e dimensione del font configurabili.
📋 Linea di riepilogo per candela
- Linea di riepilogo opzionale sotto ogni candela: B: [acquisti] S: [vendite] T: [totale] [delta%].
- Fornisce un contesto istantaneo a colpo d'occhio senza dover leggere le singole celle.
🔔 Avvisi intelligenti (Alert)
- Avvisi pop-up e/o notifiche push per:
- Allineamento della migrazione del POC — si attiva quando le finestre 3 / 5 / 15 concordano tutte sulla direzione (un segnale di trend forte) (NUOVO).
- Rilevamento candela di sbilanciamento / assorbimento.
- Inversione del segno del Delta sulla barra appena chiusa (sui feed con dati dell'aggressore).
- Gli avvisi si attivano una sola volta per candela chiusa — nessun flood ripetitivo a ogni tick.
⚡ Prestazioni ottimizzate
- Ricalcolo incrementale: solo la candela in formazione (shift 0) viene ricalcolata a ogni tick; tutte le candele storiche vengono disegnate una sola volta all'apertura della barra.
- Riutilizzo degli oggetti: gli oggetti del grafico vengono aggiornati direttamente sul posto invece di essere eliminati e ricreati, mantenendo basso l'uso della CPU anche con oltre 100 candele visualizzate.
- I calcoli pesanti (scansione dei naked-POC, migrazione) vengono eseguiti alla chiusura della barra; solo il volume relativo e la prossimità si aggiornano intratick.
Parametri di input
Principali (Main)
- ShowFootprint — Mostra/nascondi il testo delle celle del footprint.
- ShowSummary — Mostra la linea di riepilogo B/S/Total/Delta% per candela.
- TPointScale — Dimensione iniziale della cella (in punti); regolabile in tempo reale con i pulsanti della dashboard.
- CountMode — Valore della cella = conteggio tick o volume reale.
- OFPercent — Soglia della candela di assorbimento (%).
- CountCandle — Numero di candele da renderizzare (fino a 100).
- FontSize — Dimensione del font del testo della cella.
- MBidColor / MAskColor — Colore di evidenziazione per le celle di Bid max / Ask max.
- sameColor — Colore quando il Bid max e l'Ask max si trovano sulla stessa cella.
- NormalColor / BlankDataColor — Colori per celle normali e vuote.
Sbilanciamento (Imbalance)
- ShowAbsorbCandle — Mostra i marker a diamante della candela di assorbimento.
- ShowImbalance — Abilita l'evidenziazione dello sbilanciamento diagonale cumulato.
- ImbRatio — Rapporto Ask/Bid minimo per segnalare una cella in sbilanciamento diagonale.
- ImbStack — Minimo di celle in sbilanciamento consecutive richiesto per evidenziare la zona.
- ImbBuyColor / ImbSellColor — Colori di evidenziazione della zona di sbilanciamento di acquisto/vendita.
Avvisi (Alert)
- AlertPopup / AlertPush — Abilita avvisi pop-up / notifiche push.
- AlertOnImb / AlertOnFlip — Trigger dell'avviso: candela di sbilanciamento / inversione del delta.
Linee di POC non testate (Naked POC lines)
- ShowPOC — Mostra le linee di estensione dei POC non testati.
- POCColor / POCStyle / POCWidth — Impostazioni dell'aspetto della linea POC.
Marcatore POC nella candela (POC marker in candle)
- ShowPOCInCandle — Mostra il marcatore POC centrato all'interno della candela.
- POCInText — Simbolo/testo del marcatore.
- POCInColor — Colore del marcatore.
- POCInFontSize — Dimensione del font del marcatore.
Pannello di controllo (Dashboard)
- ShowDashboard — Mostra/nascondi la dashboard dell'order flow.
- DashCorner — Angolo della dashboard (uno qualsiasi dei 4 angoli).
- DashX / DashY — Offset della dashboard dall'angolo (pixel).
- MigMode — Visualizzazione della cella di migrazione: passi netti / up-down / percentuale.
- MigW1 / MigW2 / MigW3 — Finestre di look-back della migrazione del POC (barre), di default 3 / 5 / 15.
- BiasWgt1 / BiasWgt2 / BiasWgt3 — Ponderazione del bias per finestra (ponderata a breve termine di default, 3 / 2 / 1).
- RelVolPeriod — Periodo di media del volume relativo (barres).
- RelVolStrong / RelVolMedium — Soglie del volume relativo per convinzione forte / media.
- ProximityPts — Distanza (punti) alla quale un POC non testato conta come "vicino".
- AlertOnAlign — Avviso quando le 3 finestre di migrazione si allineano tutte.
Istruzioni per l'uso
1. Collega l'indicatore a qualsiasi grafico e timeframe (consigliato XAUUSD M1).
2. Utilizza i pulsanti < > nel piè di pagina della dashboard per aumentare o diminuire la dimensione della cella finché ogni barra non mostra un numero leggibile di righe di prezzo.
3. Leggi prima la Dashboard: il titolo Bias fornisce la direzione + la convinzione; il misuratore di migrazione 3 / 5 / 15 e il percorso del POC mostrano se il trend è sano, in stallo o in divergenza.
4. Fai trading seguendo la migrazione — entra sui rintracciamenti verso il POC di una candela precedente o verso un livello di Naked POC che tiene; monitora le inversioni quando la migrazione si ferma/diverge o quando un diamante di assorbimento si stampa contro il trend.
5. Monitora la lettura del Naked POC per individuare i livelli ad alto volume non testati più vicini sopra/sotto — target naturali e zone di reazione.
6. Presta attenzione alle zone evidenziate in ciano (sbilanciamento di acquisto cumulato) e in magenta (sbilanciamento di vendita cumulato) come potenziali cluster di ordini istituzionali.
7. Abilita gli Avvisi per ricevere notifiche sull'allineamento della migrazione, sulle candele di sbilanciamento/assorbimento o sulle inversioni del delta senza dover monitorare costantemente lo schermo.
Note e requisiti
- Richiede un broker che fornisca lo storico dei tick tramite `CopyTicksRange()` — la maggior parte dei broker ECN/STP su MT5 soddisfa questo requisito.
- Le funzionalità basate sul Delta (% di Delta, alert di inversione del delta e CVD ove applicabile) richiedono un feed che contrassegni i tick in base al lato dell'aggressore (Bid/Ask). Alcuni conti — comuni su determinati feed CFD — inviano tick combinati Bid+Ask, il che rende la lettura del Delta ≈ 0. Su tali feed, l'indicatore funziona comunque pienamente attraverso i suoi strumenti di Volume per prezzo, POC, Migrazione del POC, Naked POC e Volume relativo, che non dipendono dai dati dell'aggressore.
- La modalità Volume Reale richiede che il broker fornisca `volume_real` nei dati dei tick; l'indicatore ripiega automaticamente sul volume del tick se non disponibile.
- Si raccomanda l'esecuzione su timeframe da M1 a H1 per ottenere una granularità significativa dell'order flow.
- Imposta `CountCandle` in modo conservativo (30–50) sui timeframe più bassi per mantenere gestibili gli oggetti del grafico.
- Questo è uno strumento di analisi — non inserisce ordini e nessun indicatore garantisce profitti. Utilizza sempre un'adeguata gestione del rischio.
Panoramica
Asa Orderflow Footprint è un indicatore professionale di grafici footprint per MetaTrader 5 che renderizza in tempo reale il volume Bid/Ask (o il conteggio dei tick) a ogni livello di prezzo all'interno di ciascuna candela. Sviluppato per i trader di order flow professionisti, va ben oltre un footprint di base aggiungendo l'analisi della migrazione del POC, un pannello di controllo dell'order flow consultabile a colpo d'occhio, il rilevamento degli sbilanciamenti cumulati (stacked imbalances), i marker di assorbimento e le linee di Point of Control non testate (Naked POC) — il tutto all'interno della finestra principale del grafico, senza richiedere sotto-finestre.
Progettato e testato sui feed dell'Oro (XAUUSD), l'indicatore utilizza un motore di classificazione dei tick basato su flag per separare l'attività avviata da compratori e venditori sui feed che forniscono i dati dell'aggressore, e passa automaticamente a una pura analisi del volume per prezzo sui feed che non li forniscono (vedere Note).
Caratteristiche principali
📊 Grafico Footprint (Bid | Ask per cella)
- Mostra il volume lato vendita (Bid) e lato acquisto (Ask) l'uno accanto all'altro a ogni livello di prezzo all'interno di ciascuna candela.
- La dimensione della cella è liberamente regolabile tramite i pulsanti < / > sul grafico — non è necessario riaprire le impostazioni.
- Scegli tra la modalità Conteggio Tick (legacy) o la modalità Volume Reale (volume_real con fallback sul volume standard).
- Griglia di prezzo fissa: le celle non cambiano mai posizione mentre la candela in formazione si aggiorna.
- Il Point of Control (POC) viene evidenziato automaticamente su ogni candela.
🧭 Migrazione del POC (NUOVO)
- Traccia come il POC di ogni candela si sposta rispetto alle barre precedenti — la lettura più pulita di dove si sta effettivamente muovendo il "valore".
- Misurato su tre finestre di look-back configurabili (es. 3 / 5 / 15 barre).
- Rivela istantaneamente un trend sano (il POC sale/scende a gradini), uno stallo (il POC si appiattisce) o una divergenza (il prezzo fa un nuovo massimo/minimo mentre il POC non lo segue).
- Funziona su qualsiasi feed — basato sul volume per prezzo, non sul delta.
📋 Pannello di controllo intelligente / Dashboard (NUOVO)
- Un unico pannello visibile a colpo d'occhio che condensa l'intero flusso d'ordini: osserva la direzione, la convinzione e i livelli chiave in un istante.
- Titolo del bias (Bias headline) — direzione generale derivata dalla migrazione del POC ponderata a breve termine (pesi configurabili), codificata a colori UP (Rialzista) / DOWN (Ribassista) / RANGE (Range).
- Misuratore di convinzione (Conviction meter) — forte / medio / debole, guidato dal volume relativo, per sapere se un movimento è supportato da una reale partecipazione del mercato.
- Misuratore di migrazione del POC — finestre a 3 / 5 / 15 barre con visualizzazione selezionabile: passi netti, conteggi up-down o percentuale.
- Sparkline del percorso del POC — il POC delle ultime barre disegnato come un mini-profilo per leggere la forma della migrazione a colpo d'occhio.
- Lettura del Naked POC — i POC non testati più vicini sopra e sotto il prezzo, con distanza e un'evidenziazione di prossimità quando il prezzo si avvicina.
- Carattere dell'ultima candela — forma del profilo (Profilo a P / a b / equilibrato) e stato di assorbimento (acquisto / vendita).
- Controlli di scala integrati — i pulsanti < / > per la dimensione delle celle sono integrati nel pannello.
- Completamente mobile — posiziona la dashboard in qualsiasi angolo del grafico con un offset X / Y personalizzato; si riposiziona automaticamente ridimensionando il grafico.
🔴🟢 Rilevamento di sbilanciamento e assorbimento
- Candela di assorbimento (Absorption Candle) — segnala le candele in cui il POC del lato dominante è sbilanciato, contrassegnata con un diamante colorato sopra/sotto la barra (verde = lato acquisto, salmone = lato vendita).
- Sbilanciamento diagonale cumulato (Stacked Diagonal Imbalance) — evidenzia livelli di prezzo consecutivi in cui l'Ask domina il Bid una cella più in basso (o viceversa) in base a un rapporto configurabile, colorato con i colori distinti dello sbilanciamento di Acquisto/Vendita.
- La lunghezza del blocco di sbilanciamento e il rapporto sono interamente configurabili (ImbRatio rapporto, righe minime ImbStack).
📌 Linee di POC non testate (Naked POC)
- Disegna automaticamente una linea orizzontale in corrispondenza del Point of Control di ciascuna barra (la cella con il volume combinato Bid+Ask più alto).
- Le linee si estendono verso destra e scompaiono automaticamente non appena il range di una candela successiva tocca quel livello di prezzo.
- Colore, stile e larghezza completamente personalizzabili — fungono da magneti e da supporti/resistenze dinamici.
🎯 Marcatore POC nella candela (NUOVO)
- Marcatore opzionale disegnato all'esatto prezzo del POC, centrato all'interno di ciascuna candela, per scansionare l'intera scala di migrazione sul grafico a colpo d'occhio.
- Simbolo/testo, colore e dimensione del font configurabili.
📋 Linea di riepilogo per candela
- Linea di riepilogo opzionale sotto ogni candela: B: [acquisti] S: [vendite] T: [totale] [delta%].
- Fornisce un contesto istantaneo a colpo d'occhio senza dover leggere le singole celle.
🔔 Avvisi intelligenti (Alert)
- Avvisi pop-up e/o notifiche push per:
- Allineamento della migrazione del POC — si attiva quando le finestre 3 / 5 / 15 concordano tutte sulla direzione (un segnale di trend forte) (NUOVO).
- Rilevamento candela di sbilanciamento / assorbimento.
- Inversione del segno del Delta sulla barra appena chiusa (sui feed con dati dell'aggressore).
- Gli avvisi si attivano una sola volta per candela chiusa — nessun flood ripetitivo a ogni tick.
⚡ Prestazioni ottimizzate
- Ricalcolo incrementale: solo la candela in formazione (shift 0) viene ricalcolata a ogni tick; tutte le candele storiche vengono disegnate una sola volta all'apertura della barra.
- Riutilizzo degli oggetti: gli oggetti del grafico vengono aggiornati direttamente sul posto invece di essere eliminati e ricreati, mantenendo basso l'uso della CPU anche con oltre 100 candele visualizzate.
- I calcoli pesanti (scansione dei naked-POC, migrazione) vengono eseguiti alla chiusura della barra; solo il volume relativo e la prossimità si aggiornano intratick.
Parametri di input
Principali (Main)
- ShowFootprint — Mostra/nascondi il testo delle celle del footprint.
- ShowSummary — Mostra la linea di riepilogo B/S/Total/Delta% per candela.
- TPointScale — Dimensione iniziale della cella (in punti); regolabile in tempo reale con i pulsanti della dashboard.
- CountMode — Valore della cella = conteggio tick o volume reale.
- OFPercent — Soglia della candela di assorbimento (%).
- CountCandle — Numero di candele da renderizzare (fino a 100).
- FontSize — Dimensione del font del testo della cella.
- MBidColor / MAskColor — Colore di evidenziazione per le celle di Bid max / Ask max.
- sameColor — Colore quando il Bid max e l'Ask max si trovano sulla stessa cella.
- NormalColor / BlankDataColor — Colori per celle normali e vuote.
Sbilanciamento (Imbalance)
- ShowAbsorbCandle — Mostra i marker a diamante della candela di assorbimento.
- ShowImbalance — Abilita l'evidenziazione dello sbilanciamento diagonale cumulato.
- ImbRatio — Rapporto Ask/Bid minimo per segnalare una cella in sbilanciamento diagonale.
- ImbStack — Minimo di celle in sbilanciamento consecutive richiesto per evidenziare la zona.
- ImbBuyColor / ImbSellColor — Colori di evidenziazione della zona di sbilanciamento di acquisto/vendita.
Avvisi (Alert)
- AlertPopup / AlertPush — Abilita avvisi pop-up / notifiche push.
- AlertOnImb / AlertOnFlip — Trigger dell'avviso: candela di sbilanciamento / inversione del delta.
Linee di POC non testate (Naked POC lines)
- ShowPOC — Mostra le linee di estensione dei POC non testati.
- POCColor / POCStyle / POCWidth — Impostazioni dell'aspetto della linea POC.
Marcatore POC nella candela (POC marker in candle)
- ShowPOCInCandle — Mostra il marcatore POC centrato all'interno della candela.
- POCInText — Simbolo/testo del marcatore.
- POCInColor — Colore del marcatore.
- POCInFontSize — Dimensione del font del marcatore.
Pannello di controllo (Dashboard)
- ShowDashboard — Mostra/nascondi la dashboard dell'order flow.
- DashCorner — Angolo della dashboard (uno qualsiasi dei 4 angoli).
- DashX / DashY — Offset della dashboard dall'angolo (pixel).
- MigMode — Visualizzazione della cella di migrazione: passi netti / up-down / percentuale.
- MigW1 / MigW2 / MigW3 — Finestre di look-back della migrazione del POC (barre), di default 3 / 5 / 15.
- BiasWgt1 / BiasWgt2 / BiasWgt3 — Ponderazione del bias per finestra (ponderata a breve termine di default, 3 / 2 / 1).
- RelVolPeriod — Periodo di media del volume relativo (barres).
- RelVolStrong / RelVolMedium — Soglie del volume relativo per convinzione forte / media.
- ProximityPts — Distanza (punti) alla quale un POC non testato conta come "vicino".
- AlertOnAlign — Avviso quando le 3 finestre di migrazione si allineano tutte.
Istruzioni per l'uso
1. Collega l'indicatore a qualsiasi grafico e timeframe (consigliato XAUUSD M1).
2. Utilizza i pulsanti < > nel piè di pagina della dashboard per aumentare o diminuire la dimensione della cella finché ogni barra non mostra un numero leggibile di righe di prezzo.
3. Leggi prima la Dashboard: il titolo Bias fornisce la direzione + la convinzione; il misuratore di migrazione 3 / 5 / 15 e il percorso del POC mostrano se il trend è sano, in stallo o in divergenza.
4. Fai trading seguendo la migrazione — entra sui rintracciamenti verso il POC di una candela precedente o verso un livello di Naked POC che tiene; monitora le inversioni quando la migrazione si ferma/diverge o quando un diamante di assorbimento si stampa contro il trend.
5. Monitora la lettura del Naked POC per individuare i livelli ad alto volume non testati più vicini sopra/sotto — target naturali e zone di reazione.
6. Presta attenzione alle zone evidenziate in ciano (sbilanciamento di acquisto cumulato) e in magenta (sbilanciamento di vendita cumulato) come potenziali cluster di ordini istituzionali.
7. Abilita gli Avvisi per ricevere notifiche sull'allineamento della migrazione, sulle candele di sbilanciamento/assorbimento o sulle inversioni del delta senza dover monitorare costantemente lo schermo.
Note e requisiti
- Richiede un broker che fornisca lo storico dei tick tramite `CopyTicksRange()` — la maggior parte dei broker ECN/STP su MT5 soddisfa questo requisito.
- Le funzionalità basate sul Delta (% di Delta, alert di inversione del delta e CVD ove applicabile) richiedono un feed che contrassegni i tick in base al lato dell'aggressore (Bid/Ask). Alcuni conti — comuni su determinati feed CFD — inviano tick combinati Bid+Ask, il che rende la lettura del Delta ≈ 0. Su tali feed, l'indicatore funziona comunque pienamente attraverso i suoi strumenti di Volume per prezzo, POC, Migrazione del POC, Naked POC e Volume relativo, che non dipendono dai dati dell'aggressore.
- La modalità Volume Reale richiede che il broker fornisca `volume_real` nei dati dei tick; l'indicatore ripiega automaticamente sul volume del tick se non disponibile.
- Si raccomanda l'esecuzione su timeframe da M1 a H1 per ottenere una granularità significativa dell'order flow.
- Imposta `CountCandle` in modo conservativo (30–50) sui timeframe più bassi per mantenere gestibili gli oggetti del grafico.
- Questo è uno strumento di analisi — non inserisce ordini e nessun indicatore garantisce profitti. Utilizza sempre un'adeguata gestione del rischio.


Hello , i have bought your indicator but i cant use it properly because the data are not properly in line the same way as i can see it on your video datas frome previous candlestictk are mixed with data from the second candlestick even when i change the scale and this hapen no matter the TF i use , can you please share the seeting you used on your video ?? it could help a lot for your user :) plus , i see on your video , do you use your indicator on algotrading ?