Orderflow Footprint
- Indicateurs
-
Panthita Aichoi
 BTC Wallet :
bc1qx685px03km775uapdvje8qz6t839g3fzt0gegv
ETH ERC20
USDT Address:
0x57cF049c965fbE4D25bD2a9aE02B27a04F5574F9 - Version: 3.3
- Mise à jour: 3 juin 2026
- Activations: 5
Asa Orderflow Footprint v3 — Description du produit
Aperçu
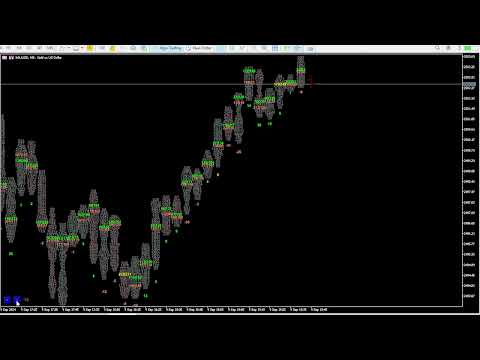
Asa Orderflow Footprint est un indicateur professionnel de graphiques footprint pour MetaTrader 5 qui affiche en temps réel le volume Bid/Ask (ou le nombre de ticks) à chaque niveau de prix à l'intérieur de chaque bougie. Conçu pour les traders de flux d'ordres (order flow) sérieux, il va bien au-delà d'un footprint basique en ajoutant l'analyse de la migration du POC, un tableau de bord d'order flow accessible en un coup d'œil, la détection des déséquilibres empilés (stacked imbalances), des marqueurs d'absorption et des lignes de Point de Contrôle non testées (Naked POC) — le tout directement dans la fenêtre principale du graphique, sans qu'aucune sous-fenêtre ne soit requise.
Conçu et testé sur les flux de l'Or (XAUUSD), l'indicateur utilise un moteur de classification des ticks basé sur des drapeaux (flags) pour séparer l'activité initiée par les acheteurs et les vendeurs sur les flux qui fournissent des données d'agresseur, et bascule automatiquement sur une analyse pure du volume par prix sur les flux qui n'en fournissent pas (voir Notes).
Caractéristiques clés
📊 Graphique Footprint (Bid | Ask per cellule)
- Affiche le volume côté vendeur (Bid) et côté acheteur (Ask) côte à côte à chaque niveau de prix à l'intérieur de chaque bougie.
- La taille des cellules est librement ajustable via les boutons < / > sur le graphique — pas besoin de rouvrir les paramètres.
- Choisissez entre le mode Nombre de Ticks (historique) ou le mode Volume Réel (volume_real avec bascule automatique sur volume standard si non disponible).
- Grille de prix fixe : les cellules ne changent jamais de position pendant la mise à jour de la bougie en cours de formation.
- Le Point de Contrôle (POC) est automatiquement mis en évidence sur chaque bougie.
🧭 Migration du POC (NOUVEAU)
- Suit la façon dont le POC de chaque bougie se déplace par rapport aux barres précédentes — la lecture la plus claire de l'endroit où la "valeur" se déplace réellement.
- Mesuré sur trois fenêtres d'analyse historique configurables (ex: 3 / 5 / 15 barres).
- Révèle instantanément une tendance saine (POC qui monte/descend en escalier), un essoufflement (POC qui s'aplatit) ou une divergence (le prix fait un nouveau plus haut/plus bas alors que le POC ne suit pas).
- Fonctionne sur n'importe quel flux — basé sur le volume par prix, non sur le delta.
📋 Tableau de bord intelligent (NOUVEAU)
- Un panneau unique et lisible d'un coup d'œil qui distille l'ensemble du flux d'ordres : observez la direction, la conviction et les niveaux clés immédiatement.
- Titre du biais (Bias headline) — direction générale basée sur la migration du POC pondérée à court terme (poids configurables), avec un code couleur UP (Haussier) / DOWN (Baissier) / RANGE (Range).
- Indicateur de conviction (Conviction meter) — forte / moyenne / faible, déterminé par le volume relatif, pour que vous sachiez si un mouvement est soutenu par une réelle participation du marché.
- Indicateur de migration du POC — fenêtres de 3 / 5 / 15 barres avec affichage sélectionnable : étapes nettes, décompte haussier/baissier ou pourcentage.
- Sparkline du suivi du POC — le POC des dernières barres dessiné sous forme de mini-profil pour lire la forme de la migration en un coup d'œil.
- Lecture du Naked POC — les POC non testés les plus proches au-dessus et au-dessous du prix, avec la distance et une mise en évidence de proximité lorsque le prix s'en approche.
- Caractère de la dernière bougie — forme du profil (Profil en P / en b / équilibré) et état d'absorption (achat / vente).
- Contrôles d'échelle intégrés — les boutons < / > de taille de cellule sont discrètement intégrés au bas du panneau.
- Entièrement mobile — placez le tableau de bord dans n'importe quel coin du graphique avec un décalage X / Y personnalisé ; repositionnement automatique lors du redimensionnement du graphique.
🔴🟢 Détection des déséquilibres et des absorptions
- Bougie d'absorption (Absorption Candle) — signale les bougies où le POC du côté dominant est biaisé, marqué par un losange coloré au-dessus/au-dessous de la barre (vert = côté acheteur, saumon = côté vendeur).
- Déséquilibre diagonal empilé (Stacked Diagonal Imbalance) — met en évidence les niveaux de prix consécutifs où l'Ask domine le Bid une cellule plus bas (ou vice versa) selon un ratio configurable, coloré avec des couleurs distinctes de déséquilibre d'Achat/Vente.
- La longueur de l'empilement et le ratio de déséquilibre sont entièrement configurables (ImbRatio ratio, lignes minimales ImbStack).
📌 Lignes de POC vierges (Naked POC)
- Dessine automatiquement une ligne horizontale au Point de Contrôle de chaque barre (cellule ayant le volume combiné Bid+Ask le plus élevé).
- Les lignes s'étendent vers la droite et disparaissent automatiquement dès que le range d'une bougie ultérieure touche ce niveau de prix.
- Couleur, style et largeur entièrement personnalisables — agissent comme des aimants et des supports/résistances dynamiques.
🎯 Marqueur de POC dans la bougie (NOUVEAU)
- Marqueur optionnel dessiné au prix exact du POC, centré à l'intérieur de chaque bougie, pour vous permettre de scanner d'un coup d'œil tout l'escalier de migration sur le graphique.
- Symbole/texte, couleur et taille de police configurables.
📋 Ligne de résumé par bougie
- Ligne de résumé optionnelle sous chaque bougie : B: [achats] S: [ventes] T: [total] [delta%].
- Donne un contexte instantané en un coup d'œil sans avoir à lire les cellules individuelles.
🔔 Alertes intelligentes
- Fenêtres contextuelles (Popup) et/ou notifications push pour :
- Alignement de la migration du POC — se déclenche lorsque les fenêtres 3 / 5 / 15 s'accordent toutes sur la direction (un signal de tendance forte) (NOUVEAU).
- Détection de déséquilibre / bougie d'absorption.
- Inversion du signe du Delta sur la barre qui vient de se clôturer (sur les flux avec données d'agresseur).
- Les alertes se déclenchent une seule fois par bougie clôturée — pas de spam répétitif à chaque tick.
⚡ Performance optimisée
- Recalcul incrémental : seule la bougie en cours de formation (shift 0) est recalculée à chaque tick ; toutes les bougies historiques sont dessinées une seule fois à l'ouverture de la barre.
- Réutilisation des objets : les objets du graphique sont mis à jour sur place plutôt que supprimés et recréés, maintenant une faible utilisation du CPU même avec plus de 100 bougies affichées.
- Les calculs lourds (scan des naked-POC, migration) s'exécutent à la clôture de la barre ; seuls le volume relatif et la proximité se mettent à jour intratick.
Paramètres d'entrée
Principaux (Main)
- ShowFootprint — Afficher/masquer le texte des cellules du footprint.
- ShowSummary — Afficher la ligne de résumé B/S/Total/Delta% sous la bougie.
- TPointScale — Taille initiale de la cellule (en points) ; ajustable en direct avec les boutons du tableau de bord.
- CountMode — Valeur de la cellule = nombre de ticks ou volume réel.
- OFPercent — Seuil de la bougie d'absorption (%).
- CountCandle — Nombre de bougies à afficher (jusqu'à 100).
- FontSize — Taille de la police du texte de la cellule.
- MBidColor / MAskColor — Couleur de mise en évidence pour las cellules de Bid max / Ask max.
- sameColor — Couleur lorsque le Bid max et l'Ask max sont sur la même cellule.
- NormalColor / BlankDataColor — Couleurs pour les cellules normales et vides.
Déséquilibre (Imbalance)
- ShowAbsorbCandle — Afficher losanges marqueurs de bougie d'absorption.
- ShowImbalance — Activer la mise en évidence des déséquilibres diagonaux empilés.
- ImbRatio — Ratio Ask/Bid minimum pour signaler une cellule en déséquilibre diagonal.
- ImbStack — Minimum de cellules en déséquilibre consécutives requis pour mettre en évidence la zone.
- ImbBuyColor / ImbSellColor — Couleurs de mise en évidence de la zone de déséquilibre d'achat/vente.
Alerte (Alert)
- AlertPopup / AlertPush — Activer les alertes contextuelles / notifications push.
- AlertOnImb / AlertOnFlip — Déclencheur d'alerte : bougie de déséquilibre / retournement du delta.
Lignes de POC vierges (Naked POC lines)
- ShowPOC — Afficher les lignes d'extension des POC vierges.
- POCColor / POCStyle / POCWidth — Paramètres d'apparence de la ligne POC.
Marqueur de POC dans la bougie (POC marker in candle)
- ShowPOCInCandle — Afficher le marqueur de POC centré dans la bougie.
- POCInText — Symbole/texte du marqueur.
- POCInColor — Couleur du marqueur.
- POCInFontSize — Taille de la police du marqueur.
Tableau de bord (Dashboard)
- ShowDashboard — Afficher/masquer le tableau de bord d'order flow.
- DashCorner — Coin du tableau de bord (l'un des 4 coins).
- DashX / DashY — Décalage du tableau de bord par rapport au coin (pixels).
- MigMode — Affichage de la cellule de migration : étapes nettes / hausse-baisse / pourcentage.
- MigW1 / MigW2 / MigW3 — Fenêtres de recherche de migration de POC (barres), par défaut 3 / 5 / 15.
- BiasWgt1 / BiasWgt2 / BiasWgt3 — Pondération du biais par fenêtre (pondérée à court terme par défaut, 3 / 2 / 1).
- RelVolPeriod — Période de moyenne du volume relatif (barres).
- RelVolStrong / RelVolMedium — Seuils de volume relatif pour une conviction forte / moyenne.
- ProximityPts — Distance (points) à laquelle un POC vierge est considéré comme "proche".
- AlertOnAlign — Alerte lorsque les 3 fenêtres de migration s'alignent.
Comment l'utiliser
1. Attachez l'indicateur à n'importe quel graphique et unité de temps (XAUUSD M1 recommandé).
2. Utilisez les boutons < > dans le pied de page du tableau de bord pour augmenter ou diminuer la taille des cellules jusqu'à ce que chaque barre affiche un nombre lisible de lignes de prix.
3. Lisez d'abord le Tableau de bord : le titre Bias donne la direction + la conviction ; l'indicateur de migration 3 / 5 / 15 et le suivi du POC montrent si la tendance est saine, s'aplatit ou diverge.
4. Tradez avec la migration — entrez sur les replis vers le POC d'une bougie précédente ou vers un niveau de Naked POC qui tient ; surveillez les retournements lorsque la migration cale/diverge ou lorsqu'un losange d'absorption s'imprime contre la tendance.
5. Surveillez la lecture du Naked POC pour connaître les niveaux de fort volume non testés les plus proches au-dessus/au-dessous — des objectifs naturels et des zones de réaction.
6. Surveillez les zones surlignées en cyan (déséquilibre d'achat empilé) et en magenta (déséquilibre de vente empilé) comme de potentiels clusters d'ordres institutionnels.
7. Activez les Alertes pour être informé de l'alignement de la migration, des bougies de déséquilibre/absorption ou des retournements de delta sans avoir à surveiller l'écran en permanence.
Notes & Exigences
- Nécessite un courtier qui fournit l'historique des ticks via `CopyTicksRange()` — la plupart des courtiers ECN/STP sur MT5 se qualifient.
- Les fonctionnalités basées sur le Delta (% du Delta, alerte de retournement du delta et CVD le cas échéant) nécessitent un flux qui identifie les ticks par côté d'agresseur (Bid/Ask). Certains comptes — courants sur certains flux de CFD — envoient des ticks combinés Bid+Ask, ce qui rend la lecture du Delta ≈ 0. Sur ces flux, l'indicateur fonctionne toujours pleinement via ses outils de Volume par prix, de POC, de Migration du POC, de Naked POC et de Volume relatif, qui ne dépendent pas des données d'agresseur.
- Le mode Volume Réel exige que le courtier fournisse `volume_real` dans les données de ticks ; l'indicateur revient automatiquement au volume de tick s'il n'est pas disponible.
- Il est recommandé de l'exécuter sur des unités de temps de M1 à H1 pour obtenir une granularité significative du flux d'ordres.
- Configurez `CountCandle` de manière conservatrice (30–50) sur les petites unités de temps afin de garder les objets du graphique gérables.
- Il s'agit d'un outil d'analyse — il ne passe pas d'ordres, et aucun indicateur ne garantit de profit. Utilisez toujours une gestion des risques appropriée.
Aperçu
Asa Orderflow Footprint est un indicateur professionnel de graphiques footprint pour MetaTrader 5 qui affiche en temps réel le volume Bid/Ask (ou le nombre de ticks) à chaque niveau de prix à l'intérieur de chaque bougie. Conçu pour les traders de flux d'ordres (order flow) sérieux, il va bien au-delà d'un footprint basique en ajoutant l'analyse de la migration du POC, un tableau de bord d'order flow accessible en un coup d'œil, la détection des déséquilibres empilés (stacked imbalances), des marqueurs d'absorption et des lignes de Point de Contrôle non testées (Naked POC) — le tout directement dans la fenêtre principale du graphique, sans qu'aucune sous-fenêtre ne soit requise.
Conçu et testé sur les flux de l'Or (XAUUSD), l'indicateur utilise un moteur de classification des ticks basé sur des drapeaux (flags) pour séparer l'activité initiée par les acheteurs et les vendeurs sur les flux qui fournissent des données d'agresseur, et bascule automatiquement sur une analyse pure du volume par prix sur les flux qui n'en fournissent pas (voir Notes).
Caractéristiques clés
📊 Graphique Footprint (Bid | Ask per cellule)
- Affiche le volume côté vendeur (Bid) et côté acheteur (Ask) côte à côte à chaque niveau de prix à l'intérieur de chaque bougie.
- La taille des cellules est librement ajustable via les boutons < / > sur le graphique — pas besoin de rouvrir les paramètres.
- Choisissez entre le mode Nombre de Ticks (historique) ou le mode Volume Réel (volume_real avec bascule automatique sur volume standard si non disponible).
- Grille de prix fixe : les cellules ne changent jamais de position pendant la mise à jour de la bougie en cours de formation.
- Le Point de Contrôle (POC) est automatiquement mis en évidence sur chaque bougie.
🧭 Migration du POC (NOUVEAU)
- Suit la façon dont le POC de chaque bougie se déplace par rapport aux barres précédentes — la lecture la plus claire de l'endroit où la "valeur" se déplace réellement.
- Mesuré sur trois fenêtres d'analyse historique configurables (ex: 3 / 5 / 15 barres).
- Révèle instantanément une tendance saine (POC qui monte/descend en escalier), un essoufflement (POC qui s'aplatit) ou une divergence (le prix fait un nouveau plus haut/plus bas alors que le POC ne suit pas).
- Fonctionne sur n'importe quel flux — basé sur le volume par prix, non sur le delta.
📋 Tableau de bord intelligent (NOUVEAU)
- Un panneau unique et lisible d'un coup d'œil qui distille l'ensemble du flux d'ordres : observez la direction, la conviction et les niveaux clés immédiatement.
- Titre du biais (Bias headline) — direction générale basée sur la migration du POC pondérée à court terme (poids configurables), avec un code couleur UP (Haussier) / DOWN (Baissier) / RANGE (Range).
- Indicateur de conviction (Conviction meter) — forte / moyenne / faible, déterminé par le volume relatif, pour que vous sachiez si un mouvement est soutenu par une réelle participation du marché.
- Indicateur de migration du POC — fenêtres de 3 / 5 / 15 barres avec affichage sélectionnable : étapes nettes, décompte haussier/baissier ou pourcentage.
- Sparkline du suivi du POC — le POC des dernières barres dessiné sous forme de mini-profil pour lire la forme de la migration en un coup d'œil.
- Lecture du Naked POC — les POC non testés les plus proches au-dessus et au-dessous du prix, avec la distance et une mise en évidence de proximité lorsque le prix s'en approche.
- Caractère de la dernière bougie — forme du profil (Profil en P / en b / équilibré) et état d'absorption (achat / vente).
- Contrôles d'échelle intégrés — les boutons < / > de taille de cellule sont discrètement intégrés au bas du panneau.
- Entièrement mobile — placez le tableau de bord dans n'importe quel coin du graphique avec un décalage X / Y personnalisé ; repositionnement automatique lors du redimensionnement du graphique.
🔴🟢 Détection des déséquilibres et des absorptions
- Bougie d'absorption (Absorption Candle) — signale les bougies où le POC du côté dominant est biaisé, marqué par un losange coloré au-dessus/au-dessous de la barre (vert = côté acheteur, saumon = côté vendeur).
- Déséquilibre diagonal empilé (Stacked Diagonal Imbalance) — met en évidence les niveaux de prix consécutifs où l'Ask domine le Bid une cellule plus bas (ou vice versa) selon un ratio configurable, coloré avec des couleurs distinctes de déséquilibre d'Achat/Vente.
- La longueur de l'empilement et le ratio de déséquilibre sont entièrement configurables (ImbRatio ratio, lignes minimales ImbStack).
📌 Lignes de POC vierges (Naked POC)
- Dessine automatiquement une ligne horizontale au Point de Contrôle de chaque barre (cellule ayant le volume combiné Bid+Ask le plus élevé).
- Les lignes s'étendent vers la droite et disparaissent automatiquement dès que le range d'une bougie ultérieure touche ce niveau de prix.
- Couleur, style et largeur entièrement personnalisables — agissent comme des aimants et des supports/résistances dynamiques.
🎯 Marqueur de POC dans la bougie (NOUVEAU)
- Marqueur optionnel dessiné au prix exact du POC, centré à l'intérieur de chaque bougie, pour vous permettre de scanner d'un coup d'œil tout l'escalier de migration sur le graphique.
- Symbole/texte, couleur et taille de police configurables.
📋 Ligne de résumé par bougie
- Ligne de résumé optionnelle sous chaque bougie : B: [achats] S: [ventes] T: [total] [delta%].
- Donne un contexte instantané en un coup d'œil sans avoir à lire les cellules individuelles.
🔔 Alertes intelligentes
- Fenêtres contextuelles (Popup) et/ou notifications push pour :
- Alignement de la migration du POC — se déclenche lorsque les fenêtres 3 / 5 / 15 s'accordent toutes sur la direction (un signal de tendance forte) (NOUVEAU).
- Détection de déséquilibre / bougie d'absorption.
- Inversion du signe du Delta sur la barre qui vient de se clôturer (sur les flux avec données d'agresseur).
- Les alertes se déclenchent une seule fois par bougie clôturée — pas de spam répétitif à chaque tick.
⚡ Performance optimisée
- Recalcul incrémental : seule la bougie en cours de formation (shift 0) est recalculée à chaque tick ; toutes les bougies historiques sont dessinées une seule fois à l'ouverture de la barre.
- Réutilisation des objets : les objets du graphique sont mis à jour sur place plutôt que supprimés et recréés, maintenant une faible utilisation du CPU même avec plus de 100 bougies affichées.
- Les calculs lourds (scan des naked-POC, migration) s'exécutent à la clôture de la barre ; seuls le volume relatif et la proximité se mettent à jour intratick.
Paramètres d'entrée
Principaux (Main)
- ShowFootprint — Afficher/masquer le texte des cellules du footprint.
- ShowSummary — Afficher la ligne de résumé B/S/Total/Delta% sous la bougie.
- TPointScale — Taille initiale de la cellule (en points) ; ajustable en direct avec les boutons du tableau de bord.
- CountMode — Valeur de la cellule = nombre de ticks ou volume réel.
- OFPercent — Seuil de la bougie d'absorption (%).
- CountCandle — Nombre de bougies à afficher (jusqu'à 100).
- FontSize — Taille de la police du texte de la cellule.
- MBidColor / MAskColor — Couleur de mise en évidence pour las cellules de Bid max / Ask max.
- sameColor — Couleur lorsque le Bid max et l'Ask max sont sur la même cellule.
- NormalColor / BlankDataColor — Couleurs pour les cellules normales et vides.
Déséquilibre (Imbalance)
- ShowAbsorbCandle — Afficher losanges marqueurs de bougie d'absorption.
- ShowImbalance — Activer la mise en évidence des déséquilibres diagonaux empilés.
- ImbRatio — Ratio Ask/Bid minimum pour signaler une cellule en déséquilibre diagonal.
- ImbStack — Minimum de cellules en déséquilibre consécutives requis pour mettre en évidence la zone.
- ImbBuyColor / ImbSellColor — Couleurs de mise en évidence de la zone de déséquilibre d'achat/vente.
Alerte (Alert)
- AlertPopup / AlertPush — Activer les alertes contextuelles / notifications push.
- AlertOnImb / AlertOnFlip — Déclencheur d'alerte : bougie de déséquilibre / retournement du delta.
Lignes de POC vierges (Naked POC lines)
- ShowPOC — Afficher les lignes d'extension des POC vierges.
- POCColor / POCStyle / POCWidth — Paramètres d'apparence de la ligne POC.
Marqueur de POC dans la bougie (POC marker in candle)
- ShowPOCInCandle — Afficher le marqueur de POC centré dans la bougie.
- POCInText — Symbole/texte du marqueur.
- POCInColor — Couleur du marqueur.
- POCInFontSize — Taille de la police du marqueur.
Tableau de bord (Dashboard)
- ShowDashboard — Afficher/masquer le tableau de bord d'order flow.
- DashCorner — Coin du tableau de bord (l'un des 4 coins).
- DashX / DashY — Décalage du tableau de bord par rapport au coin (pixels).
- MigMode — Affichage de la cellule de migration : étapes nettes / hausse-baisse / pourcentage.
- MigW1 / MigW2 / MigW3 — Fenêtres de recherche de migration de POC (barres), par défaut 3 / 5 / 15.
- BiasWgt1 / BiasWgt2 / BiasWgt3 — Pondération du biais par fenêtre (pondérée à court terme par défaut, 3 / 2 / 1).
- RelVolPeriod — Période de moyenne du volume relatif (barres).
- RelVolStrong / RelVolMedium — Seuils de volume relatif pour une conviction forte / moyenne.
- ProximityPts — Distance (points) à laquelle un POC vierge est considéré comme "proche".
- AlertOnAlign — Alerte lorsque les 3 fenêtres de migration s'alignent.
Comment l'utiliser
1. Attachez l'indicateur à n'importe quel graphique et unité de temps (XAUUSD M1 recommandé).
2. Utilisez les boutons < > dans le pied de page du tableau de bord pour augmenter ou diminuer la taille des cellules jusqu'à ce que chaque barre affiche un nombre lisible de lignes de prix.
3. Lisez d'abord le Tableau de bord : le titre Bias donne la direction + la conviction ; l'indicateur de migration 3 / 5 / 15 et le suivi du POC montrent si la tendance est saine, s'aplatit ou diverge.
4. Tradez avec la migration — entrez sur les replis vers le POC d'une bougie précédente ou vers un niveau de Naked POC qui tient ; surveillez les retournements lorsque la migration cale/diverge ou lorsqu'un losange d'absorption s'imprime contre la tendance.
5. Surveillez la lecture du Naked POC pour connaître les niveaux de fort volume non testés les plus proches au-dessus/au-dessous — des objectifs naturels et des zones de réaction.
6. Surveillez les zones surlignées en cyan (déséquilibre d'achat empilé) et en magenta (déséquilibre de vente empilé) comme de potentiels clusters d'ordres institutionnels.
7. Activez les Alertes pour être informé de l'alignement de la migration, des bougies de déséquilibre/absorption ou des retournements de delta sans avoir à surveiller l'écran en permanence.
Notes & Exigences
- Nécessite un courtier qui fournit l'historique des ticks via `CopyTicksRange()` — la plupart des courtiers ECN/STP sur MT5 se qualifient.
- Les fonctionnalités basées sur le Delta (% du Delta, alerte de retournement du delta et CVD le cas échéant) nécessitent un flux qui identifie les ticks par côté d'agresseur (Bid/Ask). Certains comptes — courants sur certains flux de CFD — envoient des ticks combinés Bid+Ask, ce qui rend la lecture du Delta ≈ 0. Sur ces flux, l'indicateur fonctionne toujours pleinement via ses outils de Volume par prix, de POC, de Migration du POC, de Naked POC et de Volume relatif, qui ne dépendent pas des données d'agresseur.
- Le mode Volume Réel exige que le courtier fournisse `volume_real` dans les données de ticks ; l'indicateur revient automatiquement au volume de tick s'il n'est pas disponible.
- Il est recommandé de l'exécuter sur des unités de temps de M1 à H1 pour obtenir une granularité significative du flux d'ordres.
- Configurez `CountCandle` de manière conservatrice (30–50) sur les petites unités de temps afin de garder les objets du graphique gérables.
- Il s'agit d'un outil d'analyse — il ne passe pas d'ordres, et aucun indicateur ne garantit de profit. Utilisez toujours une gestion des risques appropriée.


Hello , i have bought your indicator but i cant use it properly because the data are not properly in line the same way as i can see it on your video datas frome previous candlestictk are mixed with data from the second candlestick even when i change the scale and this hapen no matter the TF i use , can you please share the seeting you used on your video ?? it could help a lot for your user :) plus , i see on your video , do you use your indicator on algotrading ?