Orderflow Footprint
- インディケータ
-
Panthita Aichoi
 BTC Wallet :
bc1qx685px03km775uapdvje8qz6t839g3fzt0gegv
ETH ERC20
USDT Address:
0x57cF049c965fbE4D25bD2a9aE02B27a04F5574F9 - バージョン: 3.3
- アップデート済み: 3 6月 2026
- アクティベーション: 5
Asa Orderflow Footprint v3 — 製品説明書
概要
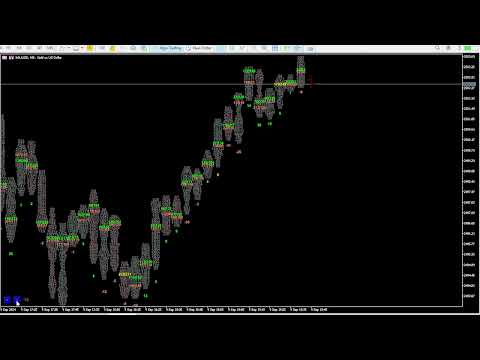
Asa Orderflow Footprintは、MetaTrader 5向けに開発されたプロフェッショナル仕様のフットプリントチャートインジケーターです。各ローソク足の内部におけるすべての価格レベルで、リアルタイムのBid/Askボリューム(またはティック数)をレンダリングします。本格的なオーダーフロー(注文流)トレーダー向けに設計されており、通常のフットプリントの枠を超え、POC(Point of Control)の移動分析、一目でわかるオーダーフローダッシュボード、スタックド・インバランス(積み重なった不均衡)検出、アブソープション(吸収)フラグ、未テストのPOC(Naked POC)ラインなど、多彩な機能をメインチャートウィンドウ内に集約(サブウィンドウ不要)しています。
ゴールド(XAUUSD)のデータフィードで設計・テストされており、アグレッサー(仕掛け側)データを提供するフィードではフラグベースのティック分類エンジンによって買い手主導と売り手主導の活動を分離し、データがないフィードでは純粋な価格帯別出来高(Volume-by-Price)分析へスムーズに切り替わります(注意書き参照)。
主な機能
📊 フットプリントチャート(セルごとにBid | Askを表示)
- 各ローソク足内の価格バケットごとに、売り側(Bid)と買い側(Ask)のボリュームを並べて表示。
- セルサイズはチャート上の < / > ボタンでいつでも調整可能(設定画面を開き直す必要はありません)。
- ティック数モード(レガシー)またはリアルボリュームモード(volume_real。取得不可時は通常の出来高へ自動切り替え)を選択可能。
- 固定グリッドの価格バケット:形成中のバーが更新されている間も、セルの位置がずれることはありません。
- ローソク足ごとのPOC(最大出来高価格帯)を自動的にハイライト。
🧭 POC移動分析(新機能)
- 各ローソク足のPOCが前のバーに対してどのようにシフトしたかを追跡。市場の「価値(バリュー)」が実際にどこへ動いているかを最もクリアに読み取ることができます。
- 設定可能な3つのルックバック期間(例:3 / 5 / 15バー)で測定。
- 健全なトレンド(POCが階段状に上昇/下落)、失速(POCの平坦化)、またはダイバージェンス(価格は新高値/新安値を更新しているがPOCが追随していない)を瞬時に判別。
- デルタではなく価格帯別出来高に基づいているため、あらゆるフィードで動作します。
📋 スマートダッシュボード(新機能)
- オーダーフロー全体を凝縮した、一目で状況が把握できるパネル。方向性、モメンタム、主要なレベルを瞬時に確認できます。
- バイアス・ヘッドライン(Bias headline) — 短期的な重み付け(設定可能)を施したPOC移動から算出される全体の方向性を、UP / DOWN / RANGE でカラーコード表示。
- コンヴィクション・メーター(Conviction meter) — 相対ボリュームから算出される買い/売りの確信度(強い / 中程度 / 弱い)。その動きに本物の市場参加者が伴っているかがわかります。
- POC移動メーター — 3 / 5 / 15バーの期間。ネットステップ(純移動歩数)、上昇・下落カウント、またはパーセンテージから表示選択可能。
- POCトレイル・スパークライン — 直近数本のバーのPOCをミニプロファイルとして描画し、移動の形状を視覚的に把握。
- Naked POC読み取り — 現在価格の上限・下限に位置する最も近い未テストのPOCを表示。距離および価格接近時のハイライト機能を搭載。
- 直近ローソク足の特性 — プロファイル形状(P型 / b型 / バランス型)およびアブソープション状態(買い / 売り)。
- スケールコントロール内蔵 — セルサイズを調整する < / > ボタンがパネル下部にすっきりと収納されています。
- 自由な配置変更 — ダッシュボードはカスタムX / Yオフセットによりチャートの任意の四隅に配置可能。チャートサイズ変更時も自動で再配置されます。
🔴🟢 インバランス&アブソープション(不均衡と吸収)検出
- アブソープション・キャンドル — 主導権を握る側のPOCが偏っているローソク足を検出し、バーの上下にカラーのひし形マーク(緑 = 買い側、サーモン = 売り側)を表示。
- スタックド・ダイアゴナル・インバランス — 1セル下のBidに対してAskが設定比率以上で圧倒している(またはその逆)連続した価格レベルをハイライト。買い/売りの固有のインバランスカラーで着色。
- インバランスのスタック数および比率は完全に設定可能(ImbRatio比率、ImbStack最小行数)。
📌 Naked POC(未テストPOC)ライン
- 各バーのPoint of Control(Bid+Askの合計が最大のセル)に水平線を自動的に描画。
- ラインは右側へ延長され、後続のローソク足の実体やヒゲがその価格レベルに接触すると自動的に消失します。
- 色、スタイル、幅を完全にカスタマイズ可能。価格を引きつけるマグネットや、動的なサポート/レジスタンスとして機能します。
🎯 ローソク足内POCマーカー(新機能)
- 各ローソク足の正確なPOC価格の中心に描画されるオプションのマーカー。チャート全体の移動の階段を一目でスキャンできます。
- 記号/テキスト、色、フォントサイズを設定可能。
📋 ローソク足ごとのサマリーライン
- 各ローソク足の下部に表示可能な1行のサマリー:B: [買い] S: [売り] T: [合計] [デルタ%]。
- 個々のセルを読み込むことなく、瞬時に大まかな背景を把握。
🔔 スマートアラート
- 以下の条件でポップアップおよび/またはプッシュ通知アラートを送信:
- POC移動の整列 — 3 / 5 / 15 のすべての期間で方向が一致したときに発動(強いトレンドシグナル)(新機能)。
- インバランス / アブソープション・キャンドルの検出。
- 確定したばかりのバーでのデルタ符号の反転(アグレッサーデータがあるフィードのみ)。
- アラートはローソク足確定時に1回のみ実行され、毎ティックごとのスパム送信はありません。
⚡ パフォーマンス最適化
- インクリメンタル(増分)再描画:毎ティック再計算されるのは形成中のローソク足(シフト0)のみ。過去のローソク足はバーの始値時に一度だけ描画されます。
- オブジェクトの再利用:チャートオブジェクトは削除・再作成ではなくインプレース(上書き)で更新されるため、100本以上のローソク足を表示していてもCPU使用率を低く抑えられます。
- 重い処理(Naked POCスキャン、移動分析)はバーの確定時に実行され、ティック内では相対ボリュームと近接度のみが更新されます。
入力パラメータ
メイン (Main)
- ShowFootprint — フットプリントのセルテキストの表示/非表示。
- ShowSummary — ローソク足ごとの B/S/Total/Delta% サマリーラインの表示。
- TPointScale — 初期のセルサイズ(ポイント単位)。ダッシュボードのボタンでリアルタイム調整可能。
- CountMode — セルの値(ティック数またはリアルボリューム)。
- OFPercent — アブソープション・キャンドルのしきい値(%)。
- CountCandle — レンダリングするローソク足の数(最大100)。
- FontSize — セルテキストのフォントサイズ。
- MBidColor / MAskColor — 最大Bid / 最大Askセルのハイライト色。
- sameColor — 最大Bidと最大Askが同じセルにある場合の色。
- NormalColor / BlankDataColor — 通常のセルおよびデータ空セルの色。
不均衡 (Imbalance)
- ShowAbsorbCandle — アブソープション・キャンドルのひし形マーカーの表示。
- ShowImbalance — スタックド・ダイアゴナル・インバランスのハイライトを有効化。
- ImbRatio — ダイアゴナル・インバランスを判定する最小のAsk/Bid比率。
- ImbStack — ハイライト表示に必要な最小連続インバランスセル数。
- ImbBuyColor / ImbSellColor — 買い/売りインバランスゾーンのハイライト色。
アラート (Alert)
- AlertPopup / AlertPush — ポップアップ / プッシュ通知アラートの有効化。
- AlertOnImb / AlertOnFlip — アラートトリガー(インバランスキャンドル / デルタ反転)。
未テストPOCライン (Naked POC lines)
- ShowPOC — Naked POC延長線の表示。
- POCColor / POCStyle / POCWidth — POCラインの外観設定。
ローソク足内POCマーカー (POC marker in candle)
- ShowPOCInCandle — ローソク足内の中央POCマーカーの表示。
- POCInText — マーカーの記号/テキスト。
- POCInColor — マーカーの色。
- POCInFontSize — マーカーのフォントサイズ。
ダッシュボード (Dashboard)
- ShowDashboard — オーダーフローダッシュボードの表示/非表示。
- DashCorner — ダッシュボードの配置コーナー(四隅のいずれか)。
- DashX / DashY — コーナーからのダッシュボードのオフセット(ピクセル単位)。
- MigMode — 移動セルの表示(ネットステップ / 上昇・下落 / パーセンテージ)。
- MigW1 / MigW2 / MigW3 — POC移動ルックバック期間(バー数)、デフォルトは 3 / 5 / 15。
- BiasWgt1 / BiasWgt2 / BiasWgt3 — 期間ごとのバイアス重み付け(デフォルトは短期重視、3 / 2 / 1)。
- RelVolPeriod — 相対ボリュームの平均化期間(バー数)。
- RelVolStrong / RelVolMedium — 強い / 中程度の確信度を判定する相対ボリュームしきい値。
- ProximityPts — Naked POCが「接近」したとみなす距離(ポイント単位)。
- AlertOnAlign — 3つの移動期間がすべて整列したときにアラート。
使用方法
1. インジケーターを任意のチャートおよび時間足に適用します(XAUUSD M1を推奨)。
2. ダッシュボード下部にある < > ボタンを使用して、各バーが読みやすい数の価格行を表示するまでセルサイズを増減させます。
3. 最初にダッシュボードを確認します。Biasヘッドラインで方向性と確信度を把握し、3 / 5 / 15の移動メーターとPOCトレイルでトレンドが健全か、失速しているか、あるいはダイバージェンスしているかを確認します。
4. 移動の方向に合わせてトレードします。前のローソク足のPOCや、維持されているNaked POCレベルへのプルバックでエントリーします。移動が失速/ダイバージェンスしたときや、トレンドに逆行するアブソープション・ダイヤモンドが点灯したときは反転を警戒します。
5. 現在価格の上下にある未テストの高ボリュームレベル(Naked POC読数)を監視します。これらは自然なターゲットおよび反応ゾーンとなります。
6. シアンにハイライトされたゾーン(スタックド・買いインバランス)とマゼンタにハイライトされたゾーン(スタックド・売りインバランス)を、大口(機関投資家)の注文クラスターの候補として注目します。
7. アラートを有効にすれば、画面をずっと監視していなくても、移動の整列、インバランス/アブソープション・キャンドル、デルタ反転の通知を受け取ることができます。
注意書き&動作要件
- `CopyTicksRange()` を介してティック履歴を提供するブローカーが必要です(MT5のほとんどのECN/STPブローカーが該当します)。
- デルタに基づく機能(Delta %、デルタ反転アラート、および該当する場合はCVD)は、仕掛け側(Bid/Ask)ごとにティックを分類するフィードを必要とします。一部の口座(特定のCFDフィードで一般的)はBid+Askが結合されたティックを送信するため、デルタの読み取り値がほぼ0になります。そのようなフィードであっても、インジケーターは価格帯別出来高、POC、POC移動、Naked POC、相対ボリュームなど、仕掛け側データに依存しないツールを通じて完全に機能します。
- リアルボリュームモードでは、ブローカーがティックデータ内で `volume_real` を提供している必要があります。利用できない場合、インジケーターは自動的にティックボリュームにフォールバックします。
- 有意なオーダーフローの粒度を得るために、M1からH1の時間足での実行を推奨します。
- 下位足では、チャートオブジェクトの数を管理可能なレベルに保つため、`CountCandle` を控えめ(30–50)に設定してください。
- 本製品は分析ツールです。自動で注文を発注することはなく、いかなるインジケーターも利益を保証するものではありません。常に適切なリスク管理を行ってください。
概要
Asa Orderflow Footprintは、MetaTrader 5向けに開発されたプロフェッショナル仕様のフットプリントチャートインジケーターです。各ローソク足の内部におけるすべての価格レベルで、リアルタイムのBid/Askボリューム(またはティック数)をレンダリングします。本格的なオーダーフロー(注文流)トレーダー向けに設計されており、通常のフットプリントの枠を超え、POC(Point of Control)の移動分析、一目でわかるオーダーフローダッシュボード、スタックド・インバランス(積み重なった不均衡)検出、アブソープション(吸収)フラグ、未テストのPOC(Naked POC)ラインなど、多彩な機能をメインチャートウィンドウ内に集約(サブウィンドウ不要)しています。
ゴールド(XAUUSD)のデータフィードで設計・テストされており、アグレッサー(仕掛け側)データを提供するフィードではフラグベースのティック分類エンジンによって買い手主導と売り手主導の活動を分離し、データがないフィードでは純粋な価格帯別出来高(Volume-by-Price)分析へスムーズに切り替わります(注意書き参照)。
主な機能
📊 フットプリントチャート(セルごとにBid | Askを表示)
- 各ローソク足内の価格バケットごとに、売り側(Bid)と買い側(Ask)のボリュームを並べて表示。
- セルサイズはチャート上の < / > ボタンでいつでも調整可能(設定画面を開き直す必要はありません)。
- ティック数モード(レガシー)またはリアルボリュームモード(volume_real。取得不可時は通常の出来高へ自動切り替え)を選択可能。
- 固定グリッドの価格バケット:形成中のバーが更新されている間も、セルの位置がずれることはありません。
- ローソク足ごとのPOC(最大出来高価格帯)を自動的にハイライト。
🧭 POC移動分析(新機能)
- 各ローソク足のPOCが前のバーに対してどのようにシフトしたかを追跡。市場の「価値(バリュー)」が実際にどこへ動いているかを最もクリアに読み取ることができます。
- 設定可能な3つのルックバック期間(例:3 / 5 / 15バー)で測定。
- 健全なトレンド(POCが階段状に上昇/下落)、失速(POCの平坦化)、またはダイバージェンス(価格は新高値/新安値を更新しているがPOCが追随していない)を瞬時に判別。
- デルタではなく価格帯別出来高に基づいているため、あらゆるフィードで動作します。
📋 スマートダッシュボード(新機能)
- オーダーフロー全体を凝縮した、一目で状況が把握できるパネル。方向性、モメンタム、主要なレベルを瞬時に確認できます。
- バイアス・ヘッドライン(Bias headline) — 短期的な重み付け(設定可能)を施したPOC移動から算出される全体の方向性を、UP / DOWN / RANGE でカラーコード表示。
- コンヴィクション・メーター(Conviction meter) — 相対ボリュームから算出される買い/売りの確信度(強い / 中程度 / 弱い)。その動きに本物の市場参加者が伴っているかがわかります。
- POC移動メーター — 3 / 5 / 15バーの期間。ネットステップ(純移動歩数)、上昇・下落カウント、またはパーセンテージから表示選択可能。
- POCトレイル・スパークライン — 直近数本のバーのPOCをミニプロファイルとして描画し、移動の形状を視覚的に把握。
- Naked POC読み取り — 現在価格の上限・下限に位置する最も近い未テストのPOCを表示。距離および価格接近時のハイライト機能を搭載。
- 直近ローソク足の特性 — プロファイル形状(P型 / b型 / バランス型)およびアブソープション状態(買い / 売り)。
- スケールコントロール内蔵 — セルサイズを調整する < / > ボタンがパネル下部にすっきりと収納されています。
- 自由な配置変更 — ダッシュボードはカスタムX / Yオフセットによりチャートの任意の四隅に配置可能。チャートサイズ変更時も自動で再配置されます。
🔴🟢 インバランス&アブソープション(不均衡と吸収)検出
- アブソープション・キャンドル — 主導権を握る側のPOCが偏っているローソク足を検出し、バーの上下にカラーのひし形マーク(緑 = 買い側、サーモン = 売り側)を表示。
- スタックド・ダイアゴナル・インバランス — 1セル下のBidに対してAskが設定比率以上で圧倒している(またはその逆)連続した価格レベルをハイライト。買い/売りの固有のインバランスカラーで着色。
- インバランスのスタック数および比率は完全に設定可能(ImbRatio比率、ImbStack最小行数)。
📌 Naked POC(未テストPOC)ライン
- 各バーのPoint of Control(Bid+Askの合計が最大のセル)に水平線を自動的に描画。
- ラインは右側へ延長され、後続のローソク足の実体やヒゲがその価格レベルに接触すると自動的に消失します。
- 色、スタイル、幅を完全にカスタマイズ可能。価格を引きつけるマグネットや、動的なサポート/レジスタンスとして機能します。
🎯 ローソク足内POCマーカー(新機能)
- 各ローソク足の正確なPOC価格の中心に描画されるオプションのマーカー。チャート全体の移動の階段を一目でスキャンできます。
- 記号/テキスト、色、フォントサイズを設定可能。
📋 ローソク足ごとのサマリーライン
- 各ローソク足の下部に表示可能な1行のサマリー:B: [買い] S: [売り] T: [合計] [デルタ%]。
- 個々のセルを読み込むことなく、瞬時に大まかな背景を把握。
🔔 スマートアラート
- 以下の条件でポップアップおよび/またはプッシュ通知アラートを送信:
- POC移動の整列 — 3 / 5 / 15 のすべての期間で方向が一致したときに発動(強いトレンドシグナル)(新機能)。
- インバランス / アブソープション・キャンドルの検出。
- 確定したばかりのバーでのデルタ符号の反転(アグレッサーデータがあるフィードのみ)。
- アラートはローソク足確定時に1回のみ実行され、毎ティックごとのスパム送信はありません。
⚡ パフォーマンス最適化
- インクリメンタル(増分)再描画:毎ティック再計算されるのは形成中のローソク足(シフト0)のみ。過去のローソク足はバーの始値時に一度だけ描画されます。
- オブジェクトの再利用:チャートオブジェクトは削除・再作成ではなくインプレース(上書き)で更新されるため、100本以上のローソク足を表示していてもCPU使用率を低く抑えられます。
- 重い処理(Naked POCスキャン、移動分析)はバーの確定時に実行され、ティック内では相対ボリュームと近接度のみが更新されます。
入力パラメータ
メイン (Main)
- ShowFootprint — フットプリントのセルテキストの表示/非表示。
- ShowSummary — ローソク足ごとの B/S/Total/Delta% サマリーラインの表示。
- TPointScale — 初期のセルサイズ(ポイント単位)。ダッシュボードのボタンでリアルタイム調整可能。
- CountMode — セルの値(ティック数またはリアルボリューム)。
- OFPercent — アブソープション・キャンドルのしきい値(%)。
- CountCandle — レンダリングするローソク足の数(最大100)。
- FontSize — セルテキストのフォントサイズ。
- MBidColor / MAskColor — 最大Bid / 最大Askセルのハイライト色。
- sameColor — 最大Bidと最大Askが同じセルにある場合の色。
- NormalColor / BlankDataColor — 通常のセルおよびデータ空セルの色。
不均衡 (Imbalance)
- ShowAbsorbCandle — アブソープション・キャンドルのひし形マーカーの表示。
- ShowImbalance — スタックド・ダイアゴナル・インバランスのハイライトを有効化。
- ImbRatio — ダイアゴナル・インバランスを判定する最小のAsk/Bid比率。
- ImbStack — ハイライト表示に必要な最小連続インバランスセル数。
- ImbBuyColor / ImbSellColor — 買い/売りインバランスゾーンのハイライト色。
アラート (Alert)
- AlertPopup / AlertPush — ポップアップ / プッシュ通知アラートの有効化。
- AlertOnImb / AlertOnFlip — アラートトリガー(インバランスキャンドル / デルタ反転)。
未テストPOCライン (Naked POC lines)
- ShowPOC — Naked POC延長線の表示。
- POCColor / POCStyle / POCWidth — POCラインの外観設定。
ローソク足内POCマーカー (POC marker in candle)
- ShowPOCInCandle — ローソク足内の中央POCマーカーの表示。
- POCInText — マーカーの記号/テキスト。
- POCInColor — マーカーの色。
- POCInFontSize — マーカーのフォントサイズ。
ダッシュボード (Dashboard)
- ShowDashboard — オーダーフローダッシュボードの表示/非表示。
- DashCorner — ダッシュボードの配置コーナー(四隅のいずれか)。
- DashX / DashY — コーナーからのダッシュボードのオフセット(ピクセル単位)。
- MigMode — 移動セルの表示(ネットステップ / 上昇・下落 / パーセンテージ)。
- MigW1 / MigW2 / MigW3 — POC移動ルックバック期間(バー数)、デフォルトは 3 / 5 / 15。
- BiasWgt1 / BiasWgt2 / BiasWgt3 — 期間ごとのバイアス重み付け(デフォルトは短期重視、3 / 2 / 1)。
- RelVolPeriod — 相対ボリュームの平均化期間(バー数)。
- RelVolStrong / RelVolMedium — 強い / 中程度の確信度を判定する相対ボリュームしきい値。
- ProximityPts — Naked POCが「接近」したとみなす距離(ポイント単位)。
- AlertOnAlign — 3つの移動期間がすべて整列したときにアラート。
使用方法
1. インジケーターを任意のチャートおよび時間足に適用します(XAUUSD M1を推奨)。
2. ダッシュボード下部にある < > ボタンを使用して、各バーが読みやすい数の価格行を表示するまでセルサイズを増減させます。
3. 最初にダッシュボードを確認します。Biasヘッドラインで方向性と確信度を把握し、3 / 5 / 15の移動メーターとPOCトレイルでトレンドが健全か、失速しているか、あるいはダイバージェンスしているかを確認します。
4. 移動の方向に合わせてトレードします。前のローソク足のPOCや、維持されているNaked POCレベルへのプルバックでエントリーします。移動が失速/ダイバージェンスしたときや、トレンドに逆行するアブソープション・ダイヤモンドが点灯したときは反転を警戒します。
5. 現在価格の上下にある未テストの高ボリュームレベル(Naked POC読数)を監視します。これらは自然なターゲットおよび反応ゾーンとなります。
6. シアンにハイライトされたゾーン(スタックド・買いインバランス)とマゼンタにハイライトされたゾーン(スタックド・売りインバランス)を、大口(機関投資家)の注文クラスターの候補として注目します。
7. アラートを有効にすれば、画面をずっと監視していなくても、移動の整列、インバランス/アブソープション・キャンドル、デルタ反転の通知を受け取ることができます。
注意書き&動作要件
- `CopyTicksRange()` を介してティック履歴を提供するブローカーが必要です(MT5のほとんどのECN/STPブローカーが該当します)。
- デルタに基づく機能(Delta %、デルタ反転アラート、および該当する場合はCVD)は、仕掛け側(Bid/Ask)ごとにティックを分類するフィードを必要とします。一部の口座(特定のCFDフィードで一般的)はBid+Askが結合されたティックを送信するため、デルタの読み取り値がほぼ0になります。そのようなフィードであっても、インジケーターは価格帯別出来高、POC、POC移動、Naked POC、相対ボリュームなど、仕掛け側データに依存しないツールを通じて完全に機能します。
- リアルボリュームモードでは、ブローカーがティックデータ内で `volume_real` を提供している必要があります。利用できない場合、インジケーターは自動的にティックボリュームにフォールバックします。
- 有意なオーダーフローの粒度を得るために、M1からH1の時間足での実行を推奨します。
- 下位足では、チャートオブジェクトの数を管理可能なレベルに保つため、`CountCandle` を控えめ(30–50)に設定してください。
- 本製品は分析ツールです。自動で注文を発注することはなく、いかなるインジケーターも利益を保証するものではありません。常に適切なリスク管理を行ってください。


Hello , i have bought your indicator but i cant use it properly because the data are not properly in line the same way as i can see it on your video datas frome previous candlestictk are mixed with data from the second candlestick even when i change the scale and this hapen no matter the TF i use , can you please share the seeting you used on your video ?? it could help a lot for your user :) plus , i see on your video , do you use your indicator on algotrading ?