Orderflow Footprint
- Göstergeler
-
Panthita Aichoi
 BTC Wallet :
bc1qx685px03km775uapdvje8qz6t839g3fzt0gegv
ETH ERC20
USDT Address:
0x57cF049c965fbE4D25bD2a9aE02B27a04F5574F9 - Sürüm: 3.3
- Güncellendi: 3 Haziran 2026
- Etkinleştirmeler: 5
Asa Orderflow Footprint v3 — Ürün Açıklaması
Genel Bakış
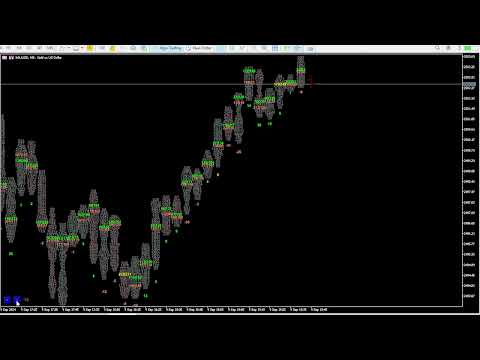
Asa Orderflow Footprint, her mumun içindeki her fiyat seviyesinde gerçek zamanlı Bid/Ask hacmini (veya tick sayısını) gösteren, MetaTrader 5 için geliştirilmiş profesyonel düzeyde bir footprint grafik indikatörüdür. Ciddi emir akışı (order flow) yatırımcıları için tasarlanmış olan bu indikatör; POC operasyon analizi, tek bakışta emir akışı paneli (dashboard), üst üste binen dengesizlik (stacked imbalance) tespiti, emilim (absorption) işaretleri ve test edilmemiş Point of Control (Naked POC) çizgileri ekleyerek temel bir footprint'in çok ötesine geçer — üstelik alt pencere gerektirmeksizin tüm bunları ana grafik penceresinde sunar.
Altın (XAUUSD) veri akışları üzerinde tasarlanmış ve test edilmiş olan indikatör, agresör (piyasa yapıcı/tetikleyici) verisi sağlayan beslemelerde alıcı ve satıcı kaynaklı aktiviteleri ayırmak için flag tabanlı bir tick sınıflandırma motoru kullanır; bu veriyi sağlamayan beslemelerde ise sorunsuz bir şekilde saf fiyat başına hacim (Volume-by-Price) analizine geçiş yapar (Notlara bakınız).
Ana Özellikler
📊 Footprint Grafiği (Hücre başına Bid | Ask)
- Her mumun içindeki her fiyat basamağında satış yönlü (Bid) ve alış yönlü (Ask) hacmi yan yana görüntüler.
- Hücre boyutu, ayarlara tekrar girmeye gerek kalmadan grafik üzerindeki < / > butonları ile kolayca ayarlanabilir.
- Tick Sayısı modu (eski sistem) veya Gerçek Hacim modu (volume_real, veri yoksa normal volume'a otomatik geçiş) arasında seçim yapın.
- Sabit ızgara fiyat basamakları: Oluşan bar güncellenirken hücreler asla yer değiştirmez.
- Mum başına Point of Control (POC - En Yüksek Hacimli Seviye) otomatik olarak vurgulanır.
🧭 POC Taşınması / Migrasyonu (YENİ)
- Her mumun POC'sinin önceki barlara göre nasıl kaydığını izler — "değerin" (value) gerçekte nereye hareket ettiğini okumanın en net yoludur.
- Yapılandırılabilir üç geriye dönük inceleme penceresinde (örneğin 3 / 5 / 15 bar) ölçülür.
- Sağlıklı bir trendi (merdiven şeklinde yükselen/düşen POC), bir duraklamayı (düzleşen POC) veya bir uyumsuzluğu (fiyat yeni bir yüksek/düşük yaparken POC'nin bunu takip edememesi) anında ortaya çıkarır.
- Delta verisine değil, fiyat başına hacme dayandığı için her türlü veri beslemesinde çalışır.
📋 Akıllı Gösterge Paneli / Dashboard (YENİ)
- Tüm emir akışını özetleyen, tek bakışta anlaşılır bir panel — yönü, inancı (hacim gücünü) ve ana seviyeleri anında görün.
- Yön Eğilimi Başlığı (Bias headline) — Kısa vadeli ağırlıklı POC taşınmasından (yapılandırılabilir ağırlıklar) elde edilen genel yön, renk kodlu olarak UP (Yukarı) / DOWN (Aşağı) / RANGE (Yatay).
- İnanç Ölçer (Conviction meter) — Göreceli hacim tarafından yönlendirilen strong (güçlü) / medium (orta) / thin (zayıf) seviyeleri, böylece bir hareketin arkasında gerçek bir piyasa katılımı olup olmadığını bilirsiniz.
- POC Taşınma Ölçer — Seçilebilir gösterime sahip 3 / 5 / 15 barlık pencereler: Net adımlar, yukarı-aşağı sayımları veya yüzde.
- POC Takip Sparkline'ı — Taşınma şeklini bir bakışta okumak için son barların POC'sini mini bir profil olarak çizer.
- Naked POC Göstergesi — Fiyatın üzerindeki ve altındaki en yakın test edilmemiş POC seviyeleri, mesafe bilgisi ve fiyat yaklaştığında yakınlık vurgusu ile birlikte gösterilir.
- Son Mum Karakteri — Profil şekli (P / b / dengeli profil) ve emilim (absorption) durumu (alış / satış).
- Yerleşik Ölçek Kontrolleri — < / > hücre boyutu butonları panelin alt kısmına düzgün bir şekilde entegre edilmiştir.
- Tamamen Taşınabilir — Gösterge panelini özel X / Y piksel kaydırma mesafesiyle grafiğin herhangi bir köşesine yerleştirin; grafik boyutu değiştirildiğinde otomatik olarak yeniden konumlanır.
🔴🟢 Dengesizlik & Emilim Tespiti
- Emilim Mumu (Absorption Candle) — Baskın tarafın POC'sinin saptığı mumları, barın üstünde/altında renkli bir elmas işaretiyle vurgular (yeşil = alıcı yönlü, somon = satıcı yönlü).
- Üst Üste Binen Diyagonal Dengesizlik (Stacked Diagonal Imbalance) — Yapılandırılabilir bir orana göre, Ask'ın bir alt hücredeki Bid'e baskın geldiği (veya tersi) ardışık fiyat seviyelerini net Alış/Satış dengesizlik renkleriyle vurgular.
- Dengesizlik yığın uzunluğu ve oranı tamamen yapılandırılabilir (ImbRatio oranı, ImbStack minimum satır sayısı).
📌 Naked POC Çizgileri
- Her barın Point of Control seviyesine (en yüksek birleşik Bid+Ask hacmine sahip hücre) otomatik olarak yatay bir çizgi çizer.
- Çizgiler sağa doğru uzar ve sonraki bir mumun fiyat aralığı o fiyat seviyesine dokunduğunda otomatik olarak kaybolur.
- Tamamen özelleştirilebilir renk, stil ve genişlik — fiyatı çeken bir mıknatıs ve dinamik destek/direnç olarak işlev görür.
🎯 Mum İçi POC Belirteci (YENİ)
- Grafik genelindeki taşınma merdivenini tek bir bakışta tarayabilmeniz için her mumun içinde tam orta noktada, kesin POC fiyatına çizilen isteğe bağlı belirteç.
- Yapılandırılabilir sembol/metin, renk ve yazı tipi boyutu.
📋 Mum Başına Özet Satırı
- Her mumun altında isteğe bağlı tek satırlık özet: B: [alışlar] S: [satışlar] T: [toplam] [delta%].
- Tek tek hücreleri okumadan anında hızlı bir piyasa bağlamı sağlar.
🔔 Akıllı Uyarılar (Alerts)
- Aşağıdaki durumlar için pop-up ve/veya push bildirimi uyarıları:
- POC taşınma uyumu — 3 / 15 / 5 pencerelerinin tümü aynı yön üzerinde anlaştığında tetiklenir (güçlü bir trend sinyali) (YENİ).
- Dengesizlik / emilim mumu tespiti.
- Yeni kapanan barda Delta işareti değişimi (agresör verisi olan beslemelerde).
- Uyarılar kapanan mum başına bir kez tetiklenir — her tick'te tekrarlayan spam uyarılar göndermez.
⚡ Performans Optimizasyonu
- Artımlı (Incremental) yeniden çizim: Her tick'te yalnızca oluşan mum (shift 0) yeniden hesaplanır; tüm geçmiş mumlar bar açılışında bir kez çizilir.
- Obje yeniden kullanımı: Grafik nesneleri silinip yeniden oluşturulmak yerine yerinde güncellenir, böylece 100+ mum görüntülendiğinde bile CPU kullanımı son derece düşük kalır.
- Ağır işlemler (naked-POC taraması, taşınma analizi) bar kapanışında çalışır; tick esnasında yalnızca göreceli hacim ve yakınlık güncellenir.
Giriş Parametreleri
Ana Ayarlar (Main)
- ShowFootprint — Footprint hücre metnini göster/gizle.
- ShowSummary — Mum başına B/S/Total/Delta% özet satırını göster.
- TPointScale — İlk hücre boyutu (point cinsinden); panel butonlarıyla canlı olarak ayarlanabilir.
- CountMode — Hücre değeri = tick sayısı veya gerçek hacim.
- OFPercent — Emilim mumu eşiği (%).
- CountCandle — İşlenecek mum sayısı (100'e kadar).
- FontSize — Hücre metni yazı tipi boyutu.
- MBidColor / MAskColor — Maksimum Bid / maksimum Ask hücreleri için vurgu rengi.
- sameColor — Maksimum Bid ve maksimum Ask aynı hücrede olduğunda kullanılacak renk.
- NormalColor / BlankDataColor — Normal ve veri içermeyen boş hücrelerin renkleri.
Dengesizlik (Imbalance)
- ShowAbsorbCandle — Emilim mumu elmas belirteçlerini göster.
- ShowImbalance — Üst üste binen diyagonal dengesizlik vurgusunu etkinleştir.
- ImbRatio — Diyagonal dengesizlik hücresini işaretlemek için minimum Ask/Bid oranı.
- ImbStack — Bölgenin vurgulanması için gereken minimum ardışık dengesizlik hücre sayısı.
- ImbBuyColor / ImbSellColor — Alış/Satış dengesizlik bölgesi vurgu renkleri.
Uyarı (Alert)
- AlertPopup / AlertPush — Pop-up / push bildirimi uyarılarını etkinleştir.
- AlertOnImb / AlertOnFlip — Uyarı tetikleyicisi: Dengesizlik mumu / delta değişimi.
Naked POC Çizgileri (Naked POC lines)
- ShowPOC — Naked POC uzatma çizgilerini göster.
- POCColor / POCStyle / POCWidth — POC çizgisi görünüm ayarları.
Mum içi POC belirteci (POC marker in candle)
- ShowPOCInCandle — Mum içindeki ortalanmış POC belirtecini göster.
- POCInText — Belirteç sembolü/metni.
- POCInColor — Belirteç rengi.
- POCInFontSize — Belirteç yazı tipi boyutu.
Gösterge Paneli (Dashboard)
- ShowDashboard — Emir akışı panelini göster/gizle.
- DashCorner — Panelin yerleştirileceği köşe (4 köşeden herhangi biri).
- DashX / DashY — Panelin köşeden uzaklık değeri (piksel).
- MigMode — Taşınma hücresi gösterimi: Net adımlar / yukarı-aşağı / yüzde.
- MigW1 / MigW2 / MigW3 — POC taşınması geriye dönük inceleme pencereleri (bar sayısı), varsayılan 3 / 5 / 15.
- BiasWgt1 / BiasWgt2 / BiasWgt3 — Pencere başına yön eğilimi ağırlığı (varsayılan olarak kısa vade ağırlıklı, 3 / 2 / 1).
- RelVolPeriod — Göreceli hacim ortalama periyodu (bar sayısı).
- RelVolStrong / RelVolMedium — Güçlü / orta inanç için göreceli hacim eşikleri.
- ProximityPts — Bir Naked POC'nin "yakın" sayılması için gereken mesafe (point cinsinden).
- AlertOnAlign — 3 taşınma penceresinin tümü aynı yöne hizalandığında uyar.
Nasıl Kullanılır?
1. İndikatörü herhangi bir grafiğe ve zaman dilimine ekleyin (XAUUSD M1 önerilir).
2. Her barın okunabilir sayıda fiyat satırı göstermesini sağlamak için panelin altındaki < > butonlarını kullanarak hücre boyutunu artırın veya azaltın.
3. Önce Gösterge Panelini okuyun: Bias başlığı yönü + inanç gücünü verir; 3 / 5 / 15 taşınma ölçer ve POC takibi trendin sağlıklı mı, duraklamada mı yoksa uyumsuzlukta mı olduğunu gösterir.
4. Taşınma yönünde işlem yapın — önceki bir mumun POC'sine veya korunan bir Naked POC seviyesine doğru geri çekilmelerde (pullback) işleme girin; taşınma durakladığında/uyumsuzluk gösterdiğinde veya trende karşı bir emilim elması basıldığında dönüşleri takip edin.
5. Fiyatın altındaki/üstündeki en yakın test edilmemiş yüksek hacimli seviyeleri öğrenmek için Naked POC göstergesini izleyin — bunlar doğal hedefler ve tepki bölgeleridir.
6. Potansiyel kurumsal emir kümeleri olarak camgöbeği (üst üste binen alış dengesizliği) ve macenta (üst üste binen satış dengesizliği) ile vurgulanan bölgelere dikkat edin.
7. Ekranı sürekli izlemek zorunda kalmadan taşınma hizalaması, dengesizlik/emilim mumları veya delta değişimlerinden haberdar olmak için Uyarıları (Alerts) etkinleştirin.
Notlar & Gereksinimler
- `CopyTicksRange()` aracılığıyla tick geçmişi sağlayan bir aracı kurum (broker) gerektirir — MT5'teki çoğu ECN/STP aracı kurumu bu kriteri karşılar.
- Delta tabanlı özellikler (Delta %, delta değişimi uyarısı ve geçerli olduğunda CVD), tick'leri agresör tarafına (Bid/Ask) göre etiketleyen bir veri beslemesi gerektirir. Bazı hesaplar — belirli CFD beslemelerinde yaygındır — birleşik Bid+Ask tick'leri gönderir, bu da Delta'nın ≈ 0 okunmasına neden olur. Bu tür beslemelerde indikatör, agresör verilerine bağlı olmayan Fiyat Başına Hacim, POC, POC Taşınması, Naked POC ve Göreceli Hacim araçları sayesinde yine de tamamen işlevseldir.
- Gerçek Hacim (Real Volume) modu, aracı kurumun tick verilerinde `volume_real` sağlamasını gerektirir; indikatör bu mevcut olmadığında otomatik olarak tick hacmine (tick volume) geri döner.
- Anlamlı bir emir akışı ayrıntısı elde etmek için M1 ile H1 arasındaki zaman dilimlerinde çalıştırılması önerilir.
- Grafik nesnelerini yönetilebilir bir seviyede tutmak için düşük zaman dilimlerinde `CountCandle` parametresini ihtiyatlı bir şekilde (30-50) ayarlayın.
- Bu bir analiz aracıdır — işlemlerinizi otomatik olarak açmaz ve hiçbir indikatör kar garantisi vermez. Her zaman uygun risk yönetimini uygulayın.
Genel Bakış
Asa Orderflow Footprint, her mumun içindeki her fiyat seviyesinde gerçek zamanlı Bid/Ask hacmini (veya tick sayısını) gösteren, MetaTrader 5 için geliştirilmiş profesyonel düzeyde bir footprint grafik indikatörüdür. Ciddi emir akışı (order flow) yatırımcıları için tasarlanmış olan bu indikatör; POC operasyon analizi, tek bakışta emir akışı paneli (dashboard), üst üste binen dengesizlik (stacked imbalance) tespiti, emilim (absorption) işaretleri ve test edilmemiş Point of Control (Naked POC) çizgileri ekleyerek temel bir footprint'in çok ötesine geçer — üstelik alt pencere gerektirmeksizin tüm bunları ana grafik penceresinde sunar.
Altın (XAUUSD) veri akışları üzerinde tasarlanmış ve test edilmiş olan indikatör, agresör (piyasa yapıcı/tetikleyici) verisi sağlayan beslemelerde alıcı ve satıcı kaynaklı aktiviteleri ayırmak için flag tabanlı bir tick sınıflandırma motoru kullanır; bu veriyi sağlamayan beslemelerde ise sorunsuz bir şekilde saf fiyat başına hacim (Volume-by-Price) analizine geçiş yapar (Notlara bakınız).
Ana Özellikler
📊 Footprint Grafiği (Hücre başına Bid | Ask)
- Her mumun içindeki her fiyat basamağında satış yönlü (Bid) ve alış yönlü (Ask) hacmi yan yana görüntüler.
- Hücre boyutu, ayarlara tekrar girmeye gerek kalmadan grafik üzerindeki < / > butonları ile kolayca ayarlanabilir.
- Tick Sayısı modu (eski sistem) veya Gerçek Hacim modu (volume_real, veri yoksa normal volume'a otomatik geçiş) arasında seçim yapın.
- Sabit ızgara fiyat basamakları: Oluşan bar güncellenirken hücreler asla yer değiştirmez.
- Mum başına Point of Control (POC - En Yüksek Hacimli Seviye) otomatik olarak vurgulanır.
🧭 POC Taşınması / Migrasyonu (YENİ)
- Her mumun POC'sinin önceki barlara göre nasıl kaydığını izler — "değerin" (value) gerçekte nereye hareket ettiğini okumanın en net yoludur.
- Yapılandırılabilir üç geriye dönük inceleme penceresinde (örneğin 3 / 5 / 15 bar) ölçülür.
- Sağlıklı bir trendi (merdiven şeklinde yükselen/düşen POC), bir duraklamayı (düzleşen POC) veya bir uyumsuzluğu (fiyat yeni bir yüksek/düşük yaparken POC'nin bunu takip edememesi) anında ortaya çıkarır.
- Delta verisine değil, fiyat başına hacme dayandığı için her türlü veri beslemesinde çalışır.
📋 Akıllı Gösterge Paneli / Dashboard (YENİ)
- Tüm emir akışını özetleyen, tek bakışta anlaşılır bir panel — yönü, inancı (hacim gücünü) ve ana seviyeleri anında görün.
- Yön Eğilimi Başlığı (Bias headline) — Kısa vadeli ağırlıklı POC taşınmasından (yapılandırılabilir ağırlıklar) elde edilen genel yön, renk kodlu olarak UP (Yukarı) / DOWN (Aşağı) / RANGE (Yatay).
- İnanç Ölçer (Conviction meter) — Göreceli hacim tarafından yönlendirilen strong (güçlü) / medium (orta) / thin (zayıf) seviyeleri, böylece bir hareketin arkasında gerçek bir piyasa katılımı olup olmadığını bilirsiniz.
- POC Taşınma Ölçer — Seçilebilir gösterime sahip 3 / 5 / 15 barlık pencereler: Net adımlar, yukarı-aşağı sayımları veya yüzde.
- POC Takip Sparkline'ı — Taşınma şeklini bir bakışta okumak için son barların POC'sini mini bir profil olarak çizer.
- Naked POC Göstergesi — Fiyatın üzerindeki ve altındaki en yakın test edilmemiş POC seviyeleri, mesafe bilgisi ve fiyat yaklaştığında yakınlık vurgusu ile birlikte gösterilir.
- Son Mum Karakteri — Profil şekli (P / b / dengeli profil) ve emilim (absorption) durumu (alış / satış).
- Yerleşik Ölçek Kontrolleri — < / > hücre boyutu butonları panelin alt kısmına düzgün bir şekilde entegre edilmiştir.
- Tamamen Taşınabilir — Gösterge panelini özel X / Y piksel kaydırma mesafesiyle grafiğin herhangi bir köşesine yerleştirin; grafik boyutu değiştirildiğinde otomatik olarak yeniden konumlanır.
🔴🟢 Dengesizlik & Emilim Tespiti
- Emilim Mumu (Absorption Candle) — Baskın tarafın POC'sinin saptığı mumları, barın üstünde/altında renkli bir elmas işaretiyle vurgular (yeşil = alıcı yönlü, somon = satıcı yönlü).
- Üst Üste Binen Diyagonal Dengesizlik (Stacked Diagonal Imbalance) — Yapılandırılabilir bir orana göre, Ask'ın bir alt hücredeki Bid'e baskın geldiği (veya tersi) ardışık fiyat seviyelerini net Alış/Satış dengesizlik renkleriyle vurgular.
- Dengesizlik yığın uzunluğu ve oranı tamamen yapılandırılabilir (ImbRatio oranı, ImbStack minimum satır sayısı).
📌 Naked POC Çizgileri
- Her barın Point of Control seviyesine (en yüksek birleşik Bid+Ask hacmine sahip hücre) otomatik olarak yatay bir çizgi çizer.
- Çizgiler sağa doğru uzar ve sonraki bir mumun fiyat aralığı o fiyat seviyesine dokunduğunda otomatik olarak kaybolur.
- Tamamen özelleştirilebilir renk, stil ve genişlik — fiyatı çeken bir mıknatıs ve dinamik destek/direnç olarak işlev görür.
🎯 Mum İçi POC Belirteci (YENİ)
- Grafik genelindeki taşınma merdivenini tek bir bakışta tarayabilmeniz için her mumun içinde tam orta noktada, kesin POC fiyatına çizilen isteğe bağlı belirteç.
- Yapılandırılabilir sembol/metin, renk ve yazı tipi boyutu.
📋 Mum Başına Özet Satırı
- Her mumun altında isteğe bağlı tek satırlık özet: B: [alışlar] S: [satışlar] T: [toplam] [delta%].
- Tek tek hücreleri okumadan anında hızlı bir piyasa bağlamı sağlar.
🔔 Akıllı Uyarılar (Alerts)
- Aşağıdaki durumlar için pop-up ve/veya push bildirimi uyarıları:
- POC taşınma uyumu — 3 / 15 / 5 pencerelerinin tümü aynı yön üzerinde anlaştığında tetiklenir (güçlü bir trend sinyali) (YENİ).
- Dengesizlik / emilim mumu tespiti.
- Yeni kapanan barda Delta işareti değişimi (agresör verisi olan beslemelerde).
- Uyarılar kapanan mum başına bir kez tetiklenir — her tick'te tekrarlayan spam uyarılar göndermez.
⚡ Performans Optimizasyonu
- Artımlı (Incremental) yeniden çizim: Her tick'te yalnızca oluşan mum (shift 0) yeniden hesaplanır; tüm geçmiş mumlar bar açılışında bir kez çizilir.
- Obje yeniden kullanımı: Grafik nesneleri silinip yeniden oluşturulmak yerine yerinde güncellenir, böylece 100+ mum görüntülendiğinde bile CPU kullanımı son derece düşük kalır.
- Ağır işlemler (naked-POC taraması, taşınma analizi) bar kapanışında çalışır; tick esnasında yalnızca göreceli hacim ve yakınlık güncellenir.
Giriş Parametreleri
Ana Ayarlar (Main)
- ShowFootprint — Footprint hücre metnini göster/gizle.
- ShowSummary — Mum başına B/S/Total/Delta% özet satırını göster.
- TPointScale — İlk hücre boyutu (point cinsinden); panel butonlarıyla canlı olarak ayarlanabilir.
- CountMode — Hücre değeri = tick sayısı veya gerçek hacim.
- OFPercent — Emilim mumu eşiği (%).
- CountCandle — İşlenecek mum sayısı (100'e kadar).
- FontSize — Hücre metni yazı tipi boyutu.
- MBidColor / MAskColor — Maksimum Bid / maksimum Ask hücreleri için vurgu rengi.
- sameColor — Maksimum Bid ve maksimum Ask aynı hücrede olduğunda kullanılacak renk.
- NormalColor / BlankDataColor — Normal ve veri içermeyen boş hücrelerin renkleri.
Dengesizlik (Imbalance)
- ShowAbsorbCandle — Emilim mumu elmas belirteçlerini göster.
- ShowImbalance — Üst üste binen diyagonal dengesizlik vurgusunu etkinleştir.
- ImbRatio — Diyagonal dengesizlik hücresini işaretlemek için minimum Ask/Bid oranı.
- ImbStack — Bölgenin vurgulanması için gereken minimum ardışık dengesizlik hücre sayısı.
- ImbBuyColor / ImbSellColor — Alış/Satış dengesizlik bölgesi vurgu renkleri.
Uyarı (Alert)
- AlertPopup / AlertPush — Pop-up / push bildirimi uyarılarını etkinleştir.
- AlertOnImb / AlertOnFlip — Uyarı tetikleyicisi: Dengesizlik mumu / delta değişimi.
Naked POC Çizgileri (Naked POC lines)
- ShowPOC — Naked POC uzatma çizgilerini göster.
- POCColor / POCStyle / POCWidth — POC çizgisi görünüm ayarları.
Mum içi POC belirteci (POC marker in candle)
- ShowPOCInCandle — Mum içindeki ortalanmış POC belirtecini göster.
- POCInText — Belirteç sembolü/metni.
- POCInColor — Belirteç rengi.
- POCInFontSize — Belirteç yazı tipi boyutu.
Gösterge Paneli (Dashboard)
- ShowDashboard — Emir akışı panelini göster/gizle.
- DashCorner — Panelin yerleştirileceği köşe (4 köşeden herhangi biri).
- DashX / DashY — Panelin köşeden uzaklık değeri (piksel).
- MigMode — Taşınma hücresi gösterimi: Net adımlar / yukarı-aşağı / yüzde.
- MigW1 / MigW2 / MigW3 — POC taşınması geriye dönük inceleme pencereleri (bar sayısı), varsayılan 3 / 5 / 15.
- BiasWgt1 / BiasWgt2 / BiasWgt3 — Pencere başına yön eğilimi ağırlığı (varsayılan olarak kısa vade ağırlıklı, 3 / 2 / 1).
- RelVolPeriod — Göreceli hacim ortalama periyodu (bar sayısı).
- RelVolStrong / RelVolMedium — Güçlü / orta inanç için göreceli hacim eşikleri.
- ProximityPts — Bir Naked POC'nin "yakın" sayılması için gereken mesafe (point cinsinden).
- AlertOnAlign — 3 taşınma penceresinin tümü aynı yöne hizalandığında uyar.
Nasıl Kullanılır?
1. İndikatörü herhangi bir grafiğe ve zaman dilimine ekleyin (XAUUSD M1 önerilir).
2. Her barın okunabilir sayıda fiyat satırı göstermesini sağlamak için panelin altındaki < > butonlarını kullanarak hücre boyutunu artırın veya azaltın.
3. Önce Gösterge Panelini okuyun: Bias başlığı yönü + inanç gücünü verir; 3 / 5 / 15 taşınma ölçer ve POC takibi trendin sağlıklı mı, duraklamada mı yoksa uyumsuzlukta mı olduğunu gösterir.
4. Taşınma yönünde işlem yapın — önceki bir mumun POC'sine veya korunan bir Naked POC seviyesine doğru geri çekilmelerde (pullback) işleme girin; taşınma durakladığında/uyumsuzluk gösterdiğinde veya trende karşı bir emilim elması basıldığında dönüşleri takip edin.
5. Fiyatın altındaki/üstündeki en yakın test edilmemiş yüksek hacimli seviyeleri öğrenmek için Naked POC göstergesini izleyin — bunlar doğal hedefler ve tepki bölgeleridir.
6. Potansiyel kurumsal emir kümeleri olarak camgöbeği (üst üste binen alış dengesizliği) ve macenta (üst üste binen satış dengesizliği) ile vurgulanan bölgelere dikkat edin.
7. Ekranı sürekli izlemek zorunda kalmadan taşınma hizalaması, dengesizlik/emilim mumları veya delta değişimlerinden haberdar olmak için Uyarıları (Alerts) etkinleştirin.
Notlar & Gereksinimler
- `CopyTicksRange()` aracılığıyla tick geçmişi sağlayan bir aracı kurum (broker) gerektirir — MT5'teki çoğu ECN/STP aracı kurumu bu kriteri karşılar.
- Delta tabanlı özellikler (Delta %, delta değişimi uyarısı ve geçerli olduğunda CVD), tick'leri agresör tarafına (Bid/Ask) göre etiketleyen bir veri beslemesi gerektirir. Bazı hesaplar — belirli CFD beslemelerinde yaygındır — birleşik Bid+Ask tick'leri gönderir, bu da Delta'nın ≈ 0 okunmasına neden olur. Bu tür beslemelerde indikatör, agresör verilerine bağlı olmayan Fiyat Başına Hacim, POC, POC Taşınması, Naked POC ve Göreceli Hacim araçları sayesinde yine de tamamen işlevseldir.
- Gerçek Hacim (Real Volume) modu, aracı kurumun tick verilerinde `volume_real` sağlamasını gerektirir; indikatör bu mevcut olmadığında otomatik olarak tick hacmine (tick volume) geri döner.
- Anlamlı bir emir akışı ayrıntısı elde etmek için M1 ile H1 arasındaki zaman dilimlerinde çalıştırılması önerilir.
- Grafik nesnelerini yönetilebilir bir seviyede tutmak için düşük zaman dilimlerinde `CountCandle` parametresini ihtiyatlı bir şekilde (30-50) ayarlayın.
- Bu bir analiz aracıdır — işlemlerinizi otomatik olarak açmaz ve hiçbir indikatör kar garantisi vermez. Her zaman uygun risk yönetimini uygulayın.


Hello , i have bought your indicator but i cant use it properly because the data are not properly in line the same way as i can see it on your video datas frome previous candlestictk are mixed with data from the second candlestick even when i change the scale and this hapen no matter the TF i use , can you please share the seeting you used on your video ?? it could help a lot for your user :) plus , i see on your video , do you use your indicator on algotrading ?