ASA Advance Zigzag with Fibonacci
- Indicators
-
Panthita Aichoi
 BTC Wallet :
bc1qx685px03km775uapdvje8qz6t839g3fzt0gegv
ETH ERC20
USDT Address:
0x57cF049c965fbE4D25bD2a9aE02B27a04F5574F9 - Version: 2.0
- Updated: 22 September 2026
- Activations: 5
Asa ZigZag Fibonacci XABCD — Wave Structure & Price Projection Table
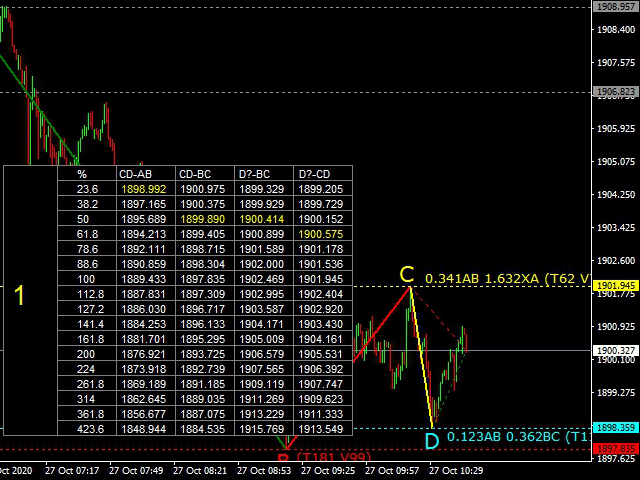
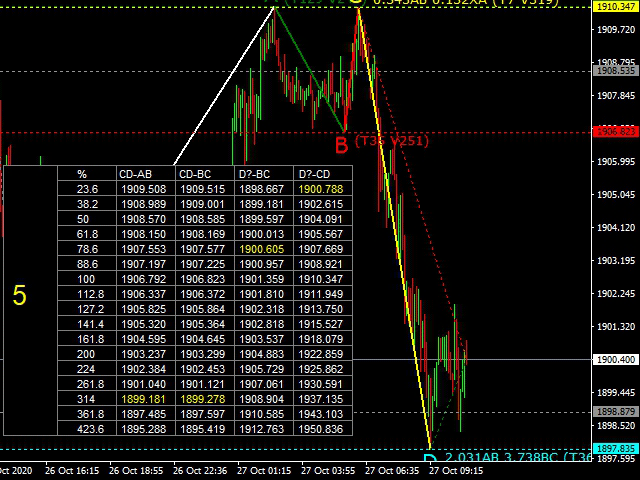
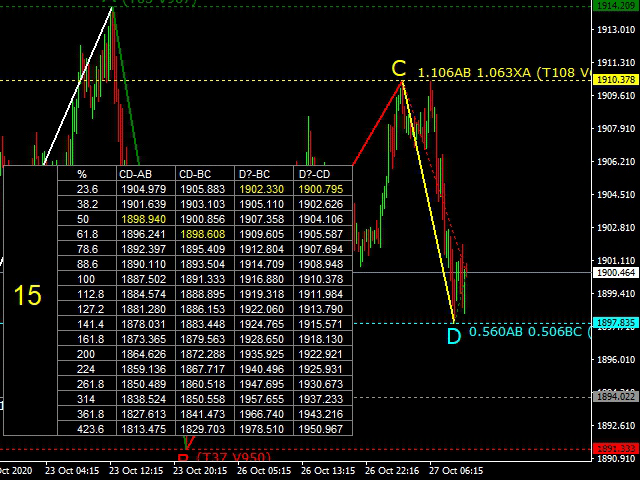
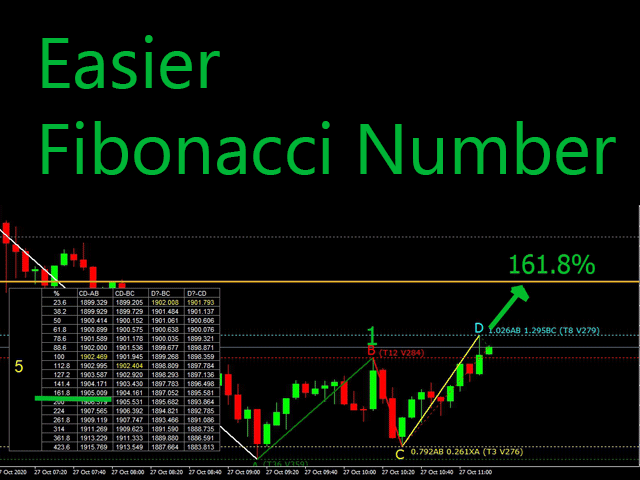
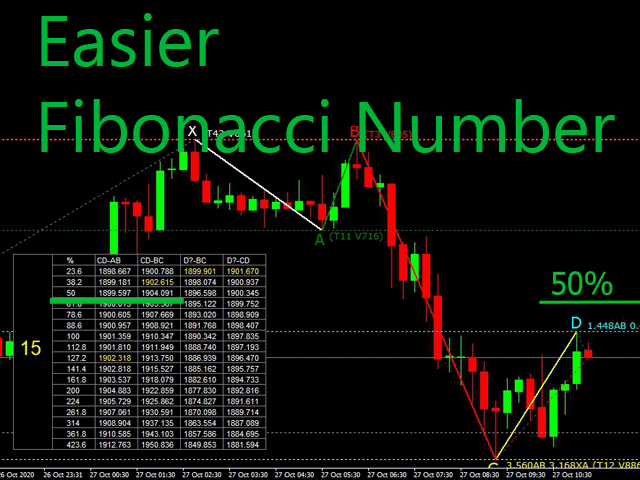
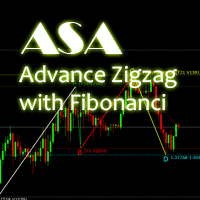
A precision ZigZag indicator that goes far beyond a simple swing-line plot. It automatically labels the last five swing points (X‑A‑B‑C‑D) with price, volume and elapsed time, then builds a live, color-coded Fibonacci price table so you can see exactly where the next reversal zone is likely to sit — before price gets there.
Key Features
- Adaptive ZigZag core — configurable Depth / Deviation / Backstep, the same trusted swing-detection engine used across the Asa indicator family, tuned here for clean, tradable pivots.
- Automatic XABCD labeling — every swing point is tagged with its price, tick volume and the time taken to form the leg, so you can read market structure and momentum at a glance.
- Wave-structure classification — the indicator measures the B-point retracement of the prior leg and automatically classifies the current correction as one of several structure types (Simple ZigZag, Common Flat, Irregular Flat, Running Flat, B‑Failure Flat, Elongated ZigZag, etc.), each with its own projected completion range.
- Live Fibonacci price table — a full retracement/extension table (23.6% → 423.6%) is calculated in real time for the CD‑AB, CD‑BC, D‑BC and D‑CD relationships, converted directly into actual price levels for your symbol's digits — no manual math required.
- Reversal‑zone highlighting — the table level closest to the current close is highlighted in yellow automatically, so the "zone to watch" is always obvious at a glance.
- Fully adjustable table size — a single input controls the table's font size, and the entire table (cells, spacing, background panel) rescales itself proportionally — from compact to large, for any screen or resolution.
- Clean chart overlay — runs directly on the price chart (no separate window), with a lightweight visual footprint and a show/hide toggle for the table.
Inputs
- ZZDepth , ZZDeviation , ZZBackStep — standard ZigZag sensitivity controls
- ShowTable — show/hide the Fibonacci price table
- FontSizeLabel — table font size (table layout scales automatically to match)
Who it's for
Traders who use ZigZag/Fibonacci swing analysis, harmonic-style price projection, or Elliott-Wave-influenced correction reading, and who want the price math done for them on the chart in real time — instead of drawing Fibonacci tools by hand for every swing.
Notes
Like any ZigZag-based tool, the most recent (still-forming) swing point can move as price develops, only fixing once the leg is confirmed — this is normal ZigZag behavior, not repainting of historical pivots. Currently built and tested primarily on XAUUSD; works on other symbols and timeframes as well.