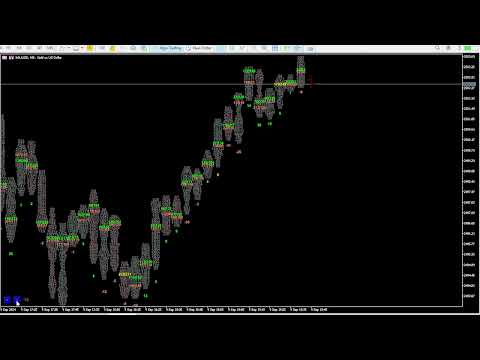
Orderflow Footprint
- Indicadores
-
Panthita Aichoi
 BTC Wallet :
bc1qx685px03km775uapdvje8qz6t839g3fzt0gegv
ETH ERC20
USDT Address:
0x57cF049c965fbE4D25bD2a9aE02B27a04F5574F9 - Versão: 3.3
- Atualizado: 3 junho 2026
- Ativações: 5
Asa Orderflow Footprint v3 — Descrição do Produto
Visão Geral
O Asa Orderflow Footprint é um indicador profissional de gráfico footprint para MetaTrader 5 que renderiza, em tempo real, o volume Bid/Ask (ou contagem de ticks) em cada nível de preço dentro de cada vela. Desenvolvido para traders sérios de fluxo de ordens (order flow), ele vai muito além de um footprint básico, adicionando análise de migração de POC, um painel de fluxo de ordens de visualização rápida, detecção de desequilíbrios empilhados (stacked imbalances), sinalizações de absorção e linhas de POC não testadas (Naked POC) — tudo dentro da janela principal do gráfico, sem a necessidade de subjanelas.
Projetado e testado em feeds de Ouro (XAUUSD), o indicador utiliza um mecanismo de classificação de ticks baseado em flags para separar a atividade iniciada por compradores e vendedores em feeds que fornecem dados do agressor, e alterna automaticamente para uma análise pura de volume por preço em feeds que não fornecem (ver Notas).
Recursos Principais
📊 Gráfico Footprint (Bid | Ask por célula)
- Exibe o volume do lado da venda (Bid) e do lado da compra (Ask) lado a lado em cada nível de preço dentro de cada vela.
- O tamanho da célula é livremente ajustável através dos botões < / > no gráfico — sem necessidade de reabrir as configurações.
- Escolha entre o modo Contagem de Ticks (legado) ou o modo Volume Real (volume_real com fallback para volume).
- Grade de preço fixa: as células nunca mudam de posição enquanto a barra em formação está sendo atualizada.
- Ponto de Controle (POC) destacado automaticamente por vela.
🧭 Migração de POC (NOVO)
- Rastreia como o POC de cada vela se desloca em relação às barras anteriores — a leitura mais limpa de para onde o "valor" está realmente se movendo.
- Medido através de três janelas de histórico configuráveis (ex: 3 / 5 / 15 barras).
- Revela instantaneamente uma tendência saudável (POC subindo/descendo em escada), uma estagnação (POC horizontalizado) ou uma divergência (o preço faz uma nova máxima/mínima enquanto o POC não acompanha).
- Funciona em qualquer feed — baseado em volume por preço, não em delta.
📋 Painel Inteligente / Dashboard (NOVO)
- Um painel único e prático que resume todo o fluxo de ordens — veja a direção, a convicção e os níveis operacionais importantes em um relance.
- Manchete de viés (Bias headline) — direção geral a partir da migração de POC ponderada de curto prazo (pesos configuráveis), codificada por cores em UP (Alta) / DOWN (Baixa) / RANGE (Consolidação).
- Medidor de convicção (Conviction meter) — forte / médio / fraco, impulsionado pelo volume relativo, para que você saiba se um movimento tem participação real do mercado por trás.
- Medidor de migração de POC — janelas de 3 / 5 / 15 barras com exibição selecionável: passos líquidos, contagens de alta-baixa ou porcentagem.
- Sparkline de rastreamento de POC — o POC das últimas barras desenhado como um mini-perfil para ler o formato da migração em um relance.
- Leitura de POC Nu (Naked POC) — os POCs não preenchidos mais próximos acima e abaixo do preço, com distância e um destaque de proximidade quando o preço se aproxima.
- Caráter da última vela — formato do perfil (P / b / equilibrado) e estado de absorção (compra / venda).
- Controles de escala integrados — os botões < / > de tamanho de célula estão embutidos perfeitamente no painel.
- Totalmente móvel — posicione o painel em qualquer canto do gráfico com deslocamento X / Y personalizado; reposicionamento automático ao redimensionar o gráfico.
🔴🟢 Detecção de Desequilíbrio e Absorção
- Vela de Absorção (Absorption Candle) — sinaliza velas onde o POC do lado dominante está deslocado, marcado com um diamante colorido acima/abaixo da barra (verde = lado da compra, salmão = lado da venda).
- Desequilíbrio Diagonal Empilhado (Stacked Diagonal Imbalance) — destaca níveis de preços consecutivos onde o Ask domina o Bid uma célula abaixo (ou vice-versa) por uma proporção configurável, colorido com cores distintas de desequilíbrio de Compra/Venda.
- O comprimento do empilhamento e a proporção de desequilíbrio são totalmente configuráveis (ImbRatio × proporção, linhas mínimas de ImbStack).
📌 Linhas de POC Nu (Naked POC)
- Desenha automaticamente uma linha horizontal no Ponto de Controle de cada barra (célula com maior volume combinado de Bid+Ask).
- As linhas estendem-se para a direita e desaparecem automaticamente assim que o range de uma vela subsequente toca aquele nível de preço.
- Cor, estilo e largura totalmente customizáveis — agem como ímãs e suportes/resistências dinâmicas.
🎯 Marcador de POC na Vela (NOVO)
- Marcador opcional desenhado no preço exato do POC, centralizado dentro de cada vela, para que você possa escanear toda a escada de migração ao longo do gráfico rapidamente.
- Glifo/texto, cor e tamanho da fonte configuráveis.
📋 Linha de Resumo por Vela
- Linha de resumo opcional abaixo de cada vela: B: [compras] S: [vendas] T: [total] [delta%].
- Fornece contexto instantâneo sem a necessidade de ler células individuais.
🔔 Alertas Inteligentes
- Alertas sonoros/pop-up e/ou notificações push para:
- Alinhamento da migração de POC — dispara quando as janelas de 3 / 5 / 15 concordam na direção (um sinal de tendência forte) (NOVO).
- Detecção de desequilíbrio / vela de absorção.
- Inversão do sinal do Delta na barra recém-fechada (em feeds com dados do agressor).
- Os alertas disparam uma vez por vela fechada — sem spam repetido a cada tick.
⚡ Desempenho Otimizado
- Redesenho incremental: apenas a vela em formação (shift 0) é recalculada a cada tick; todas as velas históricas são desenhadas apenas uma vez na abertura da barra.
- Reutilização de objetos: os objetos do gráfico são atualizados diretamente em vez de deletados e recriados, mantendo o uso da CPU baixo mesmo com mais de 100 velas exibidas.
- O trabalho pesado (varredura de naked-POC, migração) roda no fechamento da barra; apenas o volume relativo e a proximidade atualizam intratick.
Parâmetros de Entrada
Principais (Main)
- ShowFootprint — Mostrar/ocultar o texto das células do footprint.
- ShowSummary — Mostrar a linha de resumo B/S/Total/Delta% por vela.
- TPointScale — Tamanho inicial da célula (em pontos); ajustável ao vivo com os botões do painel.
- CountMode — Valor da célula = contagem de ticks ou volume real.
- OFPercent — Limiar da vela de absorção (%).
- CountCandle — Número de velas para renderizar (até 100).
- FontSize — Tamanho da fonte do texto da célula.
- MBidColor / MAskColor — Cor de destaque para células de Bid máximo / Ask máximo.
- sameColor — Cor quando o Bid máximo e o Ask máximo estão na mesma célula.
- NormalColor / BlankDataColor — Cores para células normais e sem dados.
Desequilíbrio (Imbalance)
- ShowAbsorbCandle — Mostrar marcadores de diamante da vela de absorção.
- ShowImbalance — Ativar o destaque de desequilíbrio diagonal empilhado.
- ImbRatio — Proporção mínima de Ask/Bid para sinalizar uma célula de desequilibro diagonal.
- ImbStack — Mínimo de células de desequilíbrio consecutivas necessárias para destacar a zona.
- ImbBuyColor / ImbSellColor — Cores de destaque da zona de desequilíbrio de Compra/Venda.
Alerta (Alert)
- AlertPopup / AlertPush — Ativar alertas pop-up / notificações push.
- AlertOnImb / AlertOnFlip — Gatilho do alerta: vela de desequilíbrio / inversão de delta.
Linhas de POC Nu (Naked POC lines)
- ShowPOC — Mostrar linhas de extensão de POC Nu.
- POCColor / POCStyle / POCWidth — Configurações de aparência da linha POC.
Marcador de POC na vela (POC marker in candle)
- ShowPOCInCandle — Mostrar o marcador de POC centralizado na vela.
- POCInText — Glifo/texto do marcador.
- POCInColor — Cor do marcador.
- POCInFontSize — Tamanho da fonte do marcador.
Painel / Dashboard
- ShowDashboard — Mostrar/ocultar o painel de fluxo de ordens.
- DashCorner — Canto do painel (qualquer um dos 4 cantos).
- DashX / DashY — Deslocamento do painel a partir do canto (pixels).
- MigMode — Exibição da célula de migração: passos líquidos / alta-baixa / porcentagem.
- MigW1 / MigW2 / MigW3 — Janelas de histórico da migração de POC (barras), padrão 3 / 5 / 15.
- BiasWgt1 / BiasWgt2 / BiasWgt3 — Peso do viés por janela (ponderado para o curto prazo por padrão, 3 / 2 / 1).
- RelVolPeriod — Período de média do volume relativo (barras).
- RelVolStrong / RelVolMedium — Limiares de volume relativo para convicção forte / média.
- ProximityPts — Distância (pontos) na qual um POC Nu conta como "próximo".
- AlertOnAlign — Alerta quando as 3 janelas de migração se alinham.
Como Usar
1. Anexe o indicador a qualquer gráfico e tempo gráfico (recomendado XAUUSD M1).
2. Use os botões < > no rodapé do painel para aumentar ou diminuir o tamanho da célula até que cada barra mostre um número legível de linhas de preço.
3. Leia o Painel primeiro: a manchete Bias fornece direção + convicção; o medidor de migração 3 / 5 / 15 e o rastreamento de POC mostram se a tendência é saudável, se está parando ou divergindo.
4. Opere a favor da migração — entre em retornos ao POC de uma vela anterior ou a um nível de POC Nu que se mantenha firme; fique atento a reversões quando a migração estagnar/divergir ou quando um diamante de absorção aparecer contra a tendência.
5. Monitore a leitura de Naked POC para identificar os níveis de alto volume não testados mais próximos acima/abaixo — alvos naturais e zonas de reação.
6. Fique atento às zonas destacadas em ciano (desequilíbrio de compra empilhado) e em magenta (desequilíbrio de venda empilhado) como potenciais clusters de ordens institucionais.
7. Ative os Alertas para ser notificado sobre o alinhamento da migração, velas de desequilíbrio/absorção ou inversões de delta sem precisar monitorar a tela o tempo todo.
Notas & Requisitos
- Requer uma corretora que forneça histórico de ticks via `CopyTicksRange()` — a maioria das corretoras ECN/STP no MT5 atende a isso.
- Recursos baseados em Delta (% de Delta, alerta de inversão de delta e CVD onde aplicável) requerem um feed que identifique os ticks pelo lado agressor (Bid/Ask). Algumas contas — comuns em certos feeds de CFD — enviam ticks combinados de Bid+Ask, o que faz com que a leitura do Delta seja ≈ 0. Nesses feeds, o indicador ainda funciona totalmente através de suas ferramentas de Volume por Preço, POC, Migração de POC, POC Nu e Volume Relativo, que não dependem de dados de agressor.
- O modo Volume Real exige que a corretora forneça `volume_real` nos dados de ticks; o indicador reverte automaticamente para o volume de tick caso não esteja disponível.
- Recomendado rodar nos timeframes de M1 a H1 para uma granularidade significativa do fluxo de ordens.
- Defina o `CountCandle` de forma conservadora (30–50) em tempos gráficos menores para manter os objetos do gráfico sob controle.
- Esta é uma ferramenta de análise — ela não envia ordens e nenhum indicador garante lucro. Sempre use um gerenciamento de risco adequado.


Hello , i have bought your indicator but i cant use it properly because the data are not properly in line the same way as i can see it on your video datas frome previous candlestictk are mixed with data from the second candlestick even when i change the scale and this hapen no matter the TF i use , can you please share the seeting you used on your video ?? it could help a lot for your user :) plus , i see on your video , do you use your indicator on algotrading ?