Best Harmonic Patterns Fibo
- Indicators
- Version: 1.50
- Updated: 1 September 2025

Description of the Harmonic Patterns + Fib Indicator
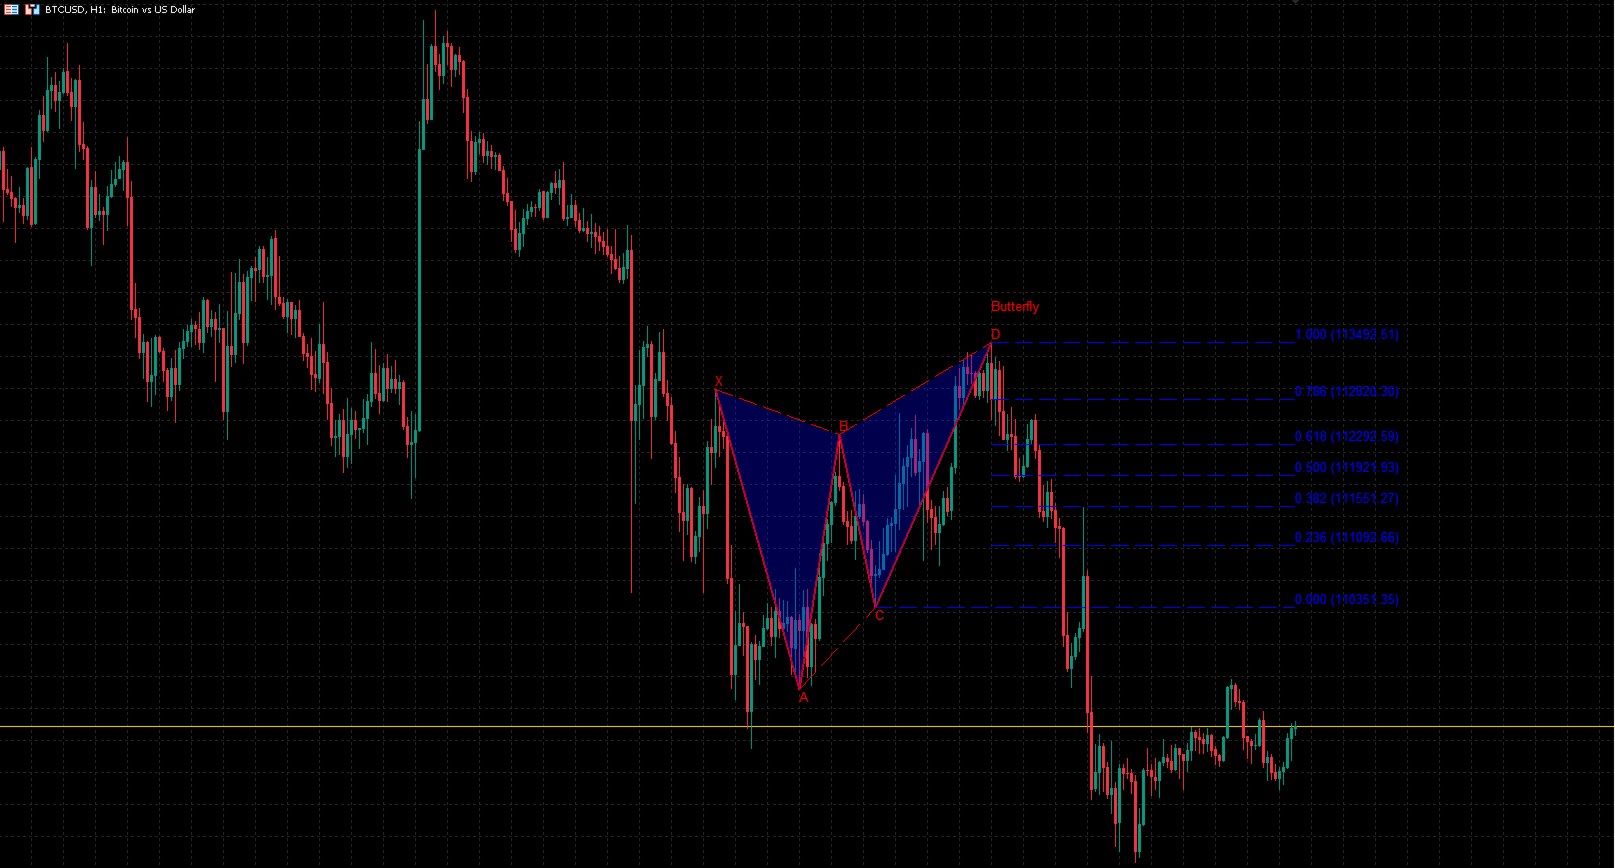
The Harmonic Patterns + Fib indicator is a technical analysis tool designed for MetaTrader 5 (MT5). It automatically detects and visualizes harmonic price patterns on financial charts, leveraging Fibonacci ratios to identify potential reversal points in markets such as forex, stocks, cryptocurrencies, and commodities. The indicator scans for classic harmonic formations like Butterfly, Bat, Crab, Shark, Gartley, and ABCD, drawing them with lines, labels, semi-transparent fills, and optional Fibonacci retracement/extension levels.
Key Features and Functionality:
Pattern Detection:
- Uses pivot high/low detection with a configurable lookback period (default: 5 bars) to identify swing points.
- Scans for 5-point harmonic patterns (bullish: low-high-low-high-low; bearish: high-low-high-low-high) and 4-point ABCD patterns.
- Applies Fibonacci ratio checks (e.g., AB/XA ≈ 0.786 for Butterfly) with a tolerance percentage (default: 15%) to account for market imperfections.
- Limits detection to a maximum number of patterns (default: 1) and scans every N bars (default: 10) for performance optimization.
- Depth limit (default: 20) ensures only recent pivots are considered.
Visualization:
- Draws pattern lines (solid for main segments like XA-AB-BC-CD, dashed for helpers like XB-AC).
- Fills triangular areas (e.g., X-A-B and B-C-D for 5-point patterns) with semi-transparent color (default opacity: 30%) using Canvas for better aesthetics.
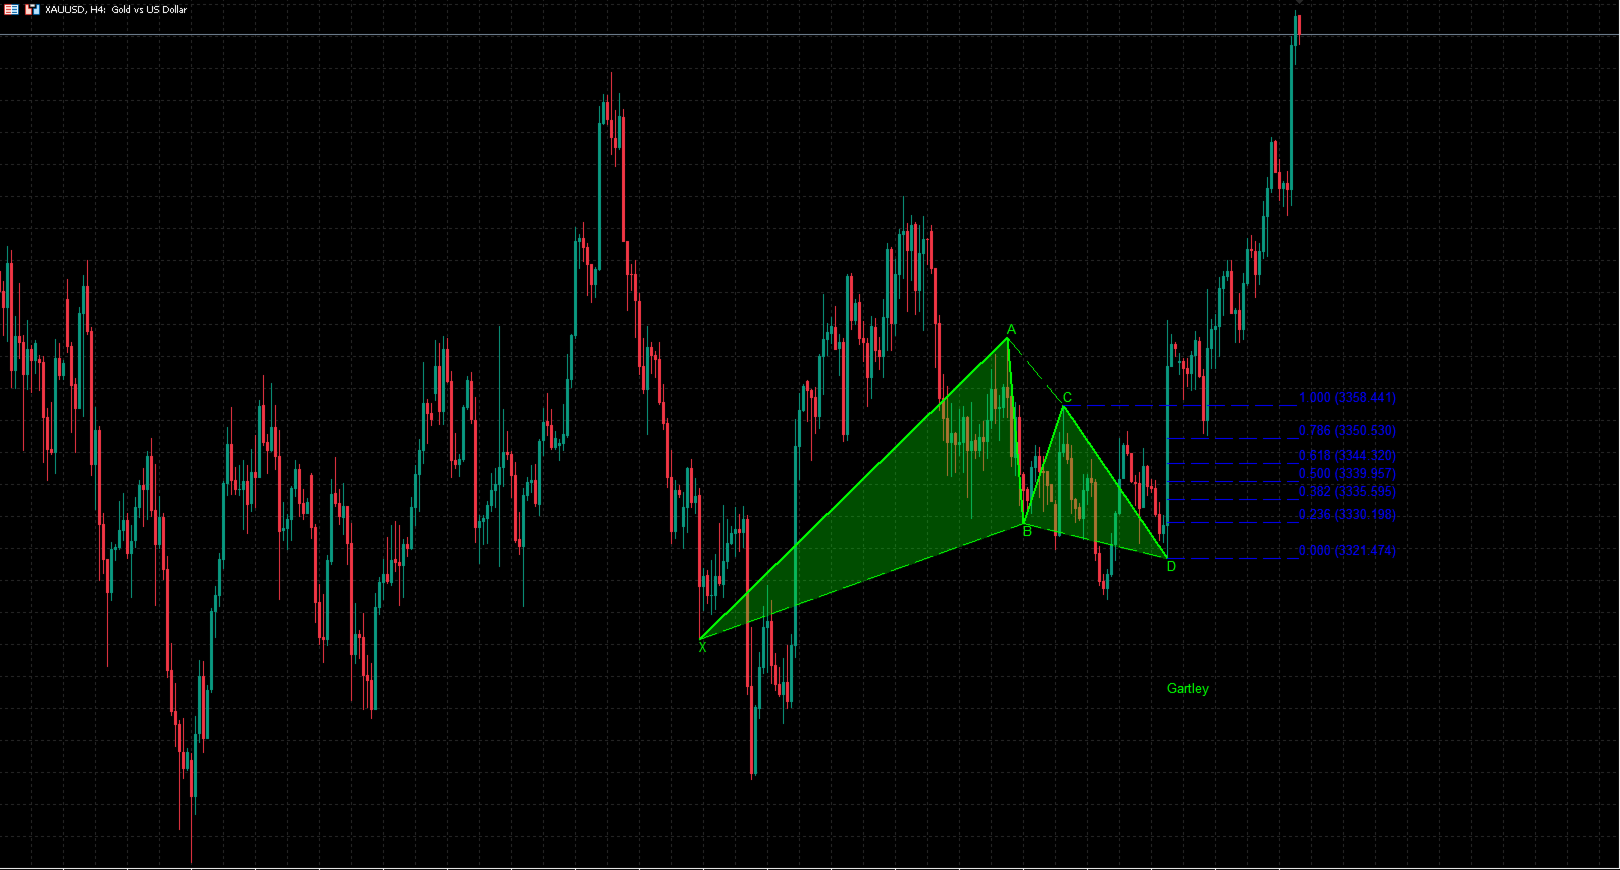
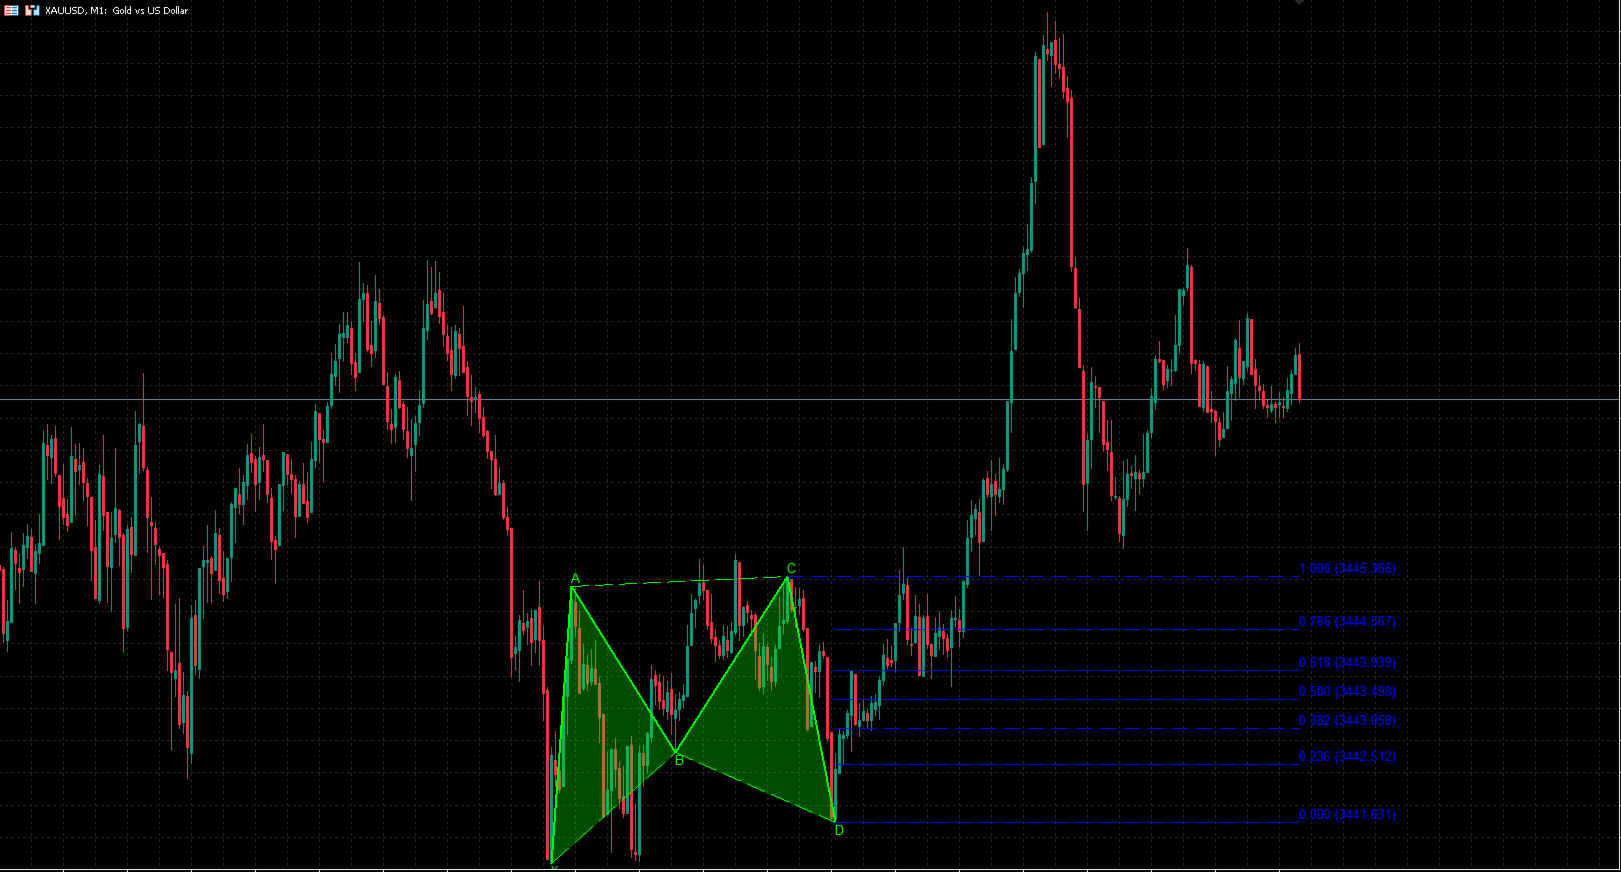
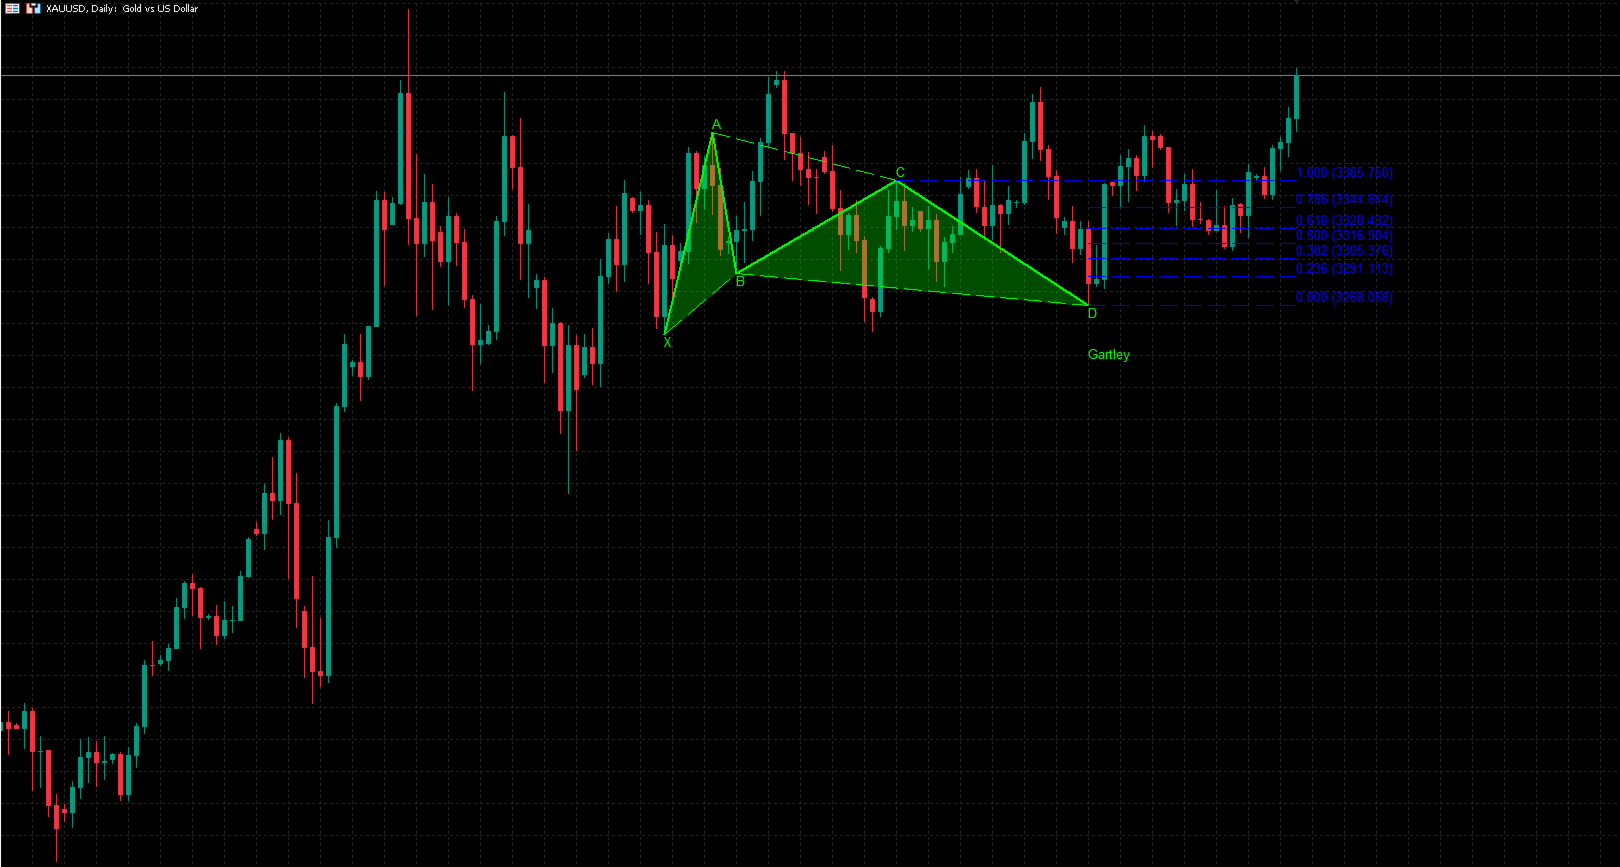
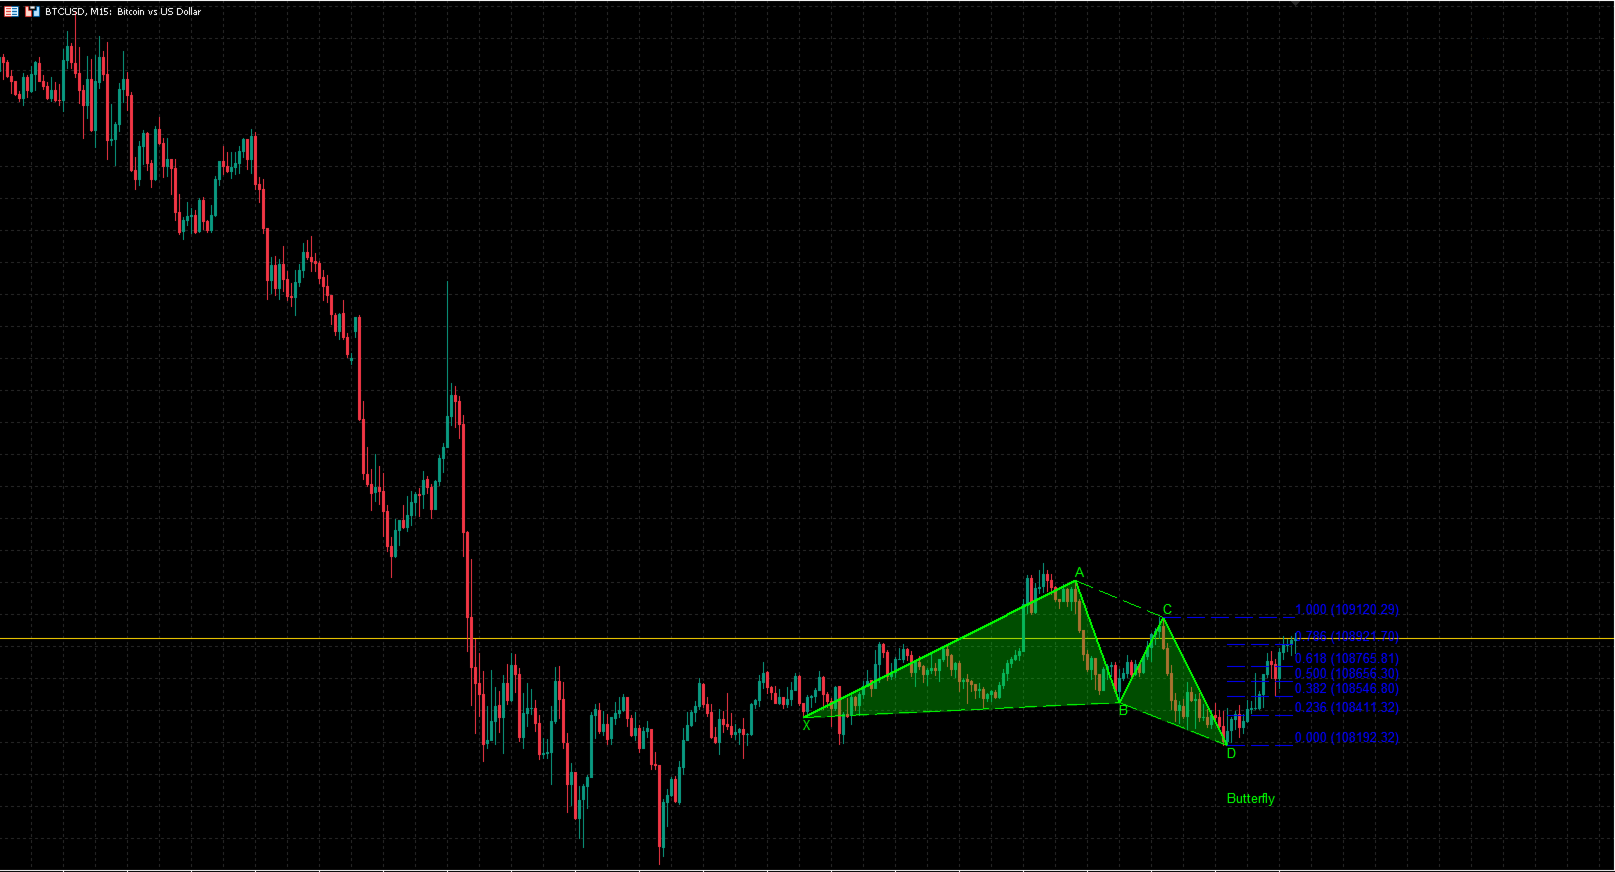
- Labels points (X, A, B, C, D) and pattern name (e.g., "Butterfly") at completion point D, with bullish (lime) or bearish (red) colors.
- Optional Fibonacci levels (0, 0.236, 0.382, 0.5, 0.618, 0.786, 1) projected from point D, with dashed lines and price labels.
- Information table (optional) showing tolerance, pivot counts, and detected patterns.
Customization:
- Toggle specific patterns, bearish formations, lines, labels, fibs, and table via inputs.
- Color settings for bullish, bearish, ABCD, and fib lines.
- Optimized for efficiency: Early exits in ratio checks and limited loop iterations to handle large datasets without lag.
The indicator operates in the OnCalculate function, updating on new bars or at scan frequency, clearing old drawings before rendering new ones.
Applications in Trading:
Harmonic patterns are rooted in Fibonacci geometry and are used to predict price reversals, making this indicator valuable for swing and position traders. Here's how to apply it effectively:
Identifying Reversals:
- Bullish patterns (e.g., Gartley bullish) signal potential uptrends at the end of downtrends—enter long positions at point D.
- Bearish patterns (e.g., Crab bearish) indicate downtrend reversals—enter short positions at D.
- Use on higher timeframes (H4/D1) for trend confirmation and lower ones (M15/H1) for precise entries.
Entry and Exit Strategies:
- Entry: Buy/sell at D upon pattern completion, confirmed by candle close or additional indicators like RSI (oversold for bullish).
- Stop Loss (SL): Place below/above point X (e.g., 1-2% risk per trade) to protect against false patterns.
- Take Profit (TP): Target fib levels (e.g., TP1 at 0.618, TP2 at 1.272). Use trailing stops after partial profits.
- Risk/Reward: Aim for 1:2+ ratios, e.g., 50-pip SL for 100+ pip TP.
Risk Management and Confirmation:
- Combine with trendlines, MACD, or volume for higher accuracy (harmonics work best in ranging markets).
- Backtest patterns on historical data to assess win rates (typically 60-70% with filters).
- Avoid overtrading: Limit to high-probability setups (tight tolerance) and risk <2% capital per trade.
- In volatile markets like crypto, use with news filters to avoid whipsaws.
User didn't leave any comment to the rating