KT Trend Trading Suite MT5
- Indicators
-
KEENBASE SOFTWARE SOLUTIONS
 Keenbase Trading develops professional MetaTrader 4 and MetaTrader 5 indicators and Expert Advisors designed to help traders make more informed trading decisions.
 - Version: 2.0
- Updated: 29 January 2021
- Activations: 10
Follow the Active Trend and Its Pullbacks
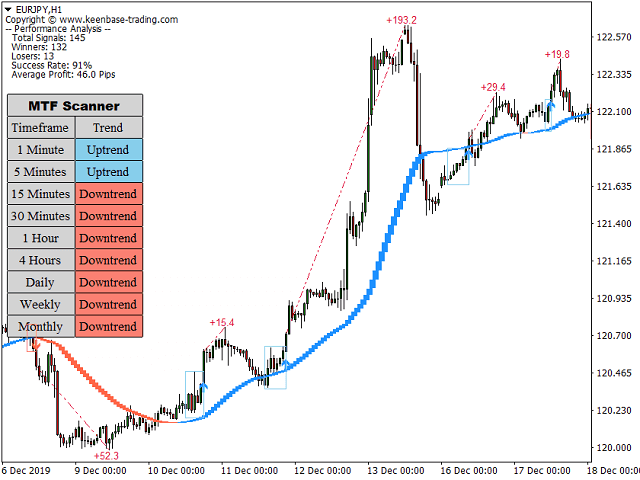
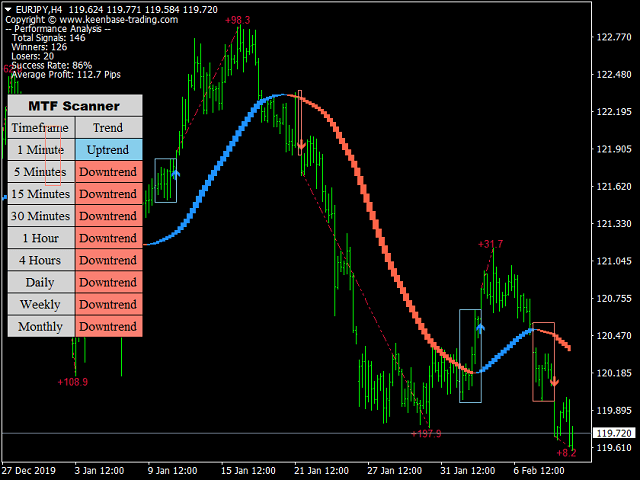
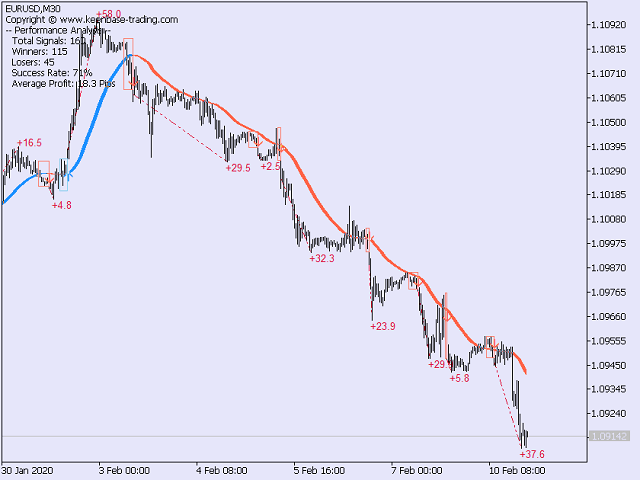
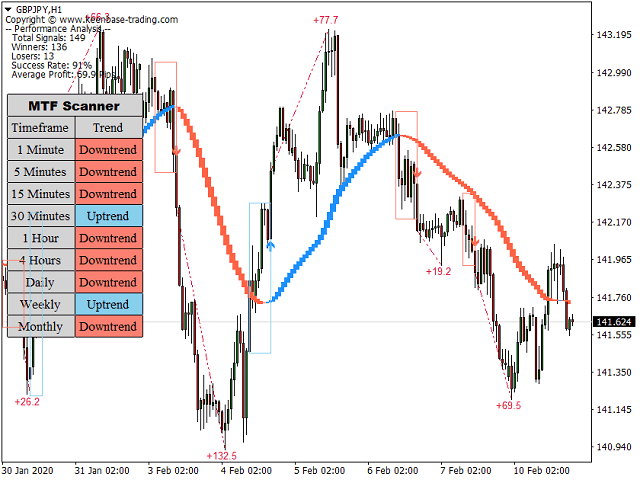
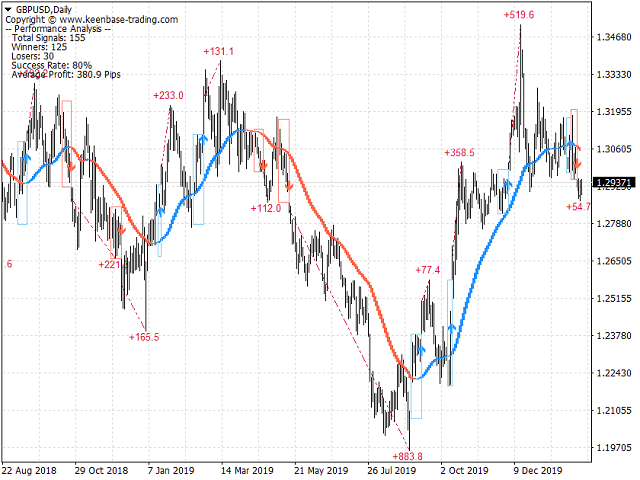
KT Trend Trading Suite combines trend direction with pullback and breakout analysis on the price chart. A color-coded trend line shows the active directional state, while rectangular signal boxes mark continuation opportunities that form after a pullback within that trend.
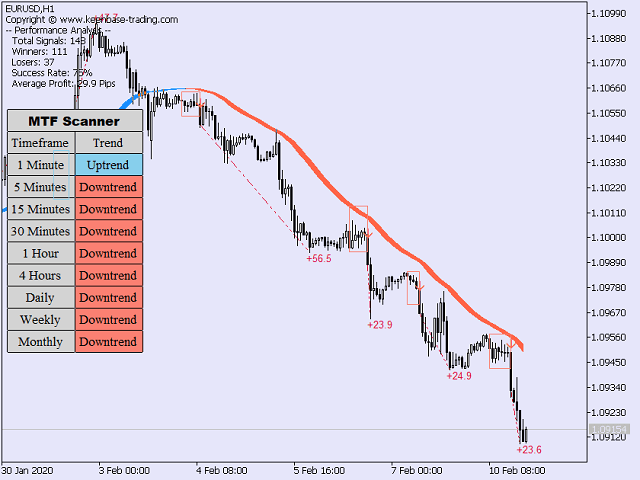
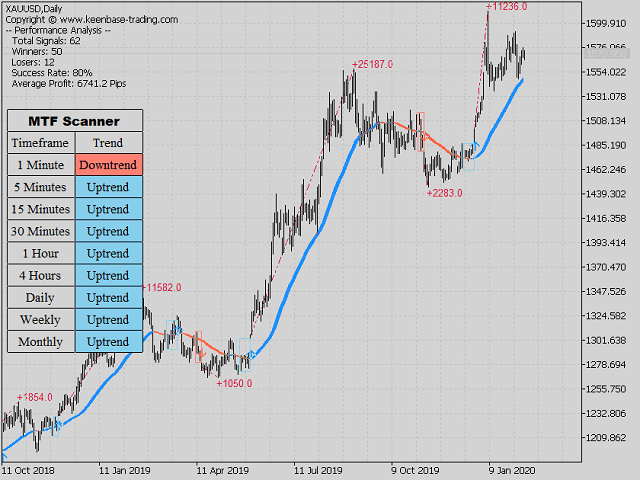
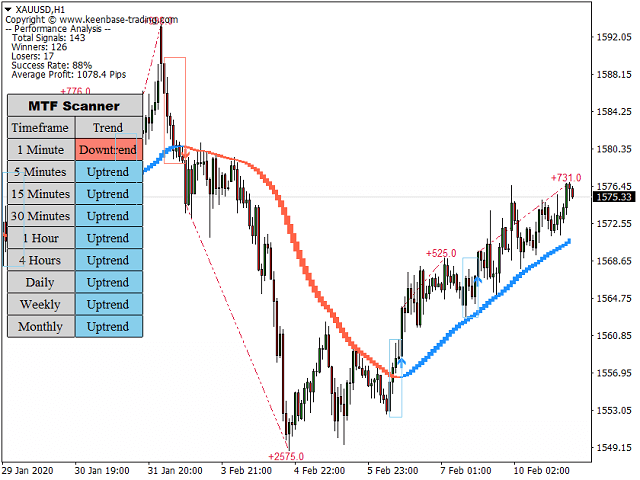
- Blue trend line: shows an established uptrend.
- Salmon trend line: shows an established downtrend.
- Signal box: marks a detected pullback area where a new continuation signal forms.
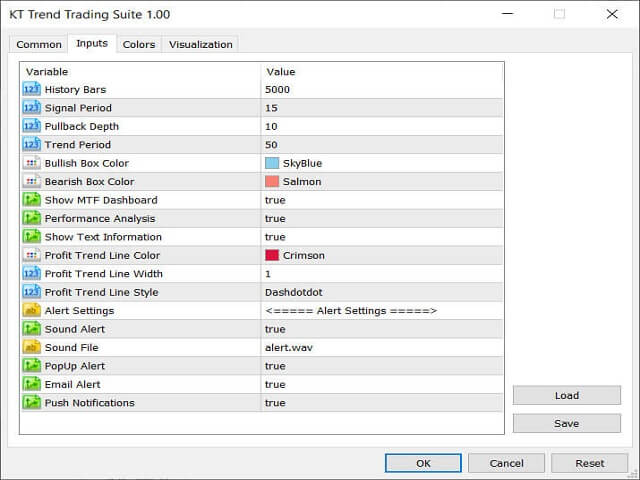
Signal Period controls the magnitude used to identify an entry signal. Pullback Depth controls how much retracement is required before a continuation setup is accepted. Use the boxes as structured chart references and compare them with current price action and your own entry rules.
Compare Direction Across Nine Timeframes
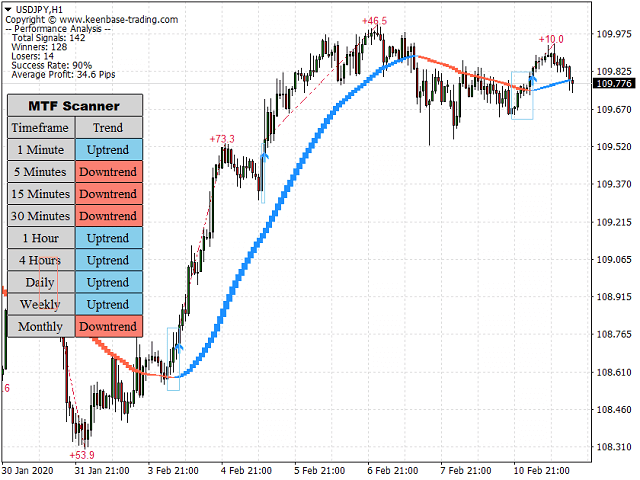
The multi-timeframe scanner displays Uptrend or Downtrend for M1, M5, M15, M30, H1, H4, D1, W1 and MN1. It lets you compare the active chart with shorter and longer periods without opening a separate chart for each timeframe.
The chart line provides the detailed local trend view, while the scanner shows whether that direction is shared across the wider timeframe structure. Show or hide the dashboard according to the space and context you need.
Review the Historical Signal Record
The performance panel summarizes the signals calculated over the displayed chart history. It shows Total Signals, Winners, Losers, Success Rate and Average Profit, while the profit trend line provides a visual record of how the measured signal results developed across that history.
History Bars controls how much past chart data is included. Performance Analysis and Show Text Information can be enabled or disabled, letting you keep the statistics visible during evaluation or use a cleaner chart during routine monitoring.
Adjust the Suite and Choose Your Alerts
Trend Period controls the main trend calculation. Signal Period and Pullback Depth shape the continuation signals, while the bullish and bearish box colors and profit trend line style can be customized to fit your chart.
When a new signal appears, the suite can notify you through the channels that suit your workflow:
- Pop-up alerts on the trading platform
- Sound alerts with a selectable sound file
- Email alerts
- Mobile push notifications
KT Trend Trading Suite brings trend state, pullback signals, multi-timeframe direction and historical signal analysis into one coordinated chart workflow for use with your own confirmation and trade-management rules.