Conheça o Mercado MQL5 no YouTube, assista aos vídeos tutoriais
Como comprar um robô de negociação ou indicador?
Execute seu EA na
hospedagem virtual
hospedagem virtual
Teste indicadores/robôs de negociação antes de comprá-los
Quer ganhar dinheiro no Mercado?
Como apresentar um produto para o consumidor final?
Indicadores Técnicos para MetaTrader 5 - 16

RSI ABCD Pattern Finder: Estratégia Técnica 1. Como o Indicador Funciona Combina o RSI clássico com detecção automática de padrões harmônicos ABCD . Componentes Principais RSI Padrão (período ajustável) Marcações de Topos e Fundos (setas) Padrões ABCD (linhas verdes/vermelhas) Filtros de Overbought (70) e Oversold (30) 2. Configuração no MT5 period = 14 ; // Período do RSI size = 4 ; // Tamanho máximo do padrão OverBought = 70 ; // Nível de sobrecompra OverSold = 30 ; // Nível de sobrevenda Filt
FREE

Indicator Description (based on AVPT EA ):
This indicator visualizes a Volume Profile-based liquidity architecture on the chart by analyzing where trading volume is concentrated across price levels over a specified lookback period. It calculates key volume structures such as:
Point of Control (POC): the price level with the highest traded volume.
Value Area (VA): the range containing a configurable percentage of total volume (typically ~70%).
High-Volume Nodes (HVNs): price levels with sign
FREE
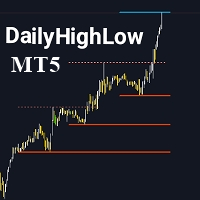
Por favor, não se esqueça de avaliar o indicador para ajudar na sua visibilidade. O indicador DailyHighLow é projetado especificamente para a plataforma MetaTrader 5 (MT5) e tem como objetivo ajudar os traders a monitorar as flutuações diárias dos preços. Este indicador traça automaticamente linhas de tendência com base nos preços mais altos e mais baixos de um período personalizado, oferecendo uma assistência visual clara para os traders que precisam de informações precisas sobre o mercado. Pri
FREE

O KT Trend Trading Suite é um indicador multifuncional que combina uma estratégia de acompanhamento de tendência com múltiplos pontos de rompimento como sinais de entrada.
Assim que uma nova tendência é estabelecida, o indicador oferece várias oportunidades de entrada para aproveitar o movimento. Um limite de recuo é utilizado para evitar entradas menos significativas.
Versão para MT4 disponível aqui https://www.mql5.com/en/market/product/46268
Recursos
Combina diversas dinâmicas de mercad
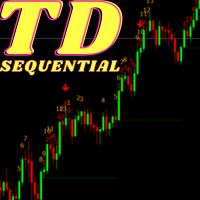
If you are unsure how to use this indicator, please feel free to reach out to me. I will explain it to you and provide reading materials to help you make the most of it. Here’s a brief description of how to use the indicator effectively.
MT4 version: https://www.mql5.com/en/market/product/129509?source=Site +Market+My+Products+Page My Other Products: https://www.mql5.com/en/users/1700046313/seller How to Use TD Sequential by Tom DeMark The TD Sequential is a technical analysis indicator develo

VOLUMIZED ORDER BLOCKS [Riz] - MT5 Indicator Smart Money Order Block Detection with Volume Analysis
Volumized Order Blocks is an advanced Smart Money Concepts (SMC) indicator that automatically detects institutional order blocks with integrated volume analysis. It identifies high-probability supply and demand zones where banks and institutions
FREE

Indicador Triple Exponential Moving Average (TRIX) com sinais de dupla linha, suporte multi-temporalidade, sinais visuais personalizáveis e sistema de alertas configurável.
O que é TRIX? TRIX é um oscilador de momentum que exibe a taxa de mudança de uma média móvel suavizada exponencialmente tripla. O indicador é calculado aplicando três médias móveis exponenciais (EMA) consecutivas ao preço e depois medindo a mudança percentual entre barras. TRIX reduz flutuações menores de preço e ajuda a id
FREE

Was: $99 Now: $49 Blahtech Daily Range indicator displays the average daily range alongside the individual session ranges. Using the daily open price as a reference the indicator shows fixed range and dynamic range targets as lines on the charts. These lines clearly show when the average range has been exhausted. Daily and session ranges can be useful for confirming entries or setting targets and is an excellent odds enhancer for many trading systems. Links [ Documentation | Install | U

"BIG FIGURE INDICATOR" identifica automaticamente e desenha linhas horizontais em gráficos de preços em níveis específicos, como números inteiros ou meio-números (por exemplo, 1.0000 ou 1.5000 em negociações de moedas). Esses níveis são considerados psicologicamente significativos porque representam números redondos nos quais grandes traders e investidores podem se concentrar, levando a potenciais níveis de suporte ou resistência. O indicador de grande figura pode ajudar os traders a identifica
FREE

O comportamento de diferentes pares de moedas está interligado. O indicador Visual Correlation permite exibir diferentes instrumentos em um gráfico enquanto mantém a escala. Você pode definir correlação positiva, negativa ou sem correlação.
Alguns instrumentos começam a se mover mais cedo do que outros. Esses momentos podem ser determinados pela sobreposição de gráficos.
Para exibir um instrumento em um gráfico, insira seu nome no campo Symbol. Version for MT4 https://www.mql5.com/pt/mar
FREE

ICT Unicorn Killer — Complete Liquidity Reversal Detector IMPORTANT: Use in combination with the Multi-Time-Frame 'Unicorn Hunter' (scanner) for a complete detect and kill system. https://www.mql5.com/en/market/product/153999
Unicorn Killer identifies high-probability smart-money reversal setups by combining five key technical confluences into one streamlined visual tool: Fractals → Liquidity Sweep → Break of Structure → Breaker Block → Fair Value Gap → VALID UNICORN! When a Valid Unicorn
FREE

This indicator, the BB Donchian Hybrid (Volatility Breakout Analyzer), is a dual-layered technical analysis tool designed to identify high-probability trend entries by combining statistical volatility with price-action extremes.
By merging the "elasticity" of Bollinger Bands with the "structural" boundaries of Donchian Channels, it filters out the market noise that often leads to false breakouts.
Core Mechanics The indicator operates on two primary mathematical pillars:
The Bollinger Band "S
FREE

VolumeBasedColorsBars — Free Powerful Volume Analysis for All Traders
Unlock the hidden story behind every price bar! VolumeBasedColorsBars is a professional-grade, 100% FREE indicator that colorizes your chart candles based on real, adaptive volume analysis. Instantly spot surges in market activity, identify exhaustion, and catch the moves that matter.
This indicator gives you: • Dynamic color-coded bars for instant volume context • Adaptive thresholds based on historical, session-awar
FREE

BREAKOUT-SESSION-BOX LONDON EU US ASIA Open
watch the expectation of a volatile movement above or under the opening range We take the high of the range as Entry for a long trade and SL will be the low of the range and vice versa the low of the range as Entry for a short trade and the high for SL The size of the range is the distance to the TP (Take Profit) The range of the opening hours should not be larger than about 1/3 of the average daily range 4 breakout examples are already predefined: A
FREE
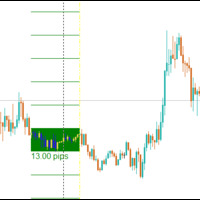
The Central Bank Dealers Range (CBDR) is a key ICT concept, used to project potential highs and lows for the day based on market conditions during a specific time window. The CBDR is utilized to forecast price movements in both bullish and bearish market conditions. By identifying this range, traders can better anticipate the price levels that may form as the day progresses.
CBDR and Standard Deviation A key feature of the CBDR is its application of standard deviation , a statistical measure u
FREE

The idea of a Value Chart indicator was presented in the very good book I read back in 2020 , " Dynamic Trading Indicators: Winning with Value Charts and Price Action Profile ", from the authors Mark Helweg and David Stendahl. The idea is simple and the result is pure genius: Present candlestick Price analysis in a detrended way!
HOW TO READ THIS INDICATOR
Look for Overbought and Oversold levels. Of course, you will need to test the settings a lot to find the "correct" one for your approach. It
FREE

VR Ticks é um indicador especial para estratégias baseadas em scalping. Graças a este indicador, o trader pode ver o gráfico de ticks diretamente no gráfico principal do instrumento financeiro. Um gráfico de ticks permite que você insira uma posição no mercado ou feche uma posição no mercado com a maior precisão possível. VR Ticks plota os dados dos ticks na forma de linhas que mudam de cor dependendo da direção - isso permite compreender e avaliar visualmente a situação nos ticks. A vantagem
FREE

This indicator displays pivot points in the chart, including historical vales, and supports many calculation modes for Pivot Points and S/R levels. [ Installation Guide | Update Guide | Troubleshooting | FAQ | All Products ] It plots historical levels for backtesting purposes
It allows you to select the reference timeframe It implements different Pivot Point calculation modes It implements different SR calculation modes
It implements customizable colors and sizes
Calculation Modes The indicato
FREE
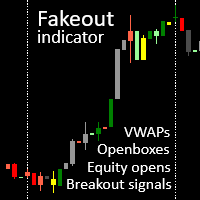
akeout candle indicator with session VWAPs, openboxes and openbox breakout signals. Check out our other products for fxer.net:
https://www.mql5.com/en/market/product/114888
https://www.mql5.com/en/market/product/114890 Main features 1. VWAPS for Tokyo, London and NY sessions 2. Openboxes for Tokyo, London and NY sessions 3. Colored candles for breakouts, fakeouts and inside candles 4. Equity open line 5. Openbox expansions 6. Unmitigated equity open prices for Tokyo, London and NY sessions 7
FREE

O Amiguinho's Bar Counter é um indicador de price action para exibir a contagem de barras (candles) com algumas opções interessantes.
Sobre o parâmetro "Período de análise": caso o timeframe corrente estiver em minutos, então o período de análise será considerado em dias; caso o timeframe corrente estiver em dias, então o período de análise será considerado em meses; ou caso o timeframe corrente estiver em semanas ou meses, então o período de análise será considerado em anos.
FREE

O indicador ACB Breakout Arrows fornece um sinal de entrada crucial no mercado ao detectar um padrão especial de rompimento. O indicador escaneia constantemente o gráfico em busca de um momento de consolidação em uma direção e fornece o sinal preciso logo antes do movimento principal.
Obtenha o scanner de múltiplos ativos e múltiplos períodos aqui - Scanner para ACB Breakout Arrows MT5
Principais recursos Níveis de Stop Loss e Take Profit são fornecidos pelo indicador. Acompanha um painel Scan

Multi Kernel Regression Indicator MT5 Professional Non-Repainting Trend Following System with 17 Advanced Kernel Functions Overview The Multi Kernel Regression indicator is a sophisticated technical analysis tool that applies advanced statistical kernel regression methods to price data, offering traders a powerful edge in identifying trends and potential reversal points. Unlike traditional moving averages, kernel regression provides adaptive smoothing that responds intelligently to market dynam

Experimente o poder do Indicador de Tendências Demark para uma análise abrangente de tendências e insights de negociação. Os indicadores Demark são conhecidos por sua eficácia na avaliação das tendências de mercado e pontos de exaustão. Nosso Indicador de Tendências Demark leva essa expertise para o próximo nível, traçando automaticamente linhas de tendência precisas em seus gráficos. Com parâmetros personalizáveis, incluindo o número de velas nos cálculos, configurações de alarme e cores de lin
FREE

Moving Average Alerts é um indicador simples e eficiente que contém 4 médias móveis totalmente configuráveis, permitindo ao trader escolher períodos, métodos e configurações de acordo com sua estratégia. Cada média móvel possui dois alertas independentes, podendo ser ativados ou desativados separadamente: Alerta quando o preço fecha acima da média
Alerta quando o preço fecha abaixo da média Os alertas são acionados somente no fechamento do candle, evitando sinais repetidos ou falsos durante a fo
FREE

Sessions are very important in trading and often good area where to look for setup. In SMC, ICT we will look for Asian session to serve as liquidity
This indicator displays: High & Low of the Asia session Midnight New York time opening line
Congifuration Line Style, color Label position, size, color Start of the level (Start of the day, Start of the session, Highest or Lowest point in the session)
Any questions or comments, send me a direct message here https://www.mql5.com/en/users/mvonline
FREE

Medidor de volatilidade Phoenix ATR (MT5)
Ferramenta de monitoramento de volatilidade em tempo real para MetaTrader 5. Utiliza o Average True Range (ATR) para exibir a volatilidade atual do mercado em seu gráfico.
Objetivo
A volatilidade do mercado afeta diretamente a colocação de stops, o tamanho das posições, o slippage e a eficácia da estratégia. Negociar sem estar ciente da volatilidade muitas vezes leva a riscos excessivos em mercados rápidos ou a oportunidades perdidas em condições tran
FREE

Este indicador é baseado no famoso indicador fractal mas com muita customização e flexibilidade,
esta é uma ferramenta poderosa para identificar reversões de tendências e maximizar seu potencial de lucro.
Com seus recursos avançados e interface amigável, é a escolha definitiva para traders de todos os níveis. Versão MT4: Ultimate Fractals MT4 Características :
Contagem customizável de velas Fractal. Linhas de reversão. Configurações personalizáveis. Interface amigável. Parâmetros principai
FREE
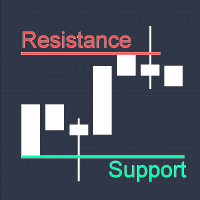
True Support Resistance Indicator: Your Ultimate Tool for Precise Trading Decisions Quick Overview It's a simple indicator that elevates your trading strategy. True Support Resistance Indicator is a powerful tool designed to identify key support/resistance levels in real-time. Experience clean visuals, instant alerts on breakouts, and dynamic updates that keep you ahead of market movements. Why Choose True Support Resistance Indicator? 1. Simplicity Meets Precision - Two clearly colored
FREE
Candle Close Timer Matrix – MT5 Candle Countdown Indicator Candle Close Timer Matrix is a lightweight and powerful MetaTrader 5 (MT5) candle countdown indicator that shows exactly how many minutes and seconds are left before the current candle closes on any symbol and any timeframe. Live Signals & Products Whether you are a scalper , intraday trader or swing trader , knowing the exact candle close time helps you: Time your entries on candle close Avoid impulsive mid-candle decisions Sync your tr
FREE

TILLSON MOVING AVERAGE Também conhecido como indicador TMA ou T3. É uma média móvel que usa EMA e DEMA em sua fórmula e é calculada com uma expansão binomial de 3º grau . ... int handle1; //Handle of the Tillson TMA T3.EX5 custom indicator double euBuff1[]; int TMAperiod= 12 ; int TMSshift= 0 ; double VolumeFactor= 0.618 ; int OnInit () { ... handle1= iCustom ( NULL , PERIOD_CURRENT , "Market\\Tillson TMA T3.EX5" ,0,TMAperiod,0,0,TMSshift,0,0,VolumeFac
FREE

Vector Candles Indicator Vector Candles Indicator is a powerful MT5 tool designed for traders seeking advanced volume analysis and trend insights. It colors candles based on tick or real volume to highlight climax (exhaustion) and super climax (extreme spike) patterns, signaling potential reversals or continuations. Integrated features include 9 customizable EMAs (5-800 periods), Point of Control (POC) from volume profiles, daily pivot levels with midpoints, current day open/high/low lines, arr
FREE

Auto Fibo Expansion, como o próprio nome já diz, é um indicador que projeta os níveis de expansão de Fibonacci acima e abaixo do preço de abertura do dia. Ele faz o cálculo com base no dia anterior e projeta os níveis no dia atual. Ele é muito eficiente para encontrar zonas "psicológicas" de suporte e resistência. Sua aparência é toda configurável e você pode definir até 30 níveis diferentes. Faça bom uso! Este é um indicador gratuito, porém levou horas para desenvolvê-lo. Se desejar me pagar um
FREE

Contador de Candle para MetaTrader 5 O indicador Candle Number exibe uma numeração sobre cada vela do gráfico, iniciando a partir da vela mais recente. Essa funcionalidade auxilia na contagem visual das velas, podendo ser útil em estratégias baseadas em tempo, estrutura ou identificação de padrões.
Funcionalidades: Numera cada vela a partir da vela atual Permite personalização de cor, direção do texto (horizontal ou vertical) e deslocamento da posição Opção de exibir apenas um número limitado
FREE

Linear Regression Trending indicator analyzes price trends by plotting a linear regression channel based on user-defined parameters such as source (for example, close prices), channel length, and deviation multiplier.
How It Works: - The indicator calculates a linear regression line over the specified length, forming a channel with upper and lower boundaries offset by the deviation value. - It detects price breaks from the channel and optionally displays broken channel lines (in a customizable
FREE

The " YK Find Support And Resistance " indicator is a technical analysis tool used to identify key support and resistance levels on a price chart. Its features and functions are as follows:
1. Displays support and resistance levels using arrow lines and colored bands, with resistance in red and support in green.
2. Can be adjusted to calculate and display results from a specified timeframe using the forced_tf variable. If set to 0, it will use the current timeframe of the chart.
3. Uses th
FREE

Melhore a precisão da sua negociação com o indicador WH Trading Sessions MT5 para MetaTrader 5! Esta ferramenta poderosa ajuda você a visualizar e gerenciar as principais sessões de mercado sem esforço. Baseado em: Indicador WH SMC MT5
Versão MT4: Sessões de negociação WH MT4
Principais características: Painel GUI interativo – Selecione e alterne facilmente entre as sessões de negociação da Ásia, Londres e Nova York .
Alertas e configurações personalizáveis – Adapte o ind
FREE

As linhas de resistência de velocidade são uma ferramenta poderosa para identificar linhas de tendência e resistência. O indicador traça linhas usando gráficos extremos e fórmulas matemáticas especiais. O indicador pode ser usado para determinar a direção da tendência e os pontos de reversão.
<---------------------------->
Parâmetros do indicador:
"Depth of search" - profundidade (em barras) da pesquisa de gráficos extremos "Back step of search" - a distância mínima (em barras) entre os extr
FREE

As Ondas de Weis primeiro pegam o volume do mercado e, em seguida, organiza-o com o preço nos gráficos das ondas. É o único software que apresentará a verdadeira imagem do mercado antes de você. Se você já notou o movimento do preço no período intra-diário já deve saber que ele se desdobra em uma série de movimentos de ondas de vendas e compras - movimentos que se desfazem e se acumulam.
A análise de ondas é parte integrante do método de negociação. O indicador ajuda a lidar com o mercado volá
FREE
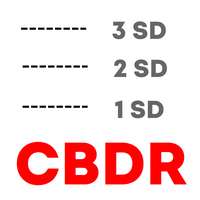
Haven CBDR é um indicador fácil de usar que exibe no gráfico a faixa ICT "Central Bank Dealers Range" (CBDR). O programa desenha retângulos destacando a faixa de preços do CBDR e também mostra linhas adicionais de desvio padrão para avaliar possíveis níveis de suporte e resistência. O produto permite configurar o intervalo de tempo do CBDR, o número de dias exibidos, as cores e estilos dos elementos gráficos, além de ajustar automaticamente o esquema de cores de acordo com o tema do gráfico. Adi
FREE

A combined indicator of two famous indicators: RSI , Bollinger Bands Can be used in all currency pairs Can be used in all time frames with many signals Very simple and fast to use
Description:
This indicator is made from the combination of RSI and Bollinger Bands indicators
As you can see, it shows good signals and is worth using and testing
We hope you are satisfied with this indicator
Settings: show past show candle: Displays the number of candles that the indicator calculates.
For example
FREE
The Moving Average Ribbon is a technical indicator that overlays a series of moving averages (MAs) on a price chart to visualize trend direction, strength, and potential reversals or reentries. It supports both Exponential Moving Averages (EMA) and Simple Moving Averages (SMA), configurable via user input.
Key Features:
Ribbon Composition: Displays 18 moving averages with periods ranging from 5 to 90 in increments of 5 (e.g., MA5, MA10, ..., MA90), plus an internal MA100 for reference. The MA5
FREE

What is this indicator? This indicator is for comparing multiple charts and verifying the chart pattern. Synchronize each chart position with the common vertical line. By changing the chart mode, you can also display the chart like a real trade.
How to set up
1. Scroll the chart of the target currency pair to the end in the past direction and download all the historical data of that currency pair. 2. Install this indicator in the main window of each chart. 3. Customize each parameter on the In
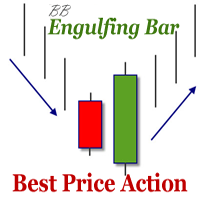
The indicator defines the Bullish and Bearish Engulfing Bar. The pattern has greater reliability when the open price of the engulfing candle is well above the close of the first candle, and when the close of the engulfing candle is well below the open of the first candle. For an engulfing bar to be valid it must fully engulf at least one previous bar or candle - includes all the body and the wick. The engulfing bar can engulf more than one bar as long as it completely engulfs the previous bar.
FREE

If you heard about The Wyckoff Method, Volume Spread Analysis, etc... You are probably searching for the candlestick indicator that shows you the Volume spread all over the current bar, signaling every types of market status... You can control the several Market Levels with custom colors...
It is up to you to decide how to use it. Our job is provide you with the indicator...
If you like this indicator, all I am asking is a little Review (not a Comment, but a REVIEW! )... This will mean A LO
FREE

Apresentamos o Market Structure Break Out para MT5 – Seu indicador profissional de MSB e Zona Não Quebrada. A versão para MT4 também está disponível, confira aqui: https ://www .mql5 .com /en /market /product /109958 Este indicador está sendo continuamente atualizado. Nos esforçamos para fornecer pontos de entrada e saída altamente precisos com base na estrutura do mercado. Estamos agora na versão 1.1, e abaixo estão as últimas mudanças se você se juntar a nós agora: Alvos de Compra e Venda:

A indicator for detecting FVGS
I hope this helps you scalp and generate money for yourself
NOTE BETTER:
Trading is risky and you can lose all your funds , use the money you are willing to lose
NOTE BETTER:
Trading is risky and you can lose all your funds , use the money you are willing to lose
NOTE BETTER:
Trading is risky and you can lose all your funds , use the money you are willing to lose
FREE
What is the Chart Sync Indicator? This custom MQL5 tool enables multi-timeframe chart synchronization, addressing a common pain point in technical analysis: the inconsistencies when switching between chart windows or timeframes. Instead of managing each chart separately, this indicator links them so actions such as panning, zooming, drawing objects, or changing symbols are mirrored across all synced charts of the same symbol. The result is a smoother, unified analysis experience. Key Advantages:
FREE
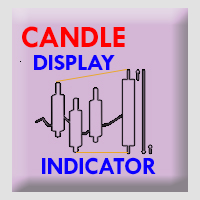
Timeframe Simulator Indicator This indicator redraws candlestick structures from a higher timeframe onto your current chart. It helps visualize higher-period price action without switching timeframes, making it easier to analyze trends and key levels while trading on lower timeframes. Main features: Customizable Candles – Adjust the appearance of higher timeframe candles (bull/bear colors, wick style, gaps, and history length). Higher Timeframe Lines – Optionally display dynamic high, low,
FREE

Advanced Dynamic RSI The **Advanced Dynamic RSI** indicator builds on the classic Relative Strength Index (RSI) developed by J. Welles Wilder. It incorporates volatility-adaptive overbought and oversold levels using moving averages and standard deviation calculations. This adaptation helps the levels adjust to current market conditions, offering a more responsive oscillator compared to fixed thresholds. The indicator is suitable for various instruments and timeframes, supporting analysis in diff
FREE

Stochastic indicator alerts when EA Available in comments , must have indicator installed buys stochastic main line is above signal line stochastic is below 30 rsi 5 is below 20 sell stochastic main line is below signal line stochastic is above 70 rsi 5 is above 80 ADD to chart Stochastic k 30 - d 9 - slowing 3, levels 30/70 rsi 5 lelels 20.80
Full alerts push, mobile , email ect All input settings variable feel free to contact for more information or alert sugestions
FREE

Linear Regression Channel Pro The ultimate tool for statistical trend analysis. Automatically identifies the "Fair Value" of price and volatility extremes. Overview Linear Regression Channel Pro is a professional-grade indicator that automatically draws and updates the Linear Regression Channel for the current market trend. Unlike standard indicators that curve like Bollinger Bands, this tool draws precise straight-line channels based on the "Least Squares" mathematical method. It is designed fo
FREE

Volume & Liquidity Hunter – Scalping um indicador profissional de scalping projetado para rastrear em tempo real picos de volume e zonas de liquidez em múltiplos períodos de tempo.
Ele combina conceitos de "dinheiro inteligente" (smart money) com condições reais de negociação, tornando-o uma ferramenta ideal para scalping com precisão. Seja você um trader que opera em reversões, rompimentos ou lacunas de valor justo (FVG) — este indicador ajuda você a identificar onde está concentrada a verdad

Market Structure Internal & External (CHoCH/BoS) Описание: Индикатор Market Structure Internal & External (CHoCH/BoS) — это мощный инструмент для анализа структуры рынка (Market Structure - MS) , который автоматически определяет и визуализирует ключевые точки разворота (свинги) и пробои структуры на двух различных временных масштабах/глубинах: Внутренней (Internal) и Внешней (External) . Он использует концепции Change of Character (CHoCH) и Break of Structure (BoS) из методологии Smart Money Con
FREE

CPR Pivot Lines It Will Draw Pivot Point R1,R2,R3 S1,S2,S3 Tc Bc Best Part Is That You Can Even Add Values Of High,Low,Close Manually Also To Get Your All Levels On Chart.So If Your Broker Data Of High ,Low ,Close Is Incorrect Then You Don’t Have To Depend On Them Anymore. You Can Even Modify All Lines Style. It Will Show Line In Floting Style And Not Continues Mess.
FREE

Desenha pontos pivôs Traditionnal, Fibonacci, Woodie, Classic, Demark, Camarilla para qualquer período de tempo
Apoiar todo o tipo de pivot Traditionnal, Fibonacci, Woodie, Classic, Demark, Camarilla Apoiar qualquer período de tempo (M1...H1...D1...MN1...Anualmente) Servidor de apoio Horário de Verão Apoio forex secção diária de Sydney aberta para os EUA Fechar Apoiar o comércio Crypto Preencher a lacuna entre o pivot e a tendência, muito útil
Os pontos pivot mostram a direcção da tendência e
FREE

A personal implementation of the famous Bollinger bands indicator as a trend following mechanism, which uses a moving average and the standard deviation to define what a trend is and when it changes. Bollinger bands are usually used as an oversold/overbought indicator only, but in my opinion, the trading approach is more complete using the trend variant as an exit strategy. [ Installation Guide | Update Guide | Troubleshooting | FAQ | All Products ] Easy to trade Customizable colors and sizes I
FREE

If you have the opportunity to read the book " Trend Trading - A Seven-Step Approach to success " by Daryl Guppy, you will have a great deal of information about how to "read" the market. In his book Daryl show, among other things, how can we use a visual tool to measure the volatility and trend between Long and Short-term periods: The GMMA - Guppy Multiple Moving Averages .
Instead of using his original idea of having 12 Exponential Moving Averages in your chart - which could be very CPU-deman
FREE
Special offer : ALL TOOLS , just $35 each! New tools will be $30 for the first week or the first 3 purchases ! Trading Tools Channel on MQL5 : Join my MQL5 channel to update the latest news from me O Fibonacci Confluence Toolkit Multi-Timeframe é uma ferramenta avançada de análise técnica projetada para traders profissionais, ajudando a identificar zonas potenciais de reversão de preços ao combinar sinais e padrões de mercado-chave. Com capacidades de exibição de múltiplos interval

For those who love to trade using the Heikin Ashi Candlesticks, here it is a powerful ally: Heikin Ashi Delta . This indicator was presented by Dan Valcu in his book about Heikin Ashi candlesticks called " Heikin Ashi - How To Trade Without Candlestick Patterns " - and by the way this is a very cool book, we totally recommend it. Even for those of you who don't trade using Heikin Ashi candlesticks could use this Leading Indicator anyway. It is more "nervous" than let's say a Stochastic, but coul
FREE

Overview Magic 7 Indicator is a comprehensive MetaTrader 5 (MQL5) indicator that identifies seven different trading scenarios based on candlestick patterns and technical analysis. The indicator combines traditional price action patterns with modern concepts like Fair Value Gaps (FVG) to provide trading signals with precise entry points and stop loss levels. Features 7 Trading Scenarios : Each scenario identifies specific market conditions and trading opportunities Visual Signals : Clear buy/sell
FREE
N/B: All our product purchase comes with our free ‘’DAILY SCALPER EA’’ - bit.ly/4qlFLNh Whatsapp Developer for yours after successful purchase
HolyGrail Premium System: The Ultimate Supply & Demand Trading Solution
Finally Discover the "Unfair Advantage" That Professional Traders Have Been Using For Years
"I went from inconsistent guessing to precision trading with 83% accuracy once I started combining multi-timeframe confirmation with institutional order flow zones"
Note: After pur

The Ultimate Ichimoku MTF Dashboard: Your All-In-One Trading Edge Transform Your Trading with One Powerful Indicator Imagine having a professional trading assistant that monitors multiple timeframes simultaneously, identifies high-probability entries, warns you of potential reversals, and provides clear risk management guidance-all in one clean, intuitive display. That's exactly what the Ichimoku MTF Dashboard delivers. Why This Isn't Just Another In

Indicador de Sessões de Trading O Indicador de Sessões de Trading visualiza os pontos altos e baixos, bem como os horários de início e fim das sessões de trading da Ásia, Londres e Nova Iorque diretamente no seu gráfico. Funcionalidades: Visualização das principais sessões de trading Destaque dos pontos altos e baixos Exibição dos horários de início e fim de cada sessão Horários das sessões personalizáveis Fácil de usar e eficiente Personalização: Cada sessão de trading (Ásia, Londres, Nova Iorq
FREE

PropFirm Risk Guard is a professional utility designed to assist traders with accurate lot size calculations. In prop firm trading environments, adhering to strict risk management rules is critical. This tool automates the mathematical process, helping traders maintain consistent risk parameters through an intuitive visual interface . Key Features NEW: Interactive Visual Stop Loss: No need to calculate points manually. Simply drag the red line on your chart to your desired Stop Loss l
FREE
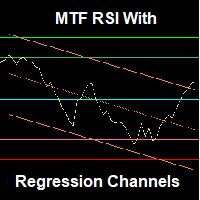
An advanced RSI indicator that displays dynamic linear regression channels in both the indicator window and the price chart, with predefined horizontal levels to detect overbought and oversold zones. Main Features (Summary): Synchronized linear regression channels on both price and RSI Multi–timeframe support Smart and ready-to-use horizontal levels Professional design with optimized performance Feedback & Support We value your experience! If you have any questions, suggestions, or encounter any
FREE

Configuração do gráfico e sinais de compra e venda baseados na estratégia de swing , position e day trade do Stormer (Alexandre Wolwacz, trader brasileiro) , descrito em seu canal no youtube (https://www.youtube.com/watch?v=0QZ_NjWkwl0)
As indicações de compra e venda são baseados em 2 padrões de candle ( Inside Bar [Amarelo] e Preço de Fechamento de Reversão [Azul e Vermelho] ), 3 Médias móveis e 1 Estocástico .
Indicadores: Inside Bar - Padrão de Candle indicador de continuidade da tendênc
FREE

The Range Filter Buy and Sell indicator is a trend-following technical analysis tool designed to identify optimal entry and exit points in the market. It filters out market noise by creating dynamic bands around price movements, generating clear buy and sell signals when price breaks through these bands. Key Features Dynamic Range Filtering : Uses a sophisticated algorithm to calculate adaptive bands that adjust to market volatility Trend Identification : Clearly visualizes the current trend dir
FREE

Um indicador bastante simples, mas que não pode falta na hora de realizar suas operações. Informação rápida e precisa do Spreed antes de entrar numa operação assim como o tempo para iniciar outro candle. Spread refere-se à diferença entre o preço de compra ( procura ) e venda ( oferta ) de uma ação , título ou transação monetária.
Venha conhecer também nossos sinais mql5 https://www.mql5.com/pt/signals/899841?source=Site +Signals+From+Author
FREE

O indicador Weis Waves RSJ soma os volumes de cada onda. É assim que recebemos um gráfico de barras de volumes cumulativos de ondas alternadas. Ou seja, o volume cumulativo torna os gráficos de ondas Weis únicos.
Isto lhe permite comparar a relação das características da sequência de ondas, como correspondência da força aplicada (expressa no volume) e resultado recebido (evolução do preço).
FREE

Este é o indicador final de RVI. setas de alerta adicionadas ele pode identificar os níveis de resistência em potencial 2 filtros adicionais para melhorar as leituras Além disso, é suavizado para mostrar bons resultados ele foi configurado para prazos curtos de m1 a m30 também não funciona mal em Eu recomendo usar este indicador com um filtro adicional como nas imagens do macd.
FREE
O mercado MetaTrader é um espaço, sem precedentes, para negociar robôs e indicadores técnicos.
Leia o artigo Manual do usuário da MQL5.community para saber mais sobre os serviços exclusivos que oferecemos aos traders: cópia de sinais de negociação, aplicativos personalizados desenvolvidos por freelances, pagamentos automáticos através de sistema de pagamento e a rede em nuvem MQL5.
Você está perdendo oportunidades de negociação:
- Aplicativos de negociação gratuitos
- 8 000+ sinais para cópia
- Notícias econômicas para análise dos mercados financeiros
Registro
Login
Se você não tem uma conta, por favor registre-se
Para login e uso do site MQL5.com, você deve ativar o uso de cookies.
Ative esta opção no seu navegador, caso contrário você não poderá fazer login.