Regardez les tutoriels vidéo de Market sur YouTube
Comment acheter un robot de trading ou un indicateur
Exécutez votre EA sur
hébergement virtuel
hébergement virtuel
Test un indicateur/robot de trading avant d'acheter
Vous voulez gagner de l'argent sur Market ?
Comment présenter un produit pour qu'il se vende bien
Indicateurs techniques pour MetaTrader 5 - 16

This indicator shows the breakeven line level for the total number of open positions of the current symbol with P/L value and total volume. This indicator is helpful to decide the exit level when using a trading grid strategy. The style of the breakeven line is customizable to choose the color, line shape and font size of the positions description. Send mobile notification when crossing a positive P/L target
FREE

BUY INDICATOR AND GET NEW EXCLUSIVE EA FOR FREE AS A BONUS! ITALO ARROWS INDICATOR is the best reversal indicator ever created, and why is that? Using extreme reversal zones on the market to show the arrows and Fibonacci numbers for the Take Profit, also with a panel showing all the information about the signals on the chart, the Indicator works on all time-frames and assets, indicator built after 8 years of experience on forex and many other markets. You know many reversal indicators around t

BUY INDICATOR AND GET EA FOR FREE AS A BONUS + SOME OTHER GIFTS! ITALO TREND INDICATOR is the best trend indicator on the market, the Indicator works on all time-frames and assets, indicator built after 7 years of experience on forex and many other markets. You know many trend indicators around the internet are not complete, does not help, and it's difficult to trade, but the Italo Trend Indicator is different , the Italo Trend Indicator shows the signal to buy or sell, to confirm the signal t

BUY INDICATOR AND GET EA FOR FREE AS A BONUS + SOME OTHER GIFTS! ITALO VOLUME INDICATOR is the best volume indicator ever created, and why is that? The Indicator works on all time-frames and assets, indicator built after 7 years of experience on forex and many other markets. You know many volume indicators around the internet are not complete, does not help, and it's difficult to trade, but the Italo Volume Indicator is different , the Italo Volume Indicator shows the wave volume, when market
Introdução O Precision Spike Detector V2 é um indicador avançado para MetaTrader 5 (MT5) projetado para identificar potenciais picos de preço (movimentos bruscos de mercado) em índices sintéticos (DERIV: Boom, Crash; WELTRADE: GainX e PainX).
Ele combina análises de RSI (Índice de Força Relativa) e ATR (Amplitude Média Real) para fornecer sinais precisos e confiáveis. Funciona apenas no período M5 (5 minutos) . Em outros períodos, nenhuma seta será exibida. Principais características Filtro ba

Introducing VFI (Volume Flow Indicator) – a trading indicator that analyzes the relationship between volume and price movement to identify key trading opportunities. The indicator displays the strength and direction of volume flow, providing clear signals about potential entry and exit points. Signals are formed based on zero line crossovers, crossovers between the VFI line and its exponential moving average (EMA), and when the indicator exits overbought and oversold zones.
Attention! This stra
FREE

Trend Dashboard / Trend Scanner – Smart Multi-Timeframe Tool Our Trend Dashboard is an advanced tool for trend analysis that allows you to monitor multiple symbols and timeframes in one place. It displays the current trend direction on popular intervals such as M1, M5, M15, M30, H1, H4, and D1, enabling traders to quickly assess market conditions without manually checking multiple charts. Features: Trend indicators for multiple timeframes in a single dashboard Color-coded trend display: bullish,
FREE
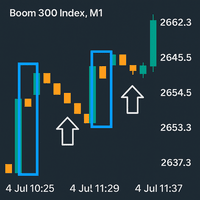
boom Spike Mitigation Zone Pro
A professional spike pattern indicator built for synthetic traders who scalp and swing Boom 500/300/1000/600/900with precision.
This indicator: Detects powerful 3-candle spike formations (Spike → Pullback → Spike) Automatically draws a clean box around the pattern Marks the entry price from the middle candle Extends a horizontal mitigation line to guide perfect sniper entries Automatically deletes & redraws the line once price touches it (mitiga
FREE
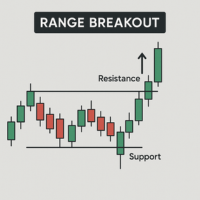
If you love this indicator, please leave a positive rating and comment, it will be a source of motivation to help me create more products <3 Key Takeaways Automatically draws Range High and Range Low boundaries for a chosen time period. Alerts when price breaks above or below the defined range. Support sending notifications via alert, email, notification when breakout occurs. Can be used as a trade signal in breakout-based strategies. However, like all indicators, it isn't foolproof, to avoid
FREE

This indicator shows colored candles when price are strongly distorted in relation to their averages.
A good time for buy can be seen after the closing of a silver candle. The pattern becomes more reliable if the purchase is opened when the price of the candle after the silver candle is above the maximum price of the silver candle.
A good time for sell can be seen after the closing of a pink candle. The pattern becomes more reliable if the sale is opened when the price of the candle after
FREE

AI Trend Targets – Precision Entries, Targets & Risk in One Overlay AI Trend Targets is a premium smart overlay that turns raw price action into clear, rule-based trade plans: entry, dynamic guard (SL) and three projected targets (TP1–TP3).
It is designed for XAUUSD, major FX pairs and index CFDs, and works on intraday as well as higher timeframes. What it does Behind the scenes, AI Trend Targets combines: A volatility-adaptive “AI Baseline” to define trend direction Context-aware rejection logi
FREE

INTRODUCTION TO GPT SPIKES INDICATOR The GPT Spikes Indicator is a revolutionary trading tool specifically engineered for the Boom and Crash markets on the Deriv platform. It leverages cutting-edge algorithms to provide traders with precise market insights, helping them to detect market spikes and reversal points with unparalleled accuracy. Whether you're new to trading or an experienced professional, the GPT Spikes Indicator offers the precision and customization you need to succeed in the vola
FREE

The indicator analyzes the chart and identifies Doji candlesticks. Shows their appearance and signals the appearance of such a candle (if allowed in the parameters). Also, this indicator shows the strength of the reversal in the form of bars of different colors (the more green, the more likely the rise, the more red - the fall in price). The direction of the signal depends on the direction of the previous candles, as the Doji signals a reversal or correction. In the indicator settings, you can
FREE
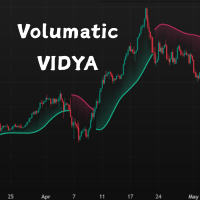
This is a custom VIDYA-based trend-following indicator for MetaTrader 5 (MT5), enhanced with ATR-band logic to adapt to market volatility. It provides dynamic trend zones and intelligent direction switching to support better trading decisions.
Unlike traditional moving averages, this indicator uses a momentum-adjusted VIDYA (Variable Index Dynamic Average) and combines it with ATR-based bands to detect trend shifts with greater precision. Features
Volatility-Adaptive Trend Logic – Uses ATR ban
FREE

Premium trend entry pro TZ Trade Logics, presents you, the enhance version of Premium trend entry This release, bring you much more relaxed trading state with advanced features for trend filtering and premium signal entry timings. For us, is not the creating of the product which matters! but continued maintenance and education to users. through our dedicated means of reaching to us, you will enjoy close guide on how to use the product and other relevant training related to trading. This tradi
FREE

Show Pip Value and Spread on Chart as Object or Comment. User can select to display Pip Value and/or Spread by object on main Chart, or show both only as Comment lines on chart. Object Color, Font face and Size and also which corner to show, may change by user. Pip Value calculated in accordance of input Lot size , Default is 1 lot . Can use at all currency pairs , Gold , Silver and most other charts.
FREE

Divergence indicator 10 different indicators. Finding and displaying classic and hidden divergences.
Indicators in which divergences are searched: MACD MACD Histogram; RSI; Stochastic; CCI; momentum; OBV; VWmacd; Chaikin Money Flow; Money Flow Index. This is a replica of the indicator from the tradingview resource, adapted for the MT5 terminal.
MT4 version available here: https://www.mql5.com/en/market/product/87846
Settings: Bars in history for analysis - number of bars for analysis; D

With this easy to set up indicator you can display and set alerts for the following candlestick formations: Bull Breakout, Bear Breakout, Hammer, Pin, Bullish Engulfing, Bearish Engulfing. Input parameters: ShortArrowColor: The color of the Arrows, displaying a Bearish candle formation LongArrowColor: The color of the Arrows displaying a Bullish candle formation BullishEngulfing: Disabled/Enabled/EnabledwithAlert BearishEngulfing: Disabled/Enabled/EnabledwithAlert Pin: Disabled/Enabled/Enabledw
FREE

This indicator is designed to help traders to help them Synchronize objects across all charts that have the same pair/currency.
Applicable objects: -Rectangle
-Trendlines
-Trendlines by Angle
-Horizontal Lines
-Vertical Lines
-Arrow Lines
-Channels
- Text boxes
Known Issues : - Visualization is not copied to the other charts. - If indicator is only placed in one chart, other charts with the same pair/currency will have difficulty deleting the objects if there is no "Sync Objects In Charts" in
FREE

Volatility Trend System - est un système commercial qui fournit des signaux pour les entrées.
Le système de volatilité donne des signaux linéaires et ponctuels dans le sens de la tendance, ainsi que des signaux pour en sortir, sans redessin ni délai.
L'indicateur de tendance surveille la direction de la tendance à moyen terme, montre la direction et son changement.
L'indicateur de signal est basé sur les changements de volatilité et montre les entrées sur le marché.
L'indicateur est équipé de p

Inspiré par le cours de mentorat privé d'ICT de 2016 (mois 05), partagé sur YouTube, notre outil innovant permet aux traders de naviguer avec précision sur les marchés. En marquant des périodes de 60, 40 et 20 jours, il aide à identifier les mouvements significatifs du marché, en s'appuyant sur la sagesse transmise par ICT. Ce qui distingue vraiment cet indicateur, c'est sa capacité de projection vers l'avant, une caractéristique qui offre des perspectives inestimables sur le comportement futur
FREE
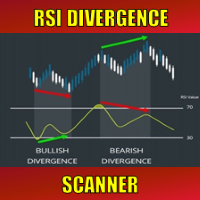
Special offer : ALL TOOLS , just $35 each! New tools will be $30 for the first week or the first 3 purchases ! Trading Tools Channel on MQL5 : Join my MQL5 channel to update the latest news from me Sur les marchés financiers dynamiques, identifier les signaux de renversement de tendance est essentiel pour un trading efficace. Le RSI Divergence Scanner est conçu pour vous aider à détecter avec précision et efficacité les signaux de divergence RSI sur diverses paires de devises et di
FREE

After working during many months, with the help of Neural Networks, we have perfected the ultimate tool you are going to need for identifying key price levels (Supports and Resistances) and Supply and Demand zones. Perfectly suitable to trigger your trades, set up your future actions, decide your Take Profit and Stop Loss levels, and confirm the market direction. Price will always move between those levels, bouncing or breaking; from one zone to another, all the remaining movements are just mark

Introduction This indicator detects volume spread patterns for buy and sell opportunity. The patterns include demand and supply patterns. You might use each pattern for trading. However, these patterns are best used to detect the demand zone (=accumulation area) and supply zone (=distribution area). Demand pattern indicates generally potential buying opportunity. Supply pattern indicates generally potential selling opportunity. These are the underlying patterns rather than direct price action. T
FREE
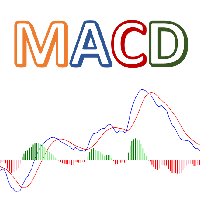
Colorful MACD is MT5 version of TradingView default MACD. This indicator has 4 different colors for MACD histogram, so it's so easy to detect fluctuations in histogram. Features: Colorful Histogram Bars Show/Hide Signal Line Show/Hide MACD Line Flexible price control Please call me if you need more input parameters or modified version of this indicator.
FREE

OmniSignal Navigator – Scalping intelligent aux niveaux clés Tradez comme un professionnel avec cet indicateur quotidien/hebdomadaire High-Low-Close, conçu pour le scalping et le trading de cassures de précision.
Pourquoi ça marche ? Idéal pour le scalping : cible les zones clés (PDH/PDL/PDC et PWH/PWL/PWC) sur les unités de temps M2, M3, M5 et M15. (Unités de temps courtes = plus de signaux, unités de temps longues = moins de signaux) Aucune analyse graphique nécessaire : attendez s
FREE
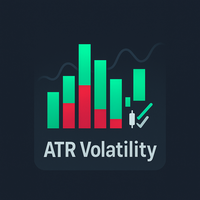
ATR Volatility Histogram pour MT5 – Analyse technique de la volatilité Cet indicateur calcule et affiche la différence entre un ATR rapide et un ATR lent sous forme d’histogramme, permettant de visualiser en temps réel les variations de la volatilité du marché. Calcul
Différence de volatilité = ATR rapide - ATR lent Interprétation Valeurs positives (barres vertes) : indiquent une augmentation de la volatilité et peuvent confirmer l’élan d’une cassure. Valeurs négatives (barres rouges) : indiqu
FREE

YOU CAN NOW DOWNLOAD FREE VERSIONS OF OUR PAID INDICATORS . IT'S OUR WAY OF GIVING BACK TO THE COMMUNITY ! >>> GO HERE TO DOWNLOAD
The Volatility Ratio was developed by Jack D. Schwager to identify trading range and signal potential breakouts. The volatility ratio is defined as the current day's true range divided by the true range over a certain number of days N (i.e. N periods). The following formula is used to calculate the volatility ratio: Volatility Ratio (VR) = Today's True Range
FREE

Market Structure Highs and Lows Overview:
Market Structure Highs and Lows is a professional indicator that automatically detects and visualizes key price structure points — Higher Highs (HH), Higher Lows (HL), Lower Highs (LH), and Lower Lows (LL). It helps traders clearly see trend direction, reversals, and market flow through a clean ZigZag structure. How it works:
The indicator analyzes swing points using a ZigZag algorithm to define structural highs and lows. Uptrend: Sequence of HH and H
FREE

Professional Percentage Levels Indicator Precision-engineered percentage levels based on period opening prices This professional trading tool automatically plots symmetrical percentage levels from Daily, Weekly, or Monthly opening prices, providing traders with clear reference zones for intraday and swing trading strategies. Note: As part of our initial release, this indicator is being made available at no cost for the first 100 users, or until 15 January 2025. Standard pricing of $49.00 applies
FREE

About:
The Nadaraya-Watson Envelope is a sophisticated yet practical technical indicator that helps traders identify overbought and oversold conditions using advanced kernel regression methods. This is the MT5 only Version.
For MT4 Version go here: https://www.mql5.com/en/market/product/158640/
Key Features ATR-Based Bands: Three upper and three lower bands provide graduated overbought/oversold zones Logarithmic Scale Calculation Center Line - bullish (teal) or bearish (red)
What is the Nad
FREE
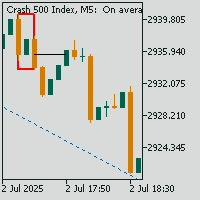
Crash Spike Mitigation Zone Pro
A professional spike pattern indicator built for synthetic traders who scalp and swing Crash 500/300/1000 with precision.
This indicator: Detects powerful 3-candle spike formations (Spike → Pullback → Spike) Automatically draws a clean box around the pattern Marks the entry price from the middle candle Extends a horizontal mitigation line to guide perfect sniper entries Automatically deletes & redraws the line once price touches it (mitigation)
FREE
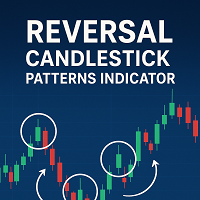
Reversal Candlestick Patterns Indicator — Free Version This MT5 indicator identifies common bullish and bearish candlestick reversal patterns and displays them directly on the chart.
It can be used on any market and timeframe, providing traders with clear visual references for potential reversal points. Main Features Automatic detection of well-known candlestick reversal patterns Works on all available MT5 timeframes Can be applied to Forex, Stocks, Commodities, Indices, and Cryptocurrency char
FREE

The Entry IQ Indicator is a technical analysis tool designed to assist traders in identifying potential entry points for long and short positions. It utilizes dynamic price boxes, equilibrium zones, and trend detection algorithms to analyze market trends and price movements. The indicator adapts to different broker price digit formats, provides customizable arrow signals, and plots real-time trendlines to refine signal accuracy. By assessing price action over a specific lookback period, Entry I
FREE

The MACD 2 Line Indicator is a powerful, upgraded version of the classic Moving Average Convergence Divergence (MACD) indicator.
This tool is the embodiment of versatility and functionality, capable of delivering comprehensive market insights to both beginner and advanced traders. The MACD 2 Line Indicator for MQL4 offers a dynamic perspective of market momentum and direction, through clear, visually compelling charts and real-time analysis.
Metatrader4 Version | All Products | Contact
FREE

IQ FX Gann Levels a precision trading indicator based on W.D. Gann’s square root methods . It plots real-time, non-repainting support and resistance levels to help traders confidently spot intraday and scalping opportunities with high accuracy. William Delbert Gann (W.D. Gann) was an exceptional market analyst, whose trading technique was based on a complex blend of mathematics, geometry, astrology, and ancient mathematics which proved to be extremely accurate. Setup & Guide:
Download MT4 Ver

The " YK Find Support And Resistance " indicator is a technical analysis tool used to identify key support and resistance levels on a price chart. Its features and functions are as follows:
1. Displays support and resistance levels using arrow lines and colored bands, with resistance in red and support in green.
2. Can be adjusted to calculate and display results from a specified timeframe using the forced_tf variable. If set to 0, it will use the current timeframe of the chart.
3. Uses th
FREE

VOLUMIZED ORDER BLOCKS [Riz] - MT5 Indicator Smart Money Order Block Detection with Volume Analysis
Volumized Order Blocks is an advanced Smart Money Concepts (SMC) indicator that automatically detects institutional order blocks with integrated volume analysis. It identifies high-probability supply and demand zones where banks and institutions
FREE

Cet indicateur affiche uniquement les bandes supérieure et inférieure d’un canal de volatilité de type Bollinger, sans tracer la moyenne mobile centrale. Son objectif principal est de fournir une enveloppe de volatilité propre et flexible, permettant aux traders de se concentrer sur le comportement du prix par rapport aux limites du canal, tout en conservant un contrôle total sur l’esthétique et la composition du graphique. Contrairement aux bandes de Bollinger traditionnelles, où la moyenne mob
FREE

Adaptive Hull MA Pro – Trend & Momentum Filter
We value your feedback and believe that your experience with the Hull Moving Average (HMA) is essential to us and other traders. Help us continue to improve and refine our product by sharing your thoughts and insights through a review!
The Hull Moving Average (HMA) Indicator – Your Key to Smoother Trends and Profitable Trades! Are you tired of lagging and choppy moving averages that hinder your ability to spot profitable trading opportunities? Loo
FREE
Oscillateur Elliott - Un outil d'analyse de momentum qui détecte les retournements de tendance à travers les motifs de convergence des moyennes mobiles. L'indicateur affiche des histogrammes bleus pour le momentum haussier et des histogrammes rouges pour les conditions baissières, tout en traçant automatiquement des lignes de tendance entre les pics et vallées significatifs. Système d'Alertes : Choisissez entre deux modes - Les Alertes de Barre Actuelle (alertsOnCurrent = true) se déclenchent im
FREE

Swing Points Indicator for MetaTrader 5
The **Swing Points Indicator** is a custom-built technical tool designed for MetaTrader 5 (MT5), primarily used for identifying crucial reversal points in price action. By plotting swing highs and swing lows, it highlights potential trend reversals, making it a valuable tool for traders relying on price action analysis. This indicator helps traders anticipate changes in market direction by visually marking significant turning points on the chart.
Main F
FREE
Introduction à l'indicateur ZigZag Optimized L'indicateur ZigZag Optimized , développé par MetaQuotes Ltd. et mis à jour en version 2.00, est un outil puissant d'analyse technique sur la plateforme MetaTrader 5. Conçu pour identifier les points de retournement significatifs en reliant les pics et les creux, il offre une précision accrue aux traders. Avantages clés Support précis des divergences : Aide à déterminer des zones de prix raisonnables, assurant une compatibilité élevée avec les algorit
FREE
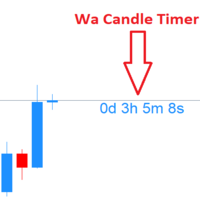
Wa Candle Timer MT5 affiche sur le graphique principal un compte à rebours en direct jusqu’à la clôture de la bougie en cours. À l’approche de la fin du bar, la couleur du timer change (par défaut quand ~95 % de la durée de la bougie est écoulée, soit ~5 % restant).
Indicateur léger, clair, idéal pour synchroniser les entrées/sorties sur les clôtures. Points clés Compte à rebours temps réel jusqu’à la clôture pour tout symbole et unité de temps. Changement de couleur à l’approche de la clôture
FREE

Hello
I Want to introduce The Forex Buy Sell Arrow Premium MT5
i recently release this premium indicator!
its 1000% Non Repaint Indicator,
It Work Perfectly Well,, i tested it day by day, Just mind blowing Result,
Including Powerful trend Algorithm!
How It Work?
well, it work market trend formula, when trend Bullish Or when trend Bearish,
Recommend Timeframe M30, H1 it work all timeframe, and all currency pair,
100% non repaint,
How to take signal From Forex Buy Sell Arrow Premium Ind

The SMC ICT Indicator integrates the key concepts of Smart Money Concepts and Inner Circle Trader into a practical and precise tool.
It displays essential levels and patterns on the chart for clear analysis according to the ICT approach.
Optimized for agile processing, it allows smooth backtesting with no repainting, freezes, or delays—ensuring precision and efficiency in your trading.
Included Concepts It includes Fair Value Gap (FVG), Order Blocks, Imbalance, Gap, Equal High and Equal Low, a

Description:
Heikin-Ashi-like swing oscillator candles. It can be used in the same way as RSI or Stochastic.
For example: Zero crossing. Above the zero line is bullish, below the zero line is bearish.
Overbought or oversold. 100 line is the extreme bought level, -100 line is the extreme sold level.
Divergences.
Time frame: Any time frame.
Instrument: Any instrument.
FREE

================================================================================ VL LEVELS INDICATOR - USER GUIDE VolumeLeaders Institutional Trade Levels for MetaTrader 5 ================================================================================
WHAT IS THIS INDICATOR? ----------------------- This indicator displays VolumeLeaders institutional dark pools trade levels on your MT5 charts. These levels represent price points where significant institutional trad
FREE

Blahtech Moving Average indicator is a multitimeframe version of the standard Moving Average indicator. It is also enhanced with customisable alerts, period breaks and other configuration options. The 50 day and 200 day moving averages are widely followed by investors and traders, with breaks above and below the MA lines considered to be signals of interest. Links [ Install | Update | Training | All Products ]
Feature Highlights Up to three timeframes Configurable calculation variabl
FREE

Advanced Dynamic RSI The **Advanced Dynamic RSI** indicator builds on the classic Relative Strength Index (RSI) developed by J. Welles Wilder. It incorporates volatility-adaptive overbought and oversold levels using moving averages and standard deviation calculations. This adaptation helps the levels adjust to current market conditions, offering a more responsive oscillator compared to fixed thresholds. The indicator is suitable for various instruments and timeframes, supporting analysis in diff
FREE

A heatmap is a graphical representation of data in two dimensions, using colors to display different factors. Heatmaps are a helpful visual aid for viewers, enabling the quick dissemination of statistical or data-driven information. The MP Heatmap indicator provides a graphical representation of the relative strengths of major currencies compared to others, organizing data from pairs into color-coded results and producing a clear overview of the entire Forex market. The MP Heatmap indicator dis
FREE

tendance, pullback, indicateur de tendance, volatilité, atr, moyenne mobile, ema, momentum, oscillateur, flux d’ordres, delta, trading de tendance, scalping
Ce que cela fait
Identifie la tendance principale à l’aide de moyennes mobiles.
Trace des zones de pullback dynamiques basées sur la volatilité.
Affiche le flux directionnel du prix (pression acheteuse ou vendeuse).
Aide à lire le contexte du marché pour des opérations plus précises.
Voici comment j’utilise cet indicateur en pratique

If you love this indicator, please leave a positive rating and comment, it will be a source of motivation to help me create more products <3 How to use QQE? Determine trend when RSI MA above 50 indicate a bullish market, while RSI MA below 50 indicate a bearish market and can server as a trend filter. Identify short-term up/down momentum, when the RSI MA crosses up Smoothed signals bullish momentum, and when the RSI MA crosses down Smoothed signals bearish momentum. It is also possible to
FREE

1. Overview The Scalping PullBack Signal indicator is a powerful technical analysis tool designed to help traders identify scalping opportunities based on potential pullback and reversal signals. This tool is particularly useful on lower timeframes (below 15 minutes) but can also be applied on higher timeframes for longer-term trades. This indicator integrates several key analytical components, providing a comprehensive view of trends and potential entry/exit points, helping you make quick and e
FREE

GEN Sessions Volume Profile Developer: Gede Egi GEN Sessions Volume Profile is an MT5 indicator designed to display the volume distribution for each trading session (daily) in the form of a Volume Profile . With this tool, traders can easily see at which price levels the highest trading activity has occurred during a session, making it easier to identify key market areas. The indicator automatically plots Session Boxes, Point of Control (POC), Value Area High (VAH), Value Area Low (VAL), and Va
FREE

Schaff Trend Cycle (STC) "CON ALERTAS"
El Indicador Schaff Trend Cycle (STC) es una herramienta técnica utilizada en el trading e inversión para identificar tendencias y generar señales de compra o venta. ¿Qué es el Schaff Trend Cycle? El STC fue desarrollado por Doug Schaff para mejorar las medias móviles incorporando análisis de ciclos. Su objetivo es identificar tendencias y cambios de tendencia midiendo la fuerza y velocidad de los cambios de precio. Es un oscilador que mide la velocidad
FREE

Indicator Introduction: The indicator comes from network ,It is more stable relative to RSI or CCI. You can set the indicator to send emails/notifications/alerts when the previous bar has an up or down arrow, you can specify the text of emails by inputing string into the parameter box of "UpMessages/DownMessages". It can be used to analyze market trend and design new expert that is based on trend. If the indicator below the axis ,this is a buy zone. The trend indicator is suitable for M1 and ab
FREE

Il s'agit d'un indicateur personnalisé basé sur l'évolution des prix en chandeliers. Il génère des alertes pour les signaux d'achat ou de vente sur n'importe quel instrument de trading. Il existe du matériel explicatif disponible pour les techniques de validation des signaux, d’entrée et de sortie. Pour en savoir plus, recherchez Benjc Trade Advisor sur YouTube pour des vidéos explicatives.
La dernière version comprend des filtres de tendance et d'oscillateur pour améliorer la précision du sig
FREE

Stop Loss Pro – Precision Risk Management for Every Trader
Stop Loss Pro is a powerful, free MetaTrader indicator designed to take the guesswork out of risk management. Built on advanced market structure analysis, it automatically identifies and displays the most reliable stop‑loss levels directly on your chart. With this tool, traders can protect their trades with confidence, knowing that each suggested level is backed by a blend of technical logic, volume dynamics, and volatility filters. Ho
FREE

Product Name: Harmonic Confluence Indicator (Basic Edition) !!!—-Leave a 5-star review and receive a free indicator version with trade levels (limited to the first 20 people only)——!!! Headline: Automated Harmonic Pattern Scanner with Supply & Demand Confluence. Description: Unlock the power of geometric market structure with the Harmonic Confluence Indicator (Basic Edition) . This powerful tool is designed to automatically scan your charts for high-probability reversal zones based on validated
FREE
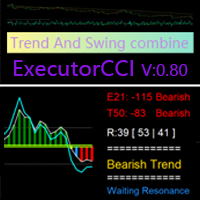
Based on the CCI Trend-Following Principle, Improved to Identify Trend Reversals
This indicator is designed to confirm trends after identifying them using the ( Executor Trend Indicator ) indicator, making it a tool for both trend confirmation and reversal detection. Features Green and Red Histogram: Represents the development of bullish (green) or bearish (red) trends in the current timeframe. Blue Line and Green Histogram (Bullish Confirmation): When the blue line rises above +10
FREE

Necessary for traders: tools and indicators Waves automatically calculate indicators, channel trend trading Perfect trend-wave automatic calculation channel calculation , MT4 Perfect trend-wave automatic calculation channel calculation , MT5 Local Trading copying Easy And Fast Copy , MT4 Easy And Fast Copy , MT5 Local Trading copying For DEMO Easy And Fast Copy , MT4 DEMO Easy And Fast Copy , MT5 DEMO "Cooperative QQ:556024" "Cooperation wechat:556024" "Cooperative email:556024@qq.com" Strong
FREE

Are you tired of plotting Fibonacci retracements or extensions manually? This indicator displays Fibo retracements or extensions automatically, calculated from two different price points, without human intervention or manual object anchoring. [ Installation Guide | Update Guide | Troubleshooting | FAQ | All Products ] Easy to use Manual anchoring is not needed Perfect for price confluence studies The indicator evaluates if retracements or extensions are needed Once drawn, you can manually edit t
FREE

A useful dashboard that shows the RSI values for multiple symbols and Time-frames. It can be easily hidden/displayed with a simple click on the X top left of the dashboard. You can input upper and lower RSI values and the colours can be set to show when above/below these values. The default values are 70 and 30. You can choose whether the dashboard is displayed on the right or left of the chart. If you want to have 2 dashboards on the same chart you must input a different name for each. The sca
FREE

The Anchored VWAP Indicator for MetaTrader 5 gives you full control over where your VWAP starts. Instead of being locked to session opens or fixed times,
you simply drag the anchor point on the chart , and the VWAP instantly recalculates from that exact bar.
This makes it perfect for analyzing:
• Institutional entry zones
• Breakout origins
• Swing highs/lows
• News reaction points
• Trend continuations Key Features Drag & Drop Anchor Point : Move the starting point directly on the chart. The
FREE
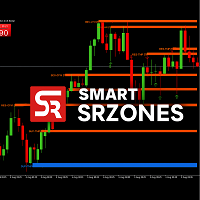
SmartSRZones is an MT5 indicator designed to automatically detect, display, and manage support and resistance zones directly on the chart.
It combines market structure recognition with candlestick pattern detection to help traders view important price levels without manual marking. The indicator is suitable for different trading approaches, including short-term and long-term analysis. Key Features Automatic Zone Detection Identifies support and resistance areas based on swing points, volume, an
FREE

Triangle Pattern Gann v3.1 - Complete Feature Documentation Core Functionality OverviewTriangle Pattern Gann v3.1 is a sophisticated MetaTrader 5 indicator that combines W.D. Gann's geometric trading principles with advanced triangle pattern recognition to deliver actionable trading signals. Primary Features1. Triangle Pattern Detection SystemAscending Triangle Recognition
Function: Automatically identifies bullish continuation patterns Detection Criteria:
Flat horizontal resistance line
FREE

Ichimoku Kinko Hyo is a purpose-built trend trading charting system that has been successfully used in nearly every tradable market. It is unique in many ways, but its primary strength is its use of multiple data points to give the trader a deeper, more comprehensive view into price action. This deeper view, and the fact that Ichimoku is a very visual system, enables the trader to quickly discern and filter "at a glance" the low-probability trading setups from those of higher probability. This i
FREE

This is the Volume Avarage Weighted Price (VWAP) it's a indicator that shows where is the avarage of the current volumes and the levels at which the price is considered premium, above the second upper band, or discount, under the second lower band, it's also very usefull to use the VWAP level as a target for operations since it's a very liquid level so the price it's attracted to it. feel free to leave a feedback either positive or negative based on your expereince with this indicator, enjoy the
FREE
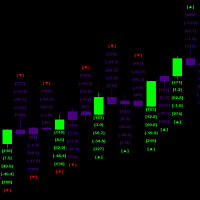
This indicator helps identify the start of significant market movements by analyzing candle patterns and their relative price action strength
the indicator runs multiple simultaneous calculation every millisecond and it also does a triple set verification historically in order to calculate future probabilities the historical processing has to be completed before new Candlestick can be processed as one total set out of the total available history from the starting date and time in order to
FREE
Savez-vous pourquoi MetaTrader Market est le meilleur endroit pour vendre des stratégies de trading et des indicateurs techniques ? Pas besoin de publicité ou de protection logicielle, pas de problèmes de paiement. Tout est fourni dans le MetaTrader Market.
Vous manquez des opportunités de trading :
- Applications de trading gratuites
- Plus de 8 000 signaux à copier
- Actualités économiques pour explorer les marchés financiers
Inscription
Se connecter
Si vous n'avez pas de compte, veuillez vous inscrire
Autorisez l'utilisation de cookies pour vous connecter au site Web MQL5.com.
Veuillez activer les paramètres nécessaires dans votre navigateur, sinon vous ne pourrez pas vous connecter.