适用于MetaTrader 5的技术指标 - 11

本指标 基于 Zigzag 基础上... 增加了: 1.增加了箭头指示,使图表更鲜明 2.增加了价格显示,使大家更清楚的看清价格. 3.增加了报警等设置,可以支持邮件发送 原指标特性: 1.基本的波段指标构型. 2.最近的2个ZIGZAG点不具有稳定性,随着行情而改变,(就是网友所说的未来函数) 3.原指标适合分析历史拐点,波段特性,对于价格波动有一定的指导性.
Zigzag的使用方法一 丈量一段行情的起点和终点 (1)用ZigZag标注的折点作为起点和终点之后,行情的走势方向就被确立了(空头趋势); (2)根据道氏理论的逻辑,行情会按照波峰浪谷的锯齿形运行,行情确立之后会走回撤行情,回撤的过程中ZigZag会再次形成折点,就是回撤点; (3)在回撤点选择机会进场,等待行情再次启动,止损可以放到回撤的高点。 一套交易系统基本的框架就建立起来了。 Zigzag的使用方法二 作为画趋势线的连接点 趋势线是很常见的技术指标,在技术分析中被广泛地使用。 但一直以来趋势线在实战中都存在一个BUG,那就是难以保证划线的一致性。 在图表上有很多的高低点,到底该连接哪一个呢?不同的书上画趋势线的方法
FREE

ADR 反轉指標一目了然地顯示當前價格相對於其正常平均每日範圍的交易位置。當價格超過您選擇的平均範圍和高於它的水平時,您將通過彈出窗口、電子郵件或推送獲得即時警報,以便您可以快速跳入回調和反轉。該指標在圖表上在平均每日範圍極值處繪製水平線,並在這些水平之上延伸,這些水平附加了價格超過它們的數學概率。下面的更多細節...... ADR 警報儀表板補充指標並監控所有配對也可在此處獲得: https://www.mql5.com/en/market/product/66316
MT4 版本也可在此處獲得: https://www.mql5.com/en/market/product/62757
大約 60% 的時間價格在其正常的平均每日範圍 (ADR) 內交易並推高這些水平通常是價格急劇波動的指標,通常會出現回調(獲利了結)走勢。您可以通過交易從每日範圍的頂部或底部回落到最近的支撐位或阻力位來利用這些急劇波動。
收集了超過 20 年的歷史數據,以找出主要外匯對和一系列交叉盤的價格超出特定 ADR 水平的平均百分比。該數據表明價格僅在 3% 的時間內超過其 ADR 的 200%,這意味

The indicator displays volume profiles based on the nesting principle. Profiles periods are pre-set so that each subsequent profile has a length twice as long as the length of the previous profile. In addition to profiles, the indicator displays volume clusters sorted by color, depending on the volume they contain.
Indicator operation features The indicator works on typical timeframes from M5 to MN, but for calculations uses historical data from smaller timeframes: M1 - for timeframes from M5
FREE

ADVANCED MARKET ANALYSIS INDICATOR Overview of the Indicator
This is not a simple indicator — it’s a multi-analysis predictive system. It combines:
Volume Profile (POC, VAH, VAL)
Fibonacci Extensions
Pivot Levels (Daily, Weekly, 4H)
Trend Determination (MA-based)
Smart Money Concepts & Pattern Detection (basic placeholders for expansion)
Prediction Engine (projects price forward for 1 hour)
It gives you:
Target Price Line (projection)
Stop Loss Line (usually at Volume POC)
FREE
Cumulative Delta Volume Indicator for MT5 (CDV Indicator for MT5) Volume-Based Market Sentiment and Trend Strength Indicator The Cumulative Delta Volume (CDV) indicator analyzes the balance between buying and selling volume to reveal the underlying market sentiment.
By accumulating the difference between upward and downward volume, it shows whether buyers or sellers are in control and helps traders confirm the strength or weakness of a trend. This tool provides both candle-based visualization an

KT Momentum Arrows 指标基于瞬时突破计算,它结合了价格波动方向中的带宽偏离和新兴波动率。这是一种对动量变化反应灵敏的技术指标,适合在趋势开始阶段发出交易信号。 当价格收于上轨之上时,生成买入信号;当价格收于下轨之下时,生成卖出信号。 该指标使用一个“幅度系数”作为输入参数,同时影响带宽偏离和波动率计算。建议根据不同品种和时间周期仔细选择和优化该系数值以获得最佳效果。
主要特点
信号不重绘! 非常适合动量交易者的进场工具。 性能分析功能:胜率、盈亏比、平均收益等数据可视化展示。 适用于日内交易者、波段交易者和剥头皮交易者。
输入参数 历史K线数量: 用于指标计算的K线数量。 幅度系数: 用于调节带宽偏离和波动率的单一系数。 性能分析: 显示或隐藏性能分析,包括利润趋势线。 提醒设置: 支持弹窗、邮件、推送和声音提醒。 其余参数无需额外解释,简单明了。

Introduction The "Ultimate Retest" Indicator stands as the pinnacle of technical analysis made specially for support/resistance or supply/demand traders. By utilizing advanced mathematical computations, this indicator can swiftly and accurately identify the most powerful support and resistance levels where the big players are putting their huge orders and give traders a chance to enter the on the level retest with impeccable timing, thereby enhancing their decision-making and trading outcomes.
FREE

Crypto_Forex 指标适用于 MT5 的“趋势修正直方图”。
- 趋势修正直方图有两种颜色:红色表示看跌趋势,蓝色表示看涨趋势。 - 7 个连续的相同颜色直方图柱表示新趋势的开始。 - 趋势修正直方图指标的设计主要目的是最小化损失并最大化利润。 - 它具有参数“周期”,负责指标的灵敏度。 - 内置移动和 PC 警报。 - 趋势修正直方图可以用作简单但有利可图的交易系统,见下文:
如何使用指标: 1) 检查至少 7 个连续的相同颜色直方图柱,这意味着新趋势的开始。例如,下图中有超过 7 个蓝色柱。 2) 等待 1(一个)相反颜色的柱,在我们的例子中是红色,紧接着又变为蓝色。这意味着这是趋势修正。 3) 当出现蓝色柱状图时,开多头交易,在此之前只有一个红色柱状图。这意味着订单在修正后按照主要趋势方向开仓。 4) 安排止损(见图)和获利点。获利点应至少比止损大 3 倍。在这种情况下,即使您只赢了 30%,您也会获利。 5) 卖出(空头)交易反之亦然(见图)。
点击这里查看高质量的交易机器人和指标! 这是仅在此 MQL5 网站上提供的原创产品。
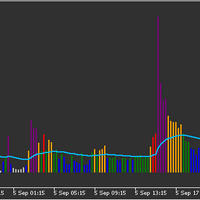
Volume indicator judging level of volume per bar accordingly to Volume Spread Analysis rules. It allows either to set static volume levels or dynamic ones based on ratio comparable to Moving Average. Bars are coloured based on ratio or static levels, visually presenting level of Volume (low, average, high, ultra high). Release Notes - Fixed and optimised calculations of Session Average Volume
- added predefined settings for time to calculate Session Average for EU and US markets
FREE

Volume Profile Flex - POC, VAH and VAL with Price Level Display
Volume Profile Flex is a flexible and performance-optimized Volume Profile indicator designed to help traders identify important price levels based on traded volume rather than time.
The indicator provides a clear view of market acceptance areas, price rejection zones, and the most actively traded price levels directly on the chart. Main Features:
The indicator automatically calculates and displays key Volume Profile levels within
FREE
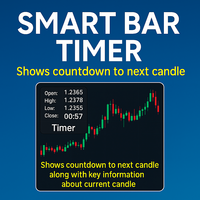
增强型K线计时器 是一个多功能且可定制的MetaTrader 5 (MT5) 指标,实时提供当前K线的信息,包括下一根K线的倒计时、K线细节、成交量和点差。指标显示在用户指定的图表窗口角落,提供多行或单行格式,允许交易者一目了然地监控关键市场数据,提升决策效率和交易效率。 主要功能 实时K线计时器 :显示下一根K线的倒计时(小时、分钟及可选的秒数),支持自定义文本颜色、字体大小和字体类型。 K线信息 :显示当前K线的方向(看涨/看跌)、K线大小(以点计)、实体大小、上下影线大小和价格变化百分比,并根据K线方向使用颜色编码文本。 成交量和点差数据 :可选显示当前K线的成交量(以百万或千为单位)和点差,提供关键市场背景信息。 灵活的显示选项 :可在详细的多行布局或紧凑的单行格式之间选择,支持调整行间距和定位。 无缝MT5集成 :完全兼容MetaTrader 5,确保简单设置和优化的性能,不影响平台速度。 可定制设置 :配置计时器颜色、看涨/看跌颜色、字体、显示角落、与角落的距离,以及秒数、K线信息、成交量和点差的显示开关。 优势 全面的市场洞察 :将K线计时、K线分析、成交量和点差数据整合
FREE

The TickCounter indicator counts up and down ticks on each new bar.
The calculation starts from the moment the indicator is placed on the chart.
Histogram bars represent: Yellow bars - total number of ticks; Blue bars - ticks UP; Red bars - ticks DOWN. If the blue bar is not visible, then there are more down ticks and the red bar is displayed on top of the blue one (the red layer is above the blue one). MT4 version: https://www.mql5.com/en/market/product/82548
Each reinitialization of the i

Presenting one-of-a-kind Gann Indicator for XAUUSD
IQ Gold Gann Levels is a non-repainting, precision tool designed exclusively for XAUUSD/Gold intraday trading. It uses W.D. Gann’s square root method to plot real-time support and resistance levels, helping traders spot high-probability entries with confidence and clarity. William Delbert Gann (W.D. Gann) was an exceptional market analyst whose trading technique was based on a complex blend of mathematics, geometry, astrology, and ancient calcul

### Indicator Description: Gradient Heiken Ashi with Momentum Coloring
This indicator is a technical analysis tool designed to overlay on the main chart, helping traders easily identify price trends and momentum through modified Heiken Ashi candles. It combines smoothed candle value calculations based on moving averages with a gradient color system to represent the strength of bullish or bearish trends.
#### 1. Key Features
- Display of Modified Heiken Ashi Candles:
- The indicator draws opt
FREE

Trend Scanner PRO First of all, it’s worth emphasizing that this trading system is 100% Non-Repainting, Non-Redrawing, and Non-Lagging ,
which makes it ideal for both manual and algorithmic trading setups. Online course, user manual, and downloadable presets included. The Trend Scanner Dashboard is a professional multi pair scanner that analyzes multiple symbols and timeframes at once, giving you an instant market scanner view of the real trend direction. Instead of switching charts endl
Trend Duration Forecast It utilizes a Hull Moving Average (HMA) to detect trend direction and statistically forecasts the probable duration of the current move based on historical market behavior. Key Features Smooth Trend Detection: Uses the Hull Moving Average (HMA) to filter noise while minimizing lag, providing clean Bullish/Bearish signals. Real-Time Duration Counter: Displays a dynamic label at the start of the current trend showing the "Real Length" (number of bars the trend has b
FREE

The Quantitative Qualitative Estimation (QQE) indicator is derived from Wilder’s famous Relative Strength Index (RSI). In essence, the QQE is a heavily smoothed RSI.
Modification of this version: ( converted from tradingview script by Mihkell00, original from Glaz, 100% identical output)
So there are Two QQEs. One that is shown on the chart as columns, and the other "hidden" in the background which also has a 50 MA bollinger band acting as a zero line.
When both of them agree - you get a b

Velocity Renko Heatmap is a separate-window indicator that converts standard time-based price series into Renko-style blocks and colors them by momentum speed. Each block represents a fixed Renko box size, while the color intensity reflects how fast the block was formed relative to recent average formation time. Slow movement appears dim/neutral, fast movement becomes more saturated, enabling quick visual assessment of acceleration and deceleration in trend moves. The indicator is designed for t
FREE
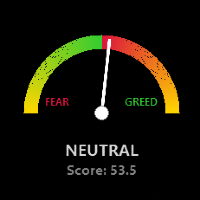
Global Market Risk Sentiment Meter 1. Abstraction The Global Market Risk Sentiment Meter is a sophisticated analytical tool designed for the MetaTrader 5 (MQL5) platform. Unlike traditional indicators that analyze a single asset in isolation, this utility employs an Inter-Market Analysis approach to reconstruct the psychological state of the global financial markets. By aggregating real-time data from US Indices, Global Equities, Cryptocurrencies, and Safe Haven assets (Gold and the US
FREE

The Weis Waves RSJ Indicator sums up volumes in each wave. This is how we receive a bar chart of cumulative volumes of alternating waves. Namely the cumulative volume makes the Weis wave charts unique. It allows comparing the relation of the wave sequence characteristics, such as correspondence of the applied force (expressed in the volume) and received result (the price progress).
If you still have questions, please contact me by direct message: https://www.mql5.com/en/users/robsjunqueira/
FREE
Dynamic Swing Anchored VWAP 是一种高精度的价格–成交量工具,旨在保持对实时市场的相关性。与会随时间漂移的静态 VWAP 不同,该指标将 VWAP 锚定在新的摆动高点和低点,并随着波动性的变化而自动调整敏感度。 结果 → 一条更接近价格的公平价值路径,使回调、重测和均值回归机会更容易识别和交易。 核心功能
摆动锚定
自动检测摆动高点和低点,每次确认新的转折点时,VWAP 从该点重新锚定,保持与当前结构一致。 自适应 VWAP 引擎
使用衰减模型重新计算 VWAP:近期价格×成交量权重更大,旧数据逐渐减弱。基础敏感度由 Adaptive Price Tracking (APT) 控制。
启用波动性调整时,APT 会在剧烈波动时加快,在平静阶段放慢,确保 VWAP 在各种条件下都保持相关性。 波动性感知跟踪
高波动 → VWAP 紧贴价格,更容易找到回调机会。
低波动 → VWAP 平滑,过滤噪音但保持公平价值。 为什么优于传统 VWAP
传统 VWAP 随成交量累积而偏离价格,导致重测机会稀少且不可靠。
Dynamic Swing Anch

Check out my TRADE PLANNER MT5 – strongly recommended to anticipate account scenarios before risking any money. You get a professional moving average indicator with multiple calculation methods available, including exponential, linear, smoothed and linear weighted approaches. The indicator is designed to work on smoothed Heikin Ashi candles, which are included in the 'Examples' folder of Meta Trader 5. By applying this tool, traders can significantly reduce unwanted market noise.
FREE

IQ Trade Status – A Professional Trade Panel to track all your LIVE TRADES in a single dashboard. IQ Trade Status is not just a trade panel; it is a professional dashboard designed for MetaTrader. It replaces the default Terminal window with a clean, structured, and actionable overview of your account and open trades.
The dashboard is designed to help you instantly answer three critical questions: How much have I made today? How much will I lose if all my trades go wrong? Is my account over-lev

自己构建您的策略 这个工具允许您使用MetaTrader本机提供的所有指标以及从互联网下载的使用缓冲区显示数据的指标来开发自己的策略。 这个工具是您考虑将MetaTrader用于自动化交易策略的另一个理由。借助它,您可以以简单直观的方式创建自己的策略信号,使用任何MetaTrader指标。 我如何知道我的互联网下载的指标使用缓冲区? 很简单,只需运行此工具,它会自动发现您的指标拥有的所有缓冲区,并使它们可用于基于它们创建您的策略。 此工具可以自动识别您的指标是否具有缓冲区以及它们拥有多少数据缓冲区。您需要做的就是将缓冲区与正确的值关联起来。 MetaTrader本机指标如移动平均线、相对强弱指数(RSI)、随机指标(Stochastic)和移动平均收敛差离指标(MACD)等都非常容易使用,因为它们已经具有集成的缓冲区。但是,当涉及到从互联网下载的自定义指标时,了解哪个缓冲区与哪个数据相关是很重要的。让我们从头开始吧。 学习使用MetaTrader本机键盘快捷键: 快捷键 描述 CTRL+F 激活鼠标上的十字线,准确识别您正在引用的蜡烛图。 CTRL+D 显示指标缓冲区的数据窗口。 CT
FREE
点击此处查看我所有免费产品
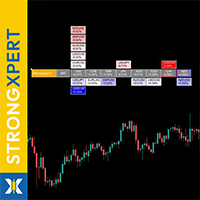
StrongXpert 是你的全球外汇市场 实时强弱监控工具 。 它的设计目的是向你展示 资金实际流入的位置 - 以及资金流出的方向 。 该指标测量 所有八大主要货币的相对强度 (USD, EUR, GBP, JPY, AUD, CAD, CHF, NZD) 并将复杂的价格波动转化为简单、易读的可视化仪表板 - 直接在图表上显示。 几秒钟内即可识别最强和最弱的货币 - 非常适合用于确认交易设置、 过滤趋势方向或捕捉反转点。 不再猜测,不再推测 - 只有清晰的实时市场结构。 许多强弱指标只显示简单计算或延迟数据, 而 StrongXpert 通过 连续实时分析 动态适应市场阶段。 它每秒都会提供最新、精准的货币强弱关系图 - 无延迟、 无重绘、无妥协。 这让你能够在市场波动完全爆发之前快速做出反应。
规格 实时计算 货币相对强度 支持全部八大主要货币 (USD, EUR, GBP, JPY, AUD, CAD, CHF, NZD)
显示强度 百分比或点数
颜色编码:绿色 - 强势,红色 - 弱势
动态排序 根据当前强度自动排序
可调整时间单位
FREE

供需区域:价格过去多次接近的可观察区域。 多功能工具: 66+ 功能 ,包括此指标 | 联系我 如有任何问题 | MT4版本 该指标显示价格可能再次反转的区域。 通常,价格从某一水平被拒绝的次数越多,该水平就越重要。 在输入设置中 您可以调整: 启用或禁用 弱势区域; 显示或隐藏 区域描述; 字体大小; 设置 基本颜色: 分别针对支撑和阻力:
选定的颜色对弱势区域将较不强烈,助于您视觉上分析图表; 计算区域的时间框架; 供需区域 是价格图表上的关键区域,之前在此发生了大量买入(需求)或卖出(供应)。这些区域帮助交易者预测价格走势的 潜在反转或延续 。供需交易最好与 其他工具 结合使用,如趋势线、移动平均线或订单流分析。 如何识别供需区域: 需求区域(买方压力) 形成 :下跌后的强劲看涨走势。 标记方法 : 价格急剧上涨(基础)。 上涨前的基础是需求区域。 从最低蜡烛下影线到盘整区域画一个矩形。 供应区域(卖方压力) 形成 :上升趋势后的强劲看跌走势。 标记方法 : 上涨后的急剧下跌。 下跌前的基础是供应区域。 从最高蜡烛上影线到盘整区域画一个矩形。

KPL Swing 指标是一个简单的趋势跟随机械交易系统,它自动化入场和出场。该系统使用硬止损和跟踪止损以退出盈利交易。没有目标,因为没有人知道价格可以移动多远(或低)。跟踪止损锁定收益并从交易中去除情绪。 由 Amibroker 指标转换,并进行了修改。 KPL Swing 指标是一个简单的趋势跟随机械交易系统,它自动化入场和出场。该系统使用硬止损和跟踪止损以退出盈利交易。没有目标,因为没有人知道价格可以移动多远(或低)。跟踪止损锁定收益并从交易中去除情绪。 由 Amibroker 指标转换,并进行了修改。 KPL Swing 指标是一个简单的趋势跟随机械交易系统,它自动化入场和出场。该系统使用硬止损和跟踪止损以退出盈利交易。没有目标,因为没有人知道价格可以移动多远(或低)。跟踪止损锁定收益并从交易中去除情绪。 由 Amibroker 指标转换,并进行了修改。 完美结合 KPL Chart Uptrend & Downtrend
FREE

BOOM AND CRASH PRO SPIKER This indicator is specifically designed for all boom and crash indices. The indicator targets buy spike signals for boom indices and sell spike signals for crash indices. The indicator contains optimized trend filters to target buy spikes in an uptrend and sell spikes in a downtrend. The indicator also adds a grid signal to recover some loss of the first signal. The indicator also provides exit signals for delayed spikes which can help with risk management. Also, it an
FREE

Daily Zone Breaker - MT5 Indicator Overview Daily Zone Breaker is an advanced multi-kernel regression indicator that identifies critical price zones and breakthrough moments with surgical precision. Using sophisticated kernel smoothing algorithms, it filters out market noise to reveal true directional momentum and key trading zones where price is most likely to break through resistance or support levels. What It Does Core Functionality Daily Zone Breaker analyzes price action through 17 differ

Institutional Liquidity Sweep & Stop Hunt Detector The FAKEOUT MATRIX PRO is a professional-grade analytical tool designed to identify the exact moments when institutional players "trap" retail traders. By monitoring session extremes and detecting high-probability Liquidity Sweeps, this indicator provides the technical edge needed to trade reversals with precision. The Institutional Logic Large financial institutions require significant liquidity to fill their orders. They often find this liquid
FREE

Blahtech Fisher Transform indicator is an oscillator that displays overbought and oversold locations on the chart. The Fisher Transform algorithm transforms prices with any distribution shape into a normal distribution. The end result is a curve with sharp turning points that may help to identify bullish or bearish trends. Fisher Transform values exceeding 1.66 on the daily chart are considered to be good areas for reversal trades. Links [ Install | Update | Training | All Products ]
F

这是基于双均线交叉和箭头标识下单的自定义指标。 当出现蓝色箭头向上时做多单。 当出现红色箭头向下时做空单。 当粉红色线向上穿过绿色线交叉时,粉红色线在上方,绿色线在下方,出现金叉,会出现蓝色箭头。 当粉红色线向下穿过绿色线交叉时,粉红色线在下方,绿色线在上方,出现死叉,会出现红箭头。
这是经典的双线交叉金叉死叉很好的实现,并且用箭头标识出下单点,准确率较高,然后编写出来根据线颜色和箭头很好标识下单方向的指标,无时间,货币对限制。 当前指标最好在30分钟,1小时,4小时上工作,效果较好。 当前指标不建议用在1分钟或5分钟或15分钟或1day以上时间周期,虽然然指标是无限制的,但是效果不太好。 本指标工作平台最好选择点差比较小的交易商。
FREE

This indicator automatically identifies demand and supply zones on a number of 1000 candles or more, and you can change that number of settings.
It also carries a high level of accuracy in describing the type of each zone, as it contains:
Weak areas .
Untested areas . Strong areas . Role-taking areas . Areas tested + number of times visited . Areas to which a return is expected, depending on the direction . The indicator contains alert zones.
For signals and more free indicators, you can foll
FREE

This is a conventional volume indicator, which displays the ticks or real volume (if available from your broker). But it has others features like: 5 color schemes: single, when crossing with moving average, when crossing a specific level, when having different volume between bars and when candle change color. Being hable to have a customizable moving average. Being hable to have a value indicator line. Many thanks to Diego Silvestrin for the ideas to version 1.1 and Konstantin Demidov for
FREE

[Power Volume Candle] - Indicator to see the comparison of bullish and bearish volume
Volume comparison indicator on candlestick, by calculating the volume value of the specified candle history to determine the percentage of volume strength. calculates the percentage comparison of each time frame displayed on 1 screen. Subscribe the MQL5 channel for other interesting information : (Automatic) Forex Tools Join new Public Group to Expressing Opinions and Sharing: Auto Fx Investment See other
FREE

The ultimate M5 indicator for Boom 300 indx, providing clear, filtered buy/sell signals to eliminate market noise and enhance your trading precision. Benefit-Focused spike alert on time
spike signals
spike trade sl 5 candels
trend following dashboard to know trend strength and direction
use it in any market conditions and it will help you to stay profitable and consistent it send mt5 and mobile notification alert right on time all signals are non repaint and no lag

The trend is your friend!
Look at the color of the indicator and trade on that direction. It does not repaint. After each candle is closed, that's the color of the trend. You can focus on shorter faster trends or major trends, just test what's most suitable for the symbol and timeframe you trade. Simply change the "Length" parameter and the indicator will automatically adapt. You can also change the color, thickness and style of the lines. Download and give it a try! There are big movements w

Think of the rarest pair you can think of. And I assure you that this indicator can compute it is strength. This Currency Meter will literally calculate any currency pairs, either it is a major pair, metal, CFD, commodity, cryptocurrency like Bitcoin/BTC or Ethereum/ETH and even stocks. Just name it and you will get it! There is no currency pair this Currency Meter cannot solve. No matter how rare or exotic is that currency, it will always be solved by this Currency meter on a real-time basis. S

Renko是一个永恒的图表,也就是说,它不考虑时间段,而是考虑价格变化,这使得图表上的价格变化更加清晰。
Hyper Renko是提供此功能的指标。
要进行配置,您只有一个参数,即您要使用的对号*中蜡烛的大小。
*勾号:是资产的最小可能变化。
感谢您选择超级交易者指标。
维基百科: 连环图表示变量值(例如金融资产的价格)随时间变化的最小变化。仅当所考虑的值(例如价格)变化了某个最小数量时,图形才会随着时间前进。例如,在考虑资产价格R $ 1变动的Renko图表上,仅当变动发生时(向上或向下)才绘制新的“砖”-不管变动发生了多长时间以及交易量。因此,如果在水平轴上绘制时间,在垂直轴上绘制价格变化,则所有“砖”的高度都相同(价格变化相同),尽管它们在视觉上相同,但它们之间的间距却代表不同的时间量。
FREE

A simple indicator that automatically highlights all FVGs (Fair Value Gaps) formed on the chart, as well as FVGs on history. It is possible to select colors for FVGs of different directions (long or short), select the time interval, select the color of middle point and you can also choose whether to delete filled FVGs or leave them on the chart (the option is beneficial for backtesting). The indicator can be very useful for those, who trade according to the concept of smart money, ICT, or simply
FREE

swing trading logic and professional MQL5 development at first glance. The candlestick chart in the center represents real market structure, showing both bearish (red) and bullish (green) movements. This highlights the indicator’s ability to capture medium-term price swings , not just short scalps. The transition from red candles on the left to green candles on the right visually communicates trend reversal and continuation , which is the core of swing trading. The curved arrows play an importa
FREE

This indicator calculates support and resistance prices in multi-timeframe with different formulation and draw them on the chart that style do you choose. And If you want, Indicator can alert you when the current price arrive these pivot levels. Formulations: Classic, Camarilla, Woodie, Demark, Floor, Fibonacci
Alert Options: Send Mobil Message, Send E-mail, Show Message, Sound Alert
Levels: PP, S1, S2, S3, S4, S5, R1, R2, R3, R4, R5, TC, BC and Middle Points Why do you need this indicator:
Ti
FREE

if you want to test it : private message me ( MT5 demo testing doesn't work ) Designed to help traders gain a deeper understanding of the market’s true order flow dynamics . By visualizing the “ footprints ” left by candles, this indicator reveals how the delta ( the difference between buying and selling pressure ) changes during the candle formation, as well as how volume fluctuates at different price levels. These insights are essential for traders seeking to identify reversals, breakouts, and

As it name implies, this is an exaustion oscillator. However, you may wonder: what differs you from others oscillators like RSI, Stochastic, CCI etc? The difference is that ours is more powerful and accurate ! Your oscillator filters the nois e made by other oscillators, and shows you only the exact moment to enter the trade. Of course, using it alone, like any other indicator, has its risks. Ideally, reconcile it with technical analysis and/or others indicators. If you have any doubt or suggest

Session Finder – Track Forex Market Sessions with Precision
Stay ahead of the market with Session Finder , a sleek HUB style design for MetaTrader 5. It provides real-time visibility into the world’s major trading sessions—Sydney, Tokyo, London, and New York—so you always know which markets are open, closed, or about to change. Key Features: Live Session Status: See whether a session is currently open or closed at a glance. Countdown Timers: Track exactly how long until a session opens or close

For those who appreciate Richard Wyckoff approach for reading the markets, we at Minions Labs designed a tool derived - yes, derived, we put our own vision and sauce into this indicator - which we called Waves PRO . This indicator provides a ZigZag controlled by the market volatility (ATR) to build its legs, AND on each ZigZag leg, we present the vital data statistics about it. Simple and objective. This indicator is also derived from the great book called " The Secret Science of Price and Volum
The VSA (Volume Spread Analysis) Volume Indicator is a powerful technical tool used by traders to analyze the relationship between price movement and trading volume. Rooted in the Wyckoff methodology, VSA helps identify imbalances between supply and demand, revealing the hidden actions of institutional players—often referred to as “smart money.” This indicator evaluates three key elements: volume, price spread (the difference between high and low), and closing price. By interpreting these facto
FREE

Elliot Waves Analyzer calculates Elliot Waves to Help Identify Trend direction and Entry Levels. Mainly for Swing Trading Strategies. Usually one would open a Position in trend direction for Wave 3 or a Correction for Wave C . This Indicator draws Target Levels for the current and next wave. Most important Rules for Elliot Wave Analysis are verified by the Indicator. This free version is limited for Analyzing one Timperiod Waves. Waves are Shown only in PERIOD_H4 and above. Not Useful for Intr
FREE

Market Imbalance Detector is a technical analysis indicator designed to highlight price imbalances, commonly known as Fair Value Gaps (FVGs). The indicator detects imbalance zones using a precise three-candle structure and displays them directly on the chart as visual zones. These areas represent price inefficiencies that may act as potential reaction or interest zones in future price movement. Features Detects bullish and bearish market imbalances Uses a true three-candle structure Works on
FREE
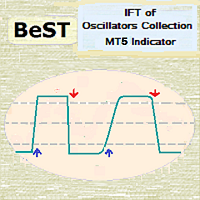
BeST_IFT of Oscillators Collection is a Composite MT4/5 Indicator that is based on the IFT ( Inverse Fisher Transformation ) applied to RSI , CCI , Stochastic and DeMarker Oscillators in order to find the best Entry and Exit points while using these Oscillators in our trading. The IFT was first used by John Ehlers to help clearly define the trigger points while using for this any common Oscillator ( TASC – May 2004 ). All Buy and Sell Signals are derived by the Indicator’s crossings of the Bu
The Precision Scalping Indicator is a powerful and versatile trading tool designed to enhance your scalping strategies across various financial markets. Whether you trade forex pairs, commodities like Gold (XAU/USD), cryptocurrencies such as Bitcoin (BTC), or synthetic indices from Deriv, this indicator adapts seamlessly to your trading style. Key Features: Non-Repainting Signals : Ensures signal reliability by displaying fixed signals that don't disappear or repaint. Audible Alerts : Real-time

Overview The TTM Squeeze indicator helps identify low volatility periods (squeeze) that often precede price breakouts. It uses Bollinger Bands (BB) and Keltner Channels (KC) to determine when the market is "coiling" and ready to move. Configuration Guide Volatility Settings The indicator uses Bollinger Bands to measure market volatility. When BBs are inside Keltner Channels, a squeeze is detected. The squeeze suggests the market is consolidating and may soon break out. True Range Option Optional
FREE

INDICATOR: GEN Zenith Developer: gedeegi General Description GEN Zenith is a technical indicator designed to automatically identify price reversal patterns (Zenith) based on pivot price detection and delta volume movement. This indicator looks for points where the price forms a swing high or swing low, then detects a breakout from that area to confirm a strong reversal signal. This indicator is highly suitable for reversal and breakout strategies, or as a signal confirmation tool in your tradin
FREE

### 介绍 MetaTrader 5 的终极枢轴点水平指标
Ultimate_Pivot_Levels 是一种多功能工具,旨在通过准确绘制枢轴点水平来增强您的交易体验。它允许您手动输入所需的值或使用众所周知的枢轴点计算方法来创建枢轴点水平。它在背景中绘制这些水平,并允许您自定义水平、区域的大小和颜色,同时在每个新柱状图中保持您的调整。无论您是新手交易者还是经验丰富的专业人士,此指标都能为您提供灵活性和精确度,使您能够做出明智的交易决策。
### 主要特点
1. **多种枢轴点计算方法**:Ultimate_Pivot_Levels 指标支持多种枢轴点计算方法,允许您选择最适合您的交易策略的方法:
- **手动值**:输入您的自定义枢轴点水平,或从所需的频道或网站复制粘贴。
- **标准方法**:基于前一周期的高、低和收盘价格的经典枢轴点计算方法。
- **Camarilla 方法**:以其独特公式而闻名的流行方法。
- **Woodie 方法**:一种变体,更多地考虑了收盘价。
- **DeMark 方法**:由 Tom DeMark 开
FREE

Divergence Force 背离指标 描述 Divergence Force 是一个旨在识别资产价格与MACD(移动平均收敛/发散)之间背离的指标。此指标自动绘制价格和MACD的高点和低点上的趋势线,突出潜在的交易机会。 主要功能 自动识别背离 :该指标自动检测价格与MACD之间的看涨和看跌背离。 趋势线跟踪 :自动绘制价格的连续高点和低点上的趋势线,并与MACD的高点和低点进行比较。 买入和卖出信号 :在图表上清晰显示买入("Buy")和卖出("Sell")信号,当检测到背离时显示。当未检测到背离时显示"Neutral"。 标准MACD参数 :使用标准的MACD参数(12, 26, 9)进行计算,确保结果可靠和被认可。 兼容不同时间框架 :优化为在1小时时间框架上运行,但可以根据用户的偏好应用于其他时间框架。 使用方法 安装 :将指标添加到MetaTrader 5平台的 Indicators 文件夹中。 应用到图表 :将指标加载到所需的图表中。该指标将自动开始绘制趋势线并识别背离。 信号解释 : Buy :当检测到看涨背离时,指标将显示"Buy"信号。 Sell :当检测到
FREE

The Anchored VWAP Indicator for MetaTrader 5 gives you full control over where your VWAP starts. Instead of being locked to session opens or fixed times,
you simply drag the anchor point on the chart , and the VWAP instantly recalculates from that exact bar.
This makes it perfect for analyzing:
• Institutional entry zones
• Breakout origins
• Swing highs/lows
• News reaction points
• Trend continuations Key Features Drag & Drop Anchor Point : Move the starting point directly on the chart. The
FREE

YOU CAN NOW DOWNLOAD FREE VERSIONS OF OUR PAID INDICATORS . IT'S OUR WAY OF GIVING BACK TO THE COMMUNITY ! >>> GO HERE TO DOWNLOAD
More About Advanced Currency Meter Every good forex system has the following basic components: Ability to recognize the trend direction. Ability to identify the strength of the trend and answer the basic question Is the market trending or is it in a range? Ability to identify safe entry points that will give a perfect risk to reward (RR) ratio on every position.
FREE
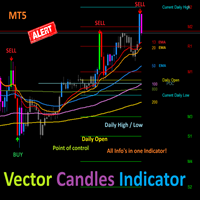
Vector Candles Indicator This is an easy and safe tool for MetaTrader 5 (MT5). It colors candles on your chart based on trading volume to spot trend changes.How to Spot Entry Signals Up Vector Candle: If a green candle with high volume closes (lime or blue color), sell. Price will likely drop back to where the candle started. Down Vector Candle: If a red candle with high volume closes (red or purple color), buy. Price will likely rise back to where the candle started. Detailed setup: Check http
FREE

Developed by Chuck LeBeau, the Chandelier Exit indicator uses the highest high / lowest low -/+ a multiple of the ATR value to draw trailing stop lines (orange under buys, magenta over sells) that advance with the trend until the trend changes direction.The value of this trailing stop is that it rapidly moves upward in response to the market action. LeBeau chose the chandelier name because "just as a chandelier hangs down from the ceiling of a room, the chandelier exit hangs down from the high
FREE

Tabajara Rules for MT5 , based on Professor André Machado’s Tabajara Setup, indicates the market direction using moving averages when there are candles aligned with the direction of the moving average.
The indicator contains the color rule applied to the candles and the moving average.
It allows changing the parameters: period and smoothing method of the moving average.
It also allows changing the colors of the candles (borders and filling) and of the moving average.
Professor André Machado’s
FREE

SMC Order Block Zones (MT5) is a Smart Money Concept (SMC) analytical indicator specially designed and optimized for Gold (XAUUSD) .
It automatically detects Order Blocks and displays them as Supply & Demand zones , helping traders identify potential institutional price levels on Gold. The indicator uses volatility-adaptive logic , making it highly suitable for the fast and aggressive movements of XAUUSD. Key Features (XAUUSD Optimized) Specially designed for Gold (XAUUSD) Automatic Order Block
FREE
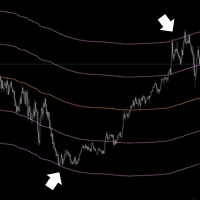
Elevate Your Trading with Advanced Anchored Volume Weighted Average Price Technology Unlock the true power of price action with our premium Anchored VWAP Indicator for MetaTrader 5 - the essential tool for precision entries, strategic exits, and high-probability trend continuation setups. Write me a DM for a 7 day free trial. Anchored VWAP Plus gives traders unprecedented control by allowing custom anchor points for Volume Weighted Average Price calculations on any chart. With support for 4 sim
FREE

It is one of the famous indicator in TradingView platform. Supertrend indicator shows the trend of the market intuitively . You can use it for understanding the trend or get insight about the market.
------- Value & Color -------- You can change the colour (line, filled). Default value is the same as Tradingview Supertrend default value ( period 10, ATR multiplier 3.0)

Introduction
WaveTrend Plus is an amazing oscillator that can detect optimal entry points in the market with high precision using complex computations of price and momentum. This version packs many improvements compared to the original WaveTrend such as cleaner visuals, oversold/overbought signals and divergence detection
Signal
Buy when oversold signal appear (green dot below) or when a bullish divergence is detected (green dashed line)
Sell when overbought signal appear (red dot above) or
FREE

Indicator Description (based on AVPT EA ):
This indicator visualizes a Volume Profile-based liquidity architecture on the chart by analyzing where trading volume is concentrated across price levels over a specified lookback period. It calculates key volume structures such as:
Point of Control (POC): the price level with the highest traded volume.
Value Area (VA): the range containing a configurable percentage of total volume (typically ~70%).
High-Volume Nodes (HVNs): price levels with sign
FREE
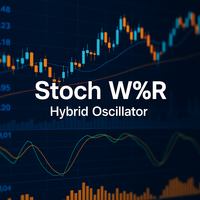
StochW%R 动量震荡指标 – 您的智能混合动量指标 精准。降噪。更可靠。 厌倦了在波动市场中产生虚假信号的传统震荡指标? StochW%R 动量震荡指标 是分析动量领域的演进,它将**随机指标 (Stochastic) 和 威廉指标 (%R)**的优点集于一身,成为一个强大且可自定义的指标。 核心优势: 凭借其智能融合算法,它能 减少市场噪音 并提供 更清晰的信号 ,同时提前预警趋势变化。 为什么这个指标更优越? 两种震荡指标的智能融合 随机指标(平滑化): 在识别超买/超卖条件时,对噪音的敏感度较低。 威廉指标(反向和调整): 对价格的剧烈波动反应更灵敏。 结果: 一条 更精确的动量线 ,能够过滤虚假信号并提高可靠性。 用于完美时机的信号线 与 信号线 (StochW%R 的移动平均线)的交叉有助于: 在价格到达极端区域之前 预测反转 。 确认动量变化 ,且滞后性小于传统震荡指标。 完全自定义 通过**“Stoch Weight” 参数,您可以调整 灵敏度和平滑度之间的平衡**: > 0.5: 受随机指标影响更大(适用于横盘市场)。 < 0.5: 受威廉指标影响更大(非常适合强
FREE

This is RSI with alarm and push notification -is a indicator based on the popular Relative Strength Index (RSI) indicator with Moving Average and you can use it in Forex, Crypto, Traditional, Indices, Commodities. You can change colors to see how it fits you. Back test it, and find what works best for you. This product is an oscillator with dynamic overbought and oversold levels, while in the standard RSI, these levels are static and do not change.
This allows RSI with alarm and push notifica
FREE
What is Double Top and Bottom Double top and bottom patterns are chart patterns that occur when the underlying investment moves in a similar pattern to the letter "W" (double bottom) or "M" (double top). Double top and bottom analysis is used in technical analysis to explain movements in a security or other investment, and can be used as part of a trading strategy to exploit recurring patterns. you can fin MT4 version hier
Indicator shows you 2 Level target and stop loss level. Stoploss level

Entry IQ 指标是一款精密的技术分析工具,旨在协助交易者精准识别多头和空头头寸的高概率入场点。这一先进的交易实用程序结合了动态价格箱、均衡区和专有的趋势检测算法,全面分析市场趋势和价格行为。通过综合这些要素,该指标提供了一个强大的框架,用于实时理解市场情绪并识别关键的转折点。
Entry IQ 指标的核心在于能够评估用户定义的回溯期内的价格行为,通过分析K线表现来有效衡量市场信心。该系统利用自动适应波动市场条件的动态价格箱。此功能根据特定范围内的最高价和最低价突显均衡区,使交易者能够更清晰地区分潜在的市场反转和趋势延续情景。
为了确保精确性和可靠性,该工具集成了趋势线过滤和严格的不重绘趋势线。这一功能为交易者提供了稳定且清晰的视觉信号,这些信号在K线收盘后不会消失或移动,解决了劣质技术工具中常见的问题。此外,Entry IQ 指标设计灵活,能够无缝适应各种经纪商的价格位数格式,并允许完全自定义箭头信号以匹配个人交易策略。
最终,Entry IQ 指标通过结构化的市场分析和自适应的趋势洞察赋予交易者力量。通过过滤市场噪音并专注于重大的价格变动,它为用户配备了在复杂市场条件下
FREE

THE PREDICTOR: Advanced Machine Learning & ICT Powerhouse Transform your trading from guesswork to data-driven precision. The Predictor is not just another indicator; it is a sophisticated market analysis engine that combines Pattern Recognition AI with the institutional power of ICT (Inner Circle Trader) strategies. Designed for professional traders who demand high-accuracy signals for Forex, Boom/Crash, and Volatility Indices. Why Choose "The Predictor"? Unlike lagging indicators, T
MetaTrader 市场 - 在您的交易程序端可以直接使用为交易者提供的自动交易和技术指标。
MQL5.community 支付系统 提供给MQL5.com 网站所有已注册用户用于MetaTrade服务方面的事务。您可以使用WebMoney,PayPal 或银行卡进行存取款。
您错过了交易机会:
- 免费交易应用程序
- 8,000+信号可供复制
- 探索金融市场的经济新闻
注册
登录