YouTube'dan Mağaza ile ilgili eğitici videoları izleyin
Bir alım-satım robotu veya gösterge nasıl satın alınır?
Uzman Danışmanınızı
sanal sunucuda çalıştırın
sanal sunucuda çalıştırın
Satın almadan önce göstergeyi/alım-satım robotunu test edin
Mağazada kazanç sağlamak ister misiniz?
Satış için bir ürün nasıl sunulur?
MetaTrader 5 için teknik göstergeler - 11

This indicator is an MQL5 port inspired by the "Cyclic Smoothed RSI" concept originally developed by Dr_Roboto and popularized by LazyBear and LuxAlgo on TradingView. The Cyclic Smoothed RSI (cRSI) is an oscillator designed to address the two main limitations of the standard RSI: lag and fixed overbought/oversold levels. By using digital signal processing (DSP) based on market cycles, the cRSI reduces noise without sacrificing responsiveness. It features Adaptive Bands that expand and contract
FREE
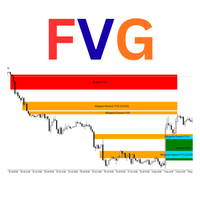
Luta FVG Pro – Professional Fair Value Gap (FVG) Indicator
Detects Institutional Fair Value Gaps on H4 timeframe with the same way used by ICT/SMC traders.
Features: • Real-time Bullish & Bearish FVG detection • Automatic Mitigation tracking • Inverted FVG signals (very powerful reversal setups) • "GOOD" FVG marking (gaps ≥ 2× minimum size – higher probability) • Clean rectangles with smart labels (Bullish FVG / Mitigated / Inverted) • Overlap filter option • Maximum 50 active zones (no chart
FREE

Price Direction Indicator Price Direction Indicator, tek bir temel soruya nesnel bir yanıt vermek amacıyla geliştirilmiştir:
Piyasa, mevcut fiyat yapısı içinde şu anda hangi konumdadır - düşük değerli, nötr veya aşırı değerli mi? PDI; alım-satım sinyalleri, oklar veya grafik üzerinde öznel işaretler üretmez. Bunun yerine, mevcut piyasa davranışını 0 ile 10 arasında net bir şekilde ölçeklendirilmiş yön değerlendirmesine dönüştürür.
Ortaya çıkan sonuç, duygulardan ve kısa vadeli gürültüden bağımsı

Haven VWAP Oscillator - Profesyonel Geri Dönüş Bulucu Karşınızda Haven VWAP Oscillator – Hacim gücünü (VWAP) ve istatistiksel hassasiyeti (Z-Score) birleştiren gelişmiş bir analiz aracıdır. Temel görevi, akıllı trend mantığı kullanarak hatalı sinyalleri filtrelemek ve matematiksel olarak doğrulanmış piyasa dönüş noktalarını bulmaktır. Diğer ürünlerime göz atın -> BURADAN (TIKLAYIN) . Kalabalığa karşı işlem yapmak hassasiyet gerektirir. Çoğu osilatör çok erken sinyal verir. Haven VWAP Oscil
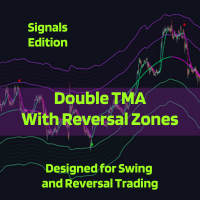
The Double TMA with Bands – Signals Edition v4.0 technical analysis tool is built for MetaTrader 5 combining two Triangular Moving Averages (TMA) with ATR-based reversal zones to help identify trend direction and potential turning points. It includes optional indicator visualization, multiple signal types, and flexible alerting to ensure you never miss the trade!
Notes from the Developer:
Bug corrections and implementation of requested features will be cataloged and applied in the next update,

Volume Break Oscillator, fiyat hareketini osilatör biçiminde hacim trendleriyle eşleştiren bir göstergedir.
Stratejilerime hacim analizini entegre etmek istedim ancak OBV, Money Flow Index, A/D ve ayrıca Volume Weighted Macd ve diğerleri gibi çoğu hacim göstergesinden her zaman hayal kırıklığına uğradım. Bu nedenle bu göstergeyi kendim için yazdım, ne kadar kullanışlı olduğundan memnunum ve bu nedenle piyasada yayınlamaya karar verdim.
Başlıca özellikleri:
Fiyatın hacimlerdeki bir artış (kır
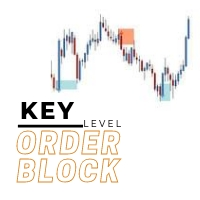
The key level order block indicator automatically draws order-blocks for you on the chart. The indicator compliments any strategy and can also be used as an independent tool. It can work with smart money concepts, harmonic patterns, supply and demand, flag patterns, Quasimodo strategy and many more.
Advantages
The key level order block DOES NOT RE-PAINT, giving you confidence when a signal appears and also helps when looking back. The key level order block includes an on/off button on the c

Elliot Waves Analyzer calculates Elliot Waves to Help Identify Trend direction and Entry Levels. Mainly for Swing Trading Strategies. Usually one would open a Position in trend direction for Wave 3 or a Correction for Wave C . This Indicator draws Target Levels for the current and next wave. Most important Rules for Elliot Wave Analysis are verified by the Indicator. This free version is limited for Analyzing one Timperiod Waves. Waves are Shown only in PERIOD_H4 and above. Not Useful for Intr
FREE

A simple indicator that automatically highlights all FVGs (Fair Value Gaps) formed on the chart, as well as FVGs on history. It is possible to select colors for FVGs of different directions (long or short), select the time interval, select the color of middle point and you can also choose whether to delete filled FVGs or leave them on the chart (the option is beneficial for backtesting). The indicator can be very useful for those, who trade according to the concept of smart money, ICT, or simply
FREE
Gold Scalper Pro PSAR ADX Dashboard MT5 Gelişmiş sinyal algılama özelliklerine sahip profesyonel çok zaman dilimli işlem göstergesi. Genel Bakış Parabolic SAR V3 + ADX, Parabolic Stop and Reverse (PSAR)’ın trend izleme yeteneklerini, Ortalama Yön Endeksi (ADX)’in trend gücü ölçümüyle birleştiren gelişmiş bir teknik analiz göstergesidir. Bu geliştirilmiş sürüm, pariteye özel optimizasyon, çok dilli uyarı sistemi ve profesyonel traderlar için kapsamlı çok zaman dilimli bir kontrol paneli sunar. Te

Bu gösterge ile piyasaya dair güçlü içgörüler elde edin; Nelogica'nın Profit Visual Book'undan ilham alarak grafikte görsel bir emir defteri sunar. Alış hacimlerini (mavi) ve satış hacimlerini (kırmızı) temsil eden yatay çubuklar gösterir, büyük hacimler sarı ile vurgulanır, böylece yüksek likidite bölgeleri kolayca tespit edilir. Fiyat, emirlerin en yoğun olduğu bölgelere doğru hareket etme eğilimindedir, bu da destek ve direnç seviyelerini belirlemek için vazgeçilmez bir araçtır. Tamamen özell
FREE

Boom and Crash Buy and Sell Trend. Non-repaint. Can be used on all timeframes 1 minute for scalpers. 5 minute to monthly timeframe for swing trading. works on all boom and crash pairs Crash300, Crash500, Crash1000. Boom300, Boom500, Boom1000. Green histogram colour means the trend is up(bullish) Buy signal. Dark orange histogram colour means the trend is down(bearish) Sell signal.
The SyntheticaFX Pain & Gain Spike Indicator is a specialized tool designed to identify potential spike opportunities in the market, exclusively for traders focusing on Weltrade Pain and Gain pairs. This indicator is optimized to operate on the 1-minute (M1), 2-minute (M2), 3-minute (M3), and 5-minute (M5) timeframes and supports only the following pairs: PainX 1200, PainX 999, PainX 800, PainX 600, PainX 400, GainX 1200, GainX 999, GainX 800, GainX 600, and GainX 400. It will not display signal

The indicator displays the orders book, as well as increases its depth, remembering the location of orders that have gone beyond the current "window" view.
Indicator capability Display the levels of open positions. Simulation of placing/cancelling/editing pending orders directly in the displayed orders book.
Indicator features The orders book display works only on those trading symbols for which it is broadcast by the broker. To reset the information about the rows that were recorded in the Sm
FREE

Volume Profile Flex - POC, VAH and VAL with Price Level Display
Volume Profile Flex is a flexible and performance-optimized Volume Profile indicator designed to help traders identify important price levels based on traded volume rather than time.
The indicator provides a clear view of market acceptance areas, price rejection zones, and the most actively traded price levels directly on the chart. Main Features:
The indicator automatically calculates and displays key Volume Profile levels within
FREE

Smart Session Box Displays Asia, London, and New York trading sessions with automatic timezone adjustment and session overlap highlighting. Main Features Complete session analysis with no limitations. Key Features The indicator draws session boxes with high and low lines for each trading session. Session overlaps are highlighted with distinct colors to identify high liquidity periods. Breakout alerts notify when price crosses previous session levels. A control panel provides quick toggles for al
FREE

Perfect Day Scalper Pro
Your Daily 5-Point Routine for a 5-Figure Income.
Price: $150 USD (Stop Chasing, Start Cashing)
---
One Trade. One Target. One Victory Lap. Your Day is Done.
(Forget the 1000+ pip dreams that turn into 100+ pip losses. Real wealth is built on consistency, not complexity. What if your entire trading day was over in 15 minutes, with a single, high-probability trade that hands you a clean, professional profit? Welcome to the Perfect Day Scalper.)
---
What is The
FREE
TÜM ÜCRETSİZ ÜRÜNLERİMİ GÖRMEK İÇİN BURAYA TIKLAYIN
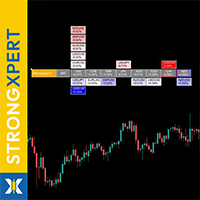
StrongXpert , küresel döviz piyasasında gerçek zamanlı para birimi gücünü hassas şekilde izlemek için geliştirilmiş bir araçtır. Bu araç, sermayenin gerçekten nereye aktığını - ve piyasadan nereye çıktığını göstermek amacıyla oluşturulmuştur. Gösterge, 8 ana para biriminin (USD, EUR, GBP, JPY, AUD, CAD, CHF, NZD) göreceli gücünü ölçer ve karmaşık fiyat hareketlerini basit, okunabilir bir görsel panele dönüştürür - hem de doğrudan grafikte. En
FREE
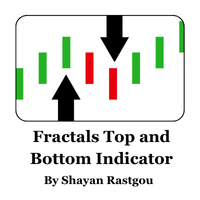
Discover the power of fractals to uncover significant market reversals! This custom Fractals Indicator for MetaTrader 5 is designed to help traders quickly and effectively spot potential swing highs and lows, providing visual cues that make trading decisions easier. Key Features: Clear Buy & Sell Signals: Green and red arrows highlight bullish and bearish fractals, helping you effortlessly identify significant price pivots. Customizable Analysis Depth: Choose the number of bars to evaluate for f
FREE
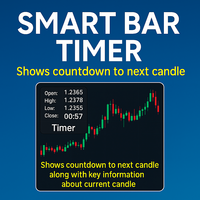
The Enhanced Bar Timer is a versatile and customizable indicator for MetaTrader 5 (MT5) that provides real-time information about the current candle, including a countdown timer for the next bar, candle details, volume, and spread. Displayed in the user-specified corner of the chart window, this indicator offers a multi-line or single-line format, allowing traders to monitor critical market data at a glance, enhancing decision-making and trading efficiency. Key Features Real-Time Bar Timer : Dis
FREE

ADVANCED MARKET ANALYSIS INDICATOR Overview of the Indicator
This is not a simple indicator — it’s a multi-analysis predictive system. It combines:
Volume Profile (POC, VAH, VAL)
Fibonacci Extensions
Pivot Levels (Daily, Weekly, 4H)
Trend Determination (MA-based)
Smart Money Concepts & Pattern Detection (basic placeholders for expansion)
Prediction Engine (projects price forward for 1 hour)
It gives you:
Target Price Line (projection)
Stop Loss Line (usually at Volume POC)
FREE

This is RSI with alarm and push notification -is a indicator based on the popular Relative Strength Index (RSI) indicator with Moving Average and you can use it in Forex, Crypto, Traditional, Indices, Commodities. You can change colors to see how it fits you. Back test it, and find what works best for you. This product is an oscillator with dynamic overbought and oversold levels, while in the standard RSI, these levels are static and do not change.
This allows RSI with alarm and push notifica
FREE

Bu göstergenin amacı, fiyat grafiğinde fraktalleri görüntüleyerek, trader'ların önemli yerel zirveleri ve dipleri tanımlamalarına yardımcı olmaktır. Fraktaller, klasik tanıma uyan özel noktalardır: Yerel bir zirve, merkezi mumun her iki taraftaki iki mumu geçtiği durumlarda oluşur ve yerel bir dip, merkezi mumun her iki taraftaki iki mumu geçtiği durumlarda oluşur. Diğer Ürünler -> BURADA Ana Özellikler ve Avantajlar : Esnek Görüntüleme — Göstergeler, üst ve alt fraktalleri farklı sembollerle g
FREE

ADR Ters Çevirme Göstergesi, normal ortalama günlük aralığına göre fiyatın şu anda nerede işlem gördüğünü bir bakışta size gösterir. Fiyat, ortalama aralığı ve seçtiğiniz seviyenin üzerindeki seviyeleri aştığında, açılır pencere, e-posta veya push yoluyla anında uyarılar alacaksınız, böylece hızlı bir şekilde geri çekilmelere ve geri dönüşlere atlayabilirsiniz. Gösterge, grafikte ortalama günlük aralık uç noktalarında yatay çizgiler ve ayrıca fiyatları aşan matematiksel olasılıkları olan seviye
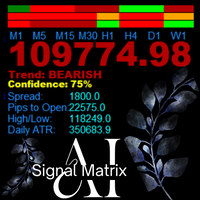
AanIsnaini Signal Matrix MT5 Multi-Timeframe Confidence Signal Dashboard The Free Version of AanIsnaini Signal Matrix MT5 Pro AanIsnaini Signal Matrix MT5 is a powerful all-in-one indicator that analyzes market direction and confidence levels across multiple timeframes — allowing traders to see the overall bias of the market at a single glance. It combines signals from Price Action , Support–Resistance , and several proven technical tools (MACD, ADX, RSI, MA slope, ATR, and Volume Ratio), then
FREE

The indicator displays volume profiles based on the nesting principle. Profiles periods are pre-set so that each subsequent profile has a length twice as long as the length of the previous profile. In addition to profiles, the indicator displays volume clusters sorted by color, depending on the volume they contain.
Indicator operation features The indicator works on typical timeframes from M5 to MN, but for calculations uses historical data from smaller timeframes: M1 - for timeframes from M5
FREE

Time Session OPEN-HIGH-LOW-CLOSE This Indicator Will Draw Lines Of OHLC Levels Of Time Session Defined By User. It Will Plot Floating Lines On Current Day Chart. Time Session Can Of Current Day Or Previous Day. You Can Plot Multiple Session Lines By Giving Unique ID To Each Session. It Can Even Show Historical Levels Of Time Session Selected By User On Chart To Do Backdating Test. You Can Write Text To Describe The Lines.
FREE

Closing Price Reversal is a very well known and traded candlestick pattern. This little indicator paints with specific (user-selected) colors the Closing Price Reveral Up and Down patterns, as well as the Inside Bars (as a bonus). Higher timeframes are more effective as with all other candlesticks patterns. Do NOT trade solely on this indicator. Search the web for "Closing Price Reversal" to learn about the several approaches that can be used with this pattern. One of them is combining short/me
FREE

KT Momentum Arrows göstergesi, belirli bir yönde meydana gelen bant sapması ve ortaya çıkan volatiliteye dayalı olarak hesaplanan ani kırılmalara dayanır. Fiyat üst banda kapanış yaparsa alış sinyali, alt banda kapanış yaparsa satış sinyali üretilir. Tek bir katsayı (Magnitude Coefficient), bant sapması ve volatilite hesaplamasını aynı anda etkiler. Bu değer, kullanılan enstrümana ve zaman dilimine göre dikkatlice seçilmelidir.
Temel Özellikler
Repaint yok! Momentum odaklı işlem yapanlar için

MT5 için Crypto_Forex Göstergesi "Trend Düzeltme Histogramı".
- Trend Düzeltme Histogramı 2 renkte olabilir: düşüş eğilimi için kırmızı ve yükseliş eğilimi için mavi. - Aynı renkteki 7 ardışık histogram sütunu yeni bir eğilimin başlangıcı anlamına gelir. - Ana amaç olan kayıpları en aza indirmek ve karı en üst düzeye çıkarmak için tasarlanmış Trend Düzeltme Histogramı göstergesi. - Göstergenin duyarlılığından sorumlu olan "Periyot" parametresine sahiptir. - Dahili Mobil ve PC uyarıları. - Tren
Level Box Tool is a powerful and user-friendly custom indicator designed for traders who utilize technical analysis tools like rectangles and trend lines to identify key support, resistance, and price zones. This tool simplifies and speeds up the process of marking chart levels, offering both visual clarity and precision with its fully customizable panel, and now includes price-cross alerts — so you’ll never miss a key level again. MT4 Version - https://www.mql5.com/en/market/product/136009/ Jo
FREE

Developed by Chuck LeBeau, the Chandelier Exit indicator uses the highest high / lowest low -/+ a multiple of the ATR value to draw trailing stop lines (orange under buys, magenta over sells) that advance with the trend until the trend changes direction.The value of this trailing stop is that it rapidly moves upward in response to the market action. LeBeau chose the chandelier name because "just as a chandelier hangs down from the ceiling of a room, the chandelier exit hangs down from the high
FREE

The indicator that shows the countdown to the change of candles is equipped with an alert when the bar changes (the alert is not active if installed on the M1 time frame). Displays seconds if installed in time frame M1, displays minutes and seconds if installed in time frame above M1, and displays hours and minutes if installed in time frame h1 and above. The time displayed is calculated based on the running time.
FREE

Neural-Link Engine: High-Performance Pattern Projection for MetaTrader 5 The Neural-Link Engine is an advanced technical indicator designed for the MetaTrader 5 platform that utilizes historical pattern recognition to project future price action. Unlike traditional lagging indicators, this system employs a K-Nearest Neighbors (k-NN) inspired approach to identify mathematical similarities in market structure and visualize a potential path forward directly on the chart. If you are looking to pass
FREE
This Demand & Supply Zone Indicator with Volume Filtering is a technical analysis tool for MetaTrader that identifies key price zones where buying (demand) or selling (supply) pressure is concentrated. It uses fractals, volume analysis, and price action to detect and highlight these zones on the chart. Key Features: Zone Detection Based on Fractals Identifies demand (support) and supply (resistance) zones using fractal patterns (local highs/lows). Zones are formed from open prices ar
FREE

SMART SD ARROW INDICATOR
Trade Smarter, Not Harder: The Smart SD Arrow Indicator That Paints Clear Buy & Sell Signals Right On Your Chart!
Finally, an All-in-One Supply & Demand Tool That Doesn’t Just Draw Zones—It Gives You Precise, Actionable Entry Arrows. Stop Analyzing, Start Executing.
Dear Trader,
Let's be honest. You've tried indicators that draw complicated zones all over your chart. They look smart, but when it's time to pull the trigger, you're left with the same old question:
FREE

本指标 基于 Zigzag 基础上... 增加了: 1.增加了箭头指示,使图表更鲜明 2.增加了价格显示,使大家更清楚的看清价格. 3.增加了报警等设置,可以支持邮件发送 原指标特性: 1.基本的波段指标构型. 2.最近的2个ZIGZAG点不具有稳定性,随着行情而改变,(就是网友所说的未来函数) 3.原指标适合分析历史拐点,波段特性,对于价格波动有一定的指导性.
Zigzag的使用方法一 丈量一段行情的起点和终点 (1)用ZigZag标注的折点作为起点和终点之后,行情的走势方向就被确立了(空头趋势); (2)根据道氏理论的逻辑,行情会按照波峰浪谷的锯齿形运行,行情确立之后会走回撤行情,回撤的过程中ZigZag会再次形成折点,就是回撤点; (3)在回撤点选择机会进场,等待行情再次启动,止损可以放到回撤的高点。 一套交易系统基本的框架就建立起来了。 Zigzag的使用方法二 作为画趋势线的连接点 趋势线是很常见的技术指标,在技术分析中被广泛地使用。 但一直以来趋势线在实战中都存在一个BUG,那就是难以保证划线的一致性。 在图表上有很多的高低点,到底该连接哪一个呢?不同的书上画趋势线的方法
FREE

Presenting one-of-a-kind Gann Indicator for XAUUSD
IQ Gold Gann Levels is a non-repainting, precision tool designed exclusively for XAUUSD/Gold intraday trading. It uses W.D. Gann’s square root method to plot real-time support and resistance levels, helping traders spot high-probability entries with confidence and clarity. William Delbert Gann (W.D. Gann) was an exceptional market analyst whose trading technique was based on a complex blend of mathematics, geometry, astrology, and ancient calcul
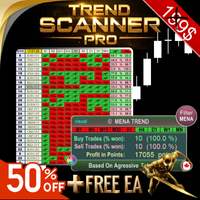
Trend Scanner PRO First of all, it’s worth emphasizing that this trading system is 100% Non-Repainting, Non-Redrawing, and Non-Lagging ,
which makes it ideal for both manual and algorithmic trading setups. Online course, user manual, and downloadable presets included. The Trend Scanner Dashboard is a professional multi pair scanner that analyzes multiple symbols and timeframes at once, giving you an instant market scanner view of the real trend direction. Instead of switching charts endl

This is a conventional volume indicator, which displays the ticks or real volume (if available from your broker). But it has others features like: 5 color schemes: single, when crossing with moving average, when crossing a specific level, when having different volume between bars and when candle change color. Being hable to have a customizable moving average. Being hable to have a value indicator line. Many thanks to Diego Silvestrin for the ideas to version 1.1 and Konstantin Demidov for
FREE
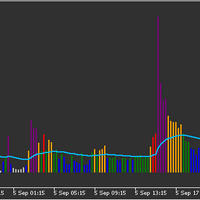
Volume indicator judging level of volume per bar accordingly to Volume Spread Analysis rules. It allows either to set static volume levels or dynamic ones based on ratio comparable to Moving Average. Bars are coloured based on ratio or static levels, visually presenting level of Volume (low, average, high, ultra high). Release Notes - Fixed and optimised calculations of Session Average Volume
- added predefined settings for time to calculate Session Average for EU and US markets
FREE
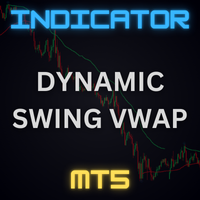
Dynamic Swing Anchored VWAP is a precision price–volume tool designed to stay relevant to live market conditions. Instead of a static VWAP that drifts further away as sessions progress, this indicator anchors VWAP to fresh swing highs and lows and adapts its responsiveness as volatility changes. The result is a fair-value path that follows price more closely, making pullbacks, retests, and mean-reversion opportunities easier to identify and trade. CORE FEATURES
Swing Anchoring Automatically d

Institutional Liquidity Sweep & Stop Hunt Detector The FAKEOUT MATRIX PRO is a professional-grade analytical tool designed to identify the exact moments when institutional players "trap" retail traders. By monitoring session extremes and detecting high-probability Liquidity Sweeps, this indicator provides the technical edge needed to trade reversals with precision. Works really great for XAUUSD (Gold) Instrument If you are looking for a profitable gold EA check this out - https://www.mql5.com/
FREE

Gelişmiş Ekonomik Takvim Göstergesi Bu gösterge, seçilen döviz çifti veya enstrüman için tüm yaklaşan ekonomik olayları doğrudan grafikte gösterir. Yüksek volatilite dönemlerini önceden tahmin etmenizi sağlar ve işlem stratejilerinizi daha hassas şekilde planlamanıza yardımcı olur. Başlıca Özellikler Gelecek olayların 5 gün öncesine kadar görüntülenmesi (özelleştirilebilir). Haber etkisine göre filtreleme (yüksek, orta, düşük). Hızlı tanımlama için dikey olay çizgileri ve numaralı işaretler göst
FREE

MT5 için Chart Symbol Changer , panelindeki bir sembol düğmesini tıklatarak ekli mevcut grafik sembolünü değiştirme seçeneği sunan bir gösterge/yardımcı programdır. MT5 için Grafik Sembol Değiştirici , gözünüz üzerinde olsun ve en çok alım satım yapmak istediğiniz çiftleri ekleyerek 32 sembol düğmesini kişisel tercihinize göre yapılandırma seçeneği sunar. Bu şekilde hiçbir fırsatı kaçırmazsınız çünkü sadece birkaç tıklamayla grafiğinizdeki piyasayı daha hızlı görebilirsiniz.
MT5 Kurulum/Ku
FREE

The Anchored VWAP Indicator for MetaTrader 5 gives you full control over where your VWAP starts. Instead of being locked to session opens or fixed times,
you simply drag the anchor point on the chart , and the VWAP instantly recalculates from that exact bar.
This makes it perfect for analyzing:
• Institutional entry zones
• Breakout origins
• Swing highs/lows
• News reaction points
• Trend continuations Key Features Drag & Drop Anchor Point : Move the starting point directly on the chart. The
FREE

The Weis Waves RSJ Indicator sums up volumes in each wave. This is how we receive a bar chart of cumulative volumes of alternating waves. Namely the cumulative volume makes the Weis wave charts unique. It allows comparing the relation of the wave sequence characteristics, such as correspondence of the applied force (expressed in the volume) and received result (the price progress).
If you still have questions, please contact me by direct message: https://www.mql5.com/en/users/robsjunqueira/
FREE
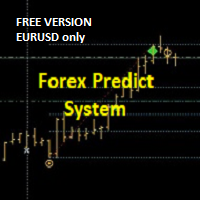
+++++++++++++++++++++++++++++
+++ FREE VERSION - EURUSD ONLY
+++++++++++++++++++++++++++++
Please add PREFIX and/or SUFFIX via settings if your Broker Chart Symbol is different (e.g. suffix = .r).
+++
This is forecast system.
On the moment of the breakout/forecast: the indicator draws retrace zone (yellow) and three targets. The levels act as support and resistance. It can be used on all pairs/indices/timeframes/periods. For the higher timeframes (H4, H1, M30) it's better to engage at Optima
FREE

Arz / talep bölgeleri: Fiyatın geçmişte birçok kez yaklaştığı gözlemlenebilir alanlar. Çok fonksiyonlu araç: 66+ özellik, bu gösterge dahil | Sorularınız için iletişim | MT4 versiyonu Gösterge, fiyatın tekrar tersine dönebileceği potansiyel bölgeleri gösterir. Genellikle, fiyat bir seviyeden ne kadar çok reddedilirse, o seviye o kadar önemlidir. Giriş ayarlarında ayarlayabilecekleriniz: Zayıf bölgeleri etkinleştirme veya devre dışı bırakma; Bölge açıklamalarını gösterme veya gizleme;

YOU CAN NOW DOWNLOAD FREE VERSIONS OF OUR PAID INDICATORS . IT'S OUR WAY OF GIVING BACK TO THE COMMUNITY ! >>> GO HERE TO DOWNLOAD
More About Advanced Currency Meter Every good forex system has the following basic components: Ability to recognize the trend direction. Ability to identify the strength of the trend and answer the basic question Is the market trending or is it in a range? Ability to identify safe entry points that will give a perfect risk to reward (RR) ratio on every position.
FREE

WickSniper Pro – Precision Reversal Indicator for Smart Traders ===============================================================
WickSniper Pro is a powerful **non-repainting** price action indicator that detects **inside bar breakout reversals** with sniper-like accuracy. Whether you're a scalper, swing trader, or day trader, WickSniper Pro helps you catch high-probability turning points in the market using clean, intuitive signals.
Key Features ------------ - Non-Repainting – Once a signa
FREE

Daily Zone Breaker - MT5 Indicator Overview Daily Zone Breaker is an advanced multi-kernel regression indicator that identifies critical price zones and breakthrough moments with surgical precision. Using sophisticated kernel smoothing algorithms, it filters out market noise to reveal true directional momentum and key trading zones where price is most likely to break through resistance or support levels. What It Does Core Functionality Daily Zone Breaker analyzes price action through 17 differ

XAU POWER : The Gold Velocity Matrix XAU Power is an analytical suite specifically designed for Gold (XAUUSD) traders. This tool moves beyond traditional lagging indicators by utilizing a proprietary Velocity Decoupling Algorithm to measure the hidden energy balance between Gold and the US Dollar. Engineered for precision, XAU Power PRO synchronizes market momentum with a high-level Structural Trend Engine, giving you a definitive edge in identifying high-probability entry zones while avoiding
FREE

* Tüm önemli döviz çiftleri için verilerin doğruluğu nedeniyle, — canlı grafiklerin kullanılması önerilir.
UEX Pure USD Euro Endeksi Nedir ? İngilizce Açıklama: https://www.mql5.com/en/market/product/152936
Pure USD & Euro Endeksi ile döviz piyasasının gerçek nabzını keşfedin. — Dünyanın en güçlü iki para birimi arasındaki gizli güç ve zayıflıkları gerçekten ortaya çıkaran yenilikçi bir gösterge.
EURUSD gibi tek bir pariteye güvenmek yerine, bu araç ABD Doları ve Euro'nun birden fazla ana pa

Renko is a timeless chart, that is, it does not take into account the time period, but the price change, which makes the price change on the chart clearer.
Hyper Renko is the indicator that provides this.
To configure, you only have one parameter, the size of the candle in the tick * you want to use.
* tick: is the smallest possible variation of an asset.
Thank you for choosing a Hyper Trader indicator.
Wikipedia: A renko chart indicates minimal variation in the value of a variable - for e
FREE

The Hybrid Stochastic indicator is a Stochastic RSI described by the famous Tushar Chande and Stanley Kroll in their book called " The New Technical Trader" . The main goal of this indicator is to generate more Overbought and Oversold signals than the traditional Relative Strength indicator (RSI). Combining these 2 indicators expands the range of the overbought and oversold territory. The idea behind it is to use the Stochastic formula over RSI values. If you want to know more about its internal
FREE
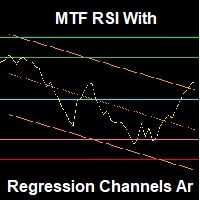
Note: The inputs of this indicator are in the Arabic language An advanced RSI indicator that displays dynamic linear regression channels in both the indicator window and the price chart, with predefined horizontal levels to detect overbought and oversold zones. Main Features (Summary): Synchronized linear regression channels on both price and RSI Multitimeframe support Smart and ready-to-use horizontal levels Professional design with optimized performance Feedback & Support We value your ex
FREE

The ultimate M5 indicator for Boom 300 indx, providing clear, filtered buy/sell signals to eliminate market noise and enhance your trading precision. Benefit-Focused spike alert on time
spike signals
spike trade sl 5 candels
trend following dashboard to know trend strength and direction
use it in any market conditions and it will help you to stay profitable and consistent it send mt5 and mobile notification alert right on time all signals are non repaint and no lag

The trend is your friend!
Look at the color of the indicator and trade on that direction. It does not repaint. After each candle is closed, that's the color of the trend. You can focus on shorter faster trends or major trends, just test what's most suitable for the symbol and timeframe you trade. Simply change the "Length" parameter and the indicator will automatically adapt. You can also change the color, thickness and style of the lines. Download and give it a try! There are big movements w

Özellikler
Fiyata göre işlem hacmini kontrol etmek için gösterge. Çoğunlukla EURUSD için çalışır, diğer para çiftlerinde işe yaramayabilir veya hesaplama uzun zaman alabilir. Düzgün bir kullanım için "Grafiğin sağ kenarından bitiş sınırını kaydır" seçeneğini açın (ekrandaki resimde gösterildiği gibi). Yeni bir çubuk verisi göründüğünde veriler sıfırlanır.
Değişkenler COlOR: Gösterge rengini ayarlama WIDTH: Gösterge genişliğini ayarlama PERIOD: Verileri hesaplamak için zaman periyodunu belirl
FREE

Overview The TTM Squeeze indicator helps identify low volatility periods (squeeze) that often precede price breakouts. It uses Bollinger Bands (BB) and Keltner Channels (KC) to determine when the market is "coiling" and ready to move. Configuration Guide Volatility Settings The indicator uses Bollinger Bands to measure market volatility. When BBs are inside Keltner Channels, a squeeze is detected. The squeeze suggests the market is consolidating and may soon break out. True Range Option Optional
FREE

Spike Catch Pro 22:03 release updates Advanced engine for searching trade entries in all Boom and Crash pairs (300,500 and 1000)
Programmed strategies improvements Mx_Spikes (to combine Mxd,Mxc and Mxe), Tx_Spikes, RegularSpikes, Litho_System, Dx_System, Md_System, MaCross, Omx_Entry(OP), Atx1_Spikes(OP), Oxc_Retracement (AT),M_PullBack(AT) we have added an arrow on strategy identification, this will help also in the visual manual backtesting of the included strategies and see ho
FREE

Gösterge, yükseliş 1000'deki en iyi satın alma girişlerini analiz etmek için birden fazla zaman dilimi kullanır. Yalnızca yükseliş yükselişlerinde ticarete yardımcı olmak için özel olarak tasarlanmıştır. göstergenin iki oku vardır; kırmızı ve mavi olanlar. Kırmızı okun oluşumu, alım giriş sinyali olan mavi oka hazır olmanız gerektiğini gösterir. gösterge çıkış noktaları sunmaz. her zaman 3 pip toplayın, yani 10230.200'de bir işleme girdiyseniz 1 pip'te SL ile 10260.200'den, yani 10220.200'den ç
FREE

The VWAP Session Bands indicator is a powerful tool designed for Meta Trader 5. This indicator calculates the Volume Weighted Average Price (VWAP) and its standard deviation bands within customizable daily sessions, offering traders a clear view of price trends and volatility. Unlike traditional VWAP indicators, it ensures smooth, continuous lines across session boundaries by using the previous candle's values for the current (incomplete) bar. Ideal for scalping or day trading on instruments lik
FREE

One of the most powerful and important ICT concepts is the Power of 3. It explains the IPDA (Interbank Price Delivery Algorithm) phases. PO3 simply means there are 3 things that the market maker's algorithm do with price:
Accumulation, Manipulation and Distribution
ICT tells us how its important to identify the weekly candle expansion and then try to enter above or below the daily open, in the direction of the weekly expansion.
This handy indicator here helps you keep track of the weekly and

Bu gösterge panosu, piyasa yapısını tersine çevirme göstergesiyle kullanım için bir uyarı aracıdır. Birincil amacı, belirli zaman dilimlerinde geri dönüş fırsatları ve ayrıca göstergenin yaptığı gibi uyarıların yeniden test edilmesi (onay) konusunda sizi uyarmaktır. Pano, kendi başına bir grafik üzerinde oturacak ve seçtiğiniz çiftler ve zaman dilimlerinde size uyarılar göndermek için arka planda çalışacak şekilde tasarlanmıştır. Piyasa tersine çevrilme göstergesinin tek bir MT4'te birden fazla
Haven RSI Candlestick , Göreceli Güç Endeksi'nin (RSI) geleneksel çizgi grafiğini sezgisel bir mum grafiği formatına dönüştüren yenilikçi bir teknik göstergedir.
Bu araç, teknik analize dayanan ve piyasa momentumunu ve potansiyel geri dönüş noktalarını daha hızlı ve daha derinlemesine yorumlamayı amaçlayan yatırımcılar için tasarlanmıştır. Diğer ürünler -> BURADA . Temel Özellikler: RSI'ın Mum Olarak Görselleştirilmesi: Temel özellik budur. Artık momentum değişikliği sinyallerini daha erken tesp
FREE

Heiken Ashi MT5 Göstergesi Heiken Ashi MT5 Göstergesi, standart fiyat verilerini daha yumuşak ve trend odaklı mumlara dönüştürerek, piyasa trendlerini ve potansiyel dönüş noktalarını daha kolay belirlemenizi sağlayan güçlü bir araçtır. Ana Özellikler: Net trend tanımlama: Yükseliş ve düşüş trendlerini farklı mum renkleriyle görsel olarak ayırt eder. Gürültü azaltma: Fiyat dalgalanmalarını filtreleyerek piyasanın ana hareketlerine daha net odaklanmanızı sağlar. Erken trend tespiti: Standart graf
FREE

Liquidity Swings SMC Zones Liquidity Swings SMC Zones is a professional indicator for MetaTrader 5 that automatically detects, displays, and updates liquidity-based swing high and swing low zones directly on your chart. This tool is designed for traders who use Smart Money Concepts (SMC), supply and demand, or support and resistance trading methods. Features Automatic Zone Detection:
Identifies significant swing highs and swing lows based on customizable pivot settings. Clear Visual Zones:
Hi
FREE

Session Finder – Track Forex Market Sessions with Precision
Stay ahead of the market with Session Finder , a sleek HUB style design for MetaTrader 5. It provides real-time visibility into the world’s major trading sessions—Sydney, Tokyo, London, and New York—so you always know which markets are open, closed, or about to change. Key Features: Live Session Status: See whether a session is currently open or closed at a glance. Countdown Timers: Track exactly how long until a session opens or close
MetaTrader mağazası - yatırımcılar için alım-satım robotları ve teknik göstergeler doğrudan işlem terminalinde mevcuttur.
MQL5.community ödeme sistemi, MetaTrader hizmetlerindeki işlemler için MQL5.com sitesinin tüm kayıtlı kullanıcıları tarafından kullanılabilir. WebMoney, PayPal veya banka kartı kullanarak para yatırabilir ve çekebilirsiniz.
Alım-satım fırsatlarını kaçırıyorsunuz:
- Ücretsiz alım-satım uygulamaları
- İşlem kopyalama için 8.000'den fazla sinyal
- Finansal piyasaları keşfetmek için ekonomik haberler
Kayıt
Giriş yap
Gizlilik ve Veri Koruma Politikasını ve MQL5.com Kullanım Şartlarını kabul edersiniz
Hesabınız yoksa, lütfen kaydolun
MQL5.com web sitesine giriş yapmak için çerezlerin kullanımına izin vermelisiniz.
Lütfen tarayıcınızda gerekli ayarı etkinleştirin, aksi takdirde giriş yapamazsınız.