Conheça o Mercado MQL5 no YouTube, assista aos vídeos tutoriais
Como comprar um robô de negociação ou indicador?
Execute seu EA na
hospedagem virtual
hospedagem virtual
Teste indicadores/robôs de negociação antes de comprá-los
Quer ganhar dinheiro no Mercado?
Como apresentar um produto para o consumidor final?
Indicadores Técnicos para MetaTrader 5 - 11

Um padrão de gráfico de triângulo simétrico representa um período de contração e consolidação antes que o preço seja forçado a romper para cima ou para baixo. Uma quebra da linha de tendência inferior marca o início de uma nova tendência de baixa, enquanto uma quebra da linha de tendência superior indica o início de uma nova tendência de alta.
Versão MT4 disponível aqui: https://www.mql5.com/en/market/product/68709/
Este indicador identifica esses padrões e avisa quando os 4 pontos-chave se f
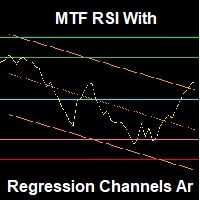
Note: The inputs of this indicator are in the Arabic language An advanced RSI indicator that displays dynamic linear regression channels in both the indicator window and the price chart, with predefined horizontal levels to detect overbought and oversold zones. Main Features (Summary): Synchronized linear regression channels on both price and RSI Multitimeframe support Smart and ready-to-use horizontal levels Professional design with optimized performance Feedback & Support We value your ex
FREE

OMEGA ONE SPIKE DETECTOR: Catch Every Explosive Move /Spikes with Surgical Precision
"I Used To Watch Spikes Fly By - Now I Catch Them Consistently Using Institutional Order Levels"
WATCHING 500-POINT SPIKE and not profiting? ENTERING TOO LATE after the big move already happened? GETTING STOPPED OUT right before the explosion?
What If You Could See Spikes BEFORE They Happen - And Know Exactly Where to Enter?
Introducing Omega One Spike Detector - The Only Tool That Combines Real-T

CandlePatternProUltimate Indicator for MetaTrader 5 Overview The CandlePatternProUltimate indicator is an advanced tool for detecting Japanese candlestick patterns on charts in the MetaTrader 5 platform. It features an attractive artistic interface and detects 150+ different patterns with intelligent AI-based analysis Artistic Design Customizable Colors : Fully customizable artistic color palette Visual Effects : Glows and artistic effects to make patterns more visible Black Backgrou
FREE
Cumulative Delta Volume Indicator for MT5 (CDV Indicator for MT5) Volume-Based Market Sentiment and Trend Strength Indicator The Cumulative Delta Volume (CDV) indicator analyzes the balance between buying and selling volume to reveal the underlying market sentiment.
By accumulating the difference between upward and downward volume, it shows whether buyers or sellers are in control and helps traders confirm the strength or weakness of a trend. This tool provides both candle-based visualization an
Tape Hunter – Seu Radar de Esforço vs Resultado no MT5 O Tape Hunter é o indicador definitivo para traders que querem enxergar o verdadeiro jogo por trás dos preços no MetaTrader 5. Ele mostra de forma clara e intuitiva o volume de agressão de compra e venda, baseado no POC (Point of Control), dando a você a capacidade de visualizar o esforço do mercado e o resultado real em cada candle. ️ Por que isso importa?
Nem todo volume gera movimento! O Tape Hunter destaca se o esforço (volume a

INDICATOR: GEN Zenith Developer: gedeegi General Description GEN Zenith is a technical indicator designed to automatically identify price reversal patterns (Zenith) based on pivot price detection and delta volume movement. This indicator looks for points where the price forms a swing high or swing low, then detects a breakout from that area to confirm a strong reversal signal. This indicator is highly suitable for reversal and breakout strategies, or as a signal confirmation tool in your tradin
FREE
Advanced Market Analysis Tool. Full Documentation: Download Free Professional Education Course: After purchasing, contact me to receive access to the complete CDV Professional Training Video Course. — It will help you master CDV , Aggressive Buyer & Seller dynamics , and Volume Microstructure concepts through a clear, step-by-step learning process. Overview The Professional CDV with Aggressive Score is a comprehensive volume analysis tool that combines visual Cumulative Delta Volume (CDV)

The indicator displays volume profiles based on the nesting principle. Profiles periods are pre-set so that each subsequent profile has a length twice as long as the length of the previous profile. In addition to profiles, the indicator displays volume clusters sorted by color, depending on the volume they contain.
Indicator operation features The indicator works on typical timeframes from M5 to MN, but for calculations uses historical data from smaller timeframes: M1 - for timeframes from M5
FREE

Necessary for traders: tools and indicators Waves automatically calculate indicators, channel trend trading Perfect trend-wave automatic calculation channel calculation , MT4 Perfect trend-wave automatic calculation channel calculation , MT5 Local Trading copying Easy And Fast Copy , MT4 Easy And Fast Copy , MT5 Local Trading copying For DEMO Easy And Fast Copy , MT4 DEMO Easy And Fast Copy , MT5 DEMO Bandas de Bollinger Avançadas:
1. O trilho Bollinger mudará de cor com a direção "
2. A expa
FREE
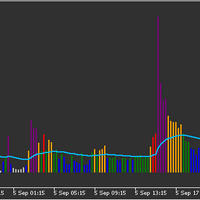
Volume indicator judging level of volume per bar accordingly to Volume Spread Analysis rules. It allows either to set static volume levels or dynamic ones based on ratio comparable to Moving Average. Bars are coloured based on ratio or static levels, visually presenting level of Volume (low, average, high, ultra high). Release Notes - Fixed and optimised calculations of Session Average Volume
- added predefined settings for time to calculate Session Average for EU and US markets
FREE

O indicador TickCounter conta os ticks para cima e para baixo em cada nova barra.
O cálculo começa a partir do momento em que o indicador é colocado no gráfico.
As barras do histograma representam: Barras amarelas - número total de ticks; Barras azuis - marcam PARA CIMA; Barras vermelhas - marca para BAIXO. Se a barra azul não estiver visível, há mais marcas para baixo e a barra vermelha é exibida em cima da azul (a camada vermelha está acima da azul). MT4 version: https://www.mql5.com/en/ma

Presenting one-of-a-kind Gann Indicator for XAUUSD
IQ Gold Gann Levels is a non-repainting, precision tool designed exclusively for XAUUSD/Gold intraday trading. It uses W.D. Gann’s square root method to plot real-time support and resistance levels, helping traders spot high-probability entries with confidence and clarity. William Delbert Gann (W.D. Gann) was an exceptional market analyst whose trading technique was based on a complex blend of mathematics, geometry, astrology, and ancient calcul

The Quantitative Qualitative Estimation (QQE) indicator is derived from Wilder’s famous Relative Strength Index (RSI). In essence, the QQE is a heavily smoothed RSI.
Modification of this version: ( converted from tradingview script by Mihkell00, original from Glaz, 100% identical output)
So there are Two QQEs. One that is shown on the chart as columns, and the other "hidden" in the background which also has a 50 MA bollinger band acting as a zero line.
When both of them agree - you get a b
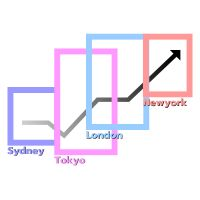
Time Zones and the Forex Market
The Forex market operates continuously 24 hours a day, facilitated by its global distribution across various time zones. The market is anchored by four primary trading centers: Sydney , Tokyo , London , and New York . Each trading center has specific opening and closing times according to its respective time zone. These differences significantly impact market volatility and trading opportunities during each session. Features Enable/Disable Date Display Enable/Di
FREE
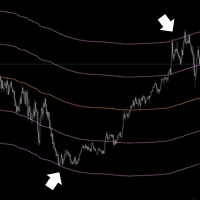
Elevate Your Trading with Advanced Anchored Volume Weighted Average Price Technology Unlock the true power of price action with our premium Anchored VWAP Indicator for MetaTrader 5 - the essential tool for precision entries, strategic exits, and high-probability trend continuation setups. Write me a DM for a 7 day free trial. Anchored VWAP Plus gives traders unprecedented control by allowing custom anchor points for Volume Weighted Average Price calculations on any chart. With support for 4 sim
FREE

Liquidity Swings SMC Zones Liquidity Swings SMC Zones is a professional indicator for MetaTrader 5 that automatically detects, displays, and updates liquidity-based swing high and swing low zones directly on your chart. This tool is designed for traders who use Smart Money Concepts (SMC), supply and demand, or support and resistance trading methods. Features Automatic Zone Detection:
Identifies significant swing highs and swing lows based on customizable pivot settings. Clear Visual Zones:
Hi
FREE

Full implementation of Directional Movement System for trading, originally developed by Welles Wilder, with modifications to improve profitability, to reduce the number of unfavorable signals, and with Stop Loss lines.
No re-paint
Features
Buy/sell signals displayed on the chart Stop levels visually indicated on the chart Profit-taking points presented in the indicator window Exit points for unfavorable positions presented in the indicator window Signal confirmation through high/low swing cros

Volume Profile Flex - POC, VAH and VAL with Price Level Display
Volume Profile Flex is a flexible and performance-optimized Volume Profile indicator designed to help traders identify important price levels based on traded volume rather than time.
The indicator provides a clear view of market acceptance areas, price rejection zones, and the most actively traded price levels directly on the chart. Main Features:
The indicator automatically calculates and displays key Volume Profile levels within
FREE
Level Box Tool is a powerful and user-friendly custom indicator designed for traders who utilize technical analysis tools like rectangles and trend lines to identify key support, resistance, and price zones. This tool simplifies and speeds up the process of marking chart levels, offering both visual clarity and precision with its fully customizable panel, and now includes price-cross alerts — so you’ll never miss a key level again. MT4 Version - https://www.mql5.com/en/market/product/136009/ Jo
FREE

本指标 基于 Zigzag 基础上... 增加了: 1.增加了箭头指示,使图表更鲜明 2.增加了价格显示,使大家更清楚的看清价格. 3.增加了报警等设置,可以支持邮件发送 原指标特性: 1.基本的波段指标构型. 2.最近的2个ZIGZAG点不具有稳定性,随着行情而改变,(就是网友所说的未来函数) 3.原指标适合分析历史拐点,波段特性,对于价格波动有一定的指导性.
Zigzag的使用方法一 丈量一段行情的起点和终点 (1)用ZigZag标注的折点作为起点和终点之后,行情的走势方向就被确立了(空头趋势); (2)根据道氏理论的逻辑,行情会按照波峰浪谷的锯齿形运行,行情确立之后会走回撤行情,回撤的过程中ZigZag会再次形成折点,就是回撤点; (3)在回撤点选择机会进场,等待行情再次启动,止损可以放到回撤的高点。 一套交易系统基本的框架就建立起来了。 Zigzag的使用方法二 作为画趋势线的连接点 趋势线是很常见的技术指标,在技术分析中被广泛地使用。 但一直以来趋势线在实战中都存在一个BUG,那就是难以保证划线的一致性。 在图表上有很多的高低点,到底该连接哪一个呢?不同的书上画趋势线的方法
FREE

TG MTF MA MT5 is designed to display a multi-timeframe moving average (MA) on any chart timeframe while allowing users to specify and view the MA values from a particular timeframe across all timeframes. This functionality enables users to focus on the moving average of a specific timeframe without switching charts. By isolating the moving average values of a specific timeframe across all timeframes, users can gain insights into the trend dynamics and potential trading opportunities without sw
FREE

IQ Trade Status – A Professional Trade Panel to track all your LIVE TRADES in a signle dashboard. IQ Trade Status is not just a trade panel; it is a professional dashboard designed for MetaTrader. It replaces the default Terminal window with a clean, structured, and actionable overview of your account and open trades.
The dashboard is designed to help you instantly answer three critical questions: How much have I made today? How much will I lose if all my trades go wrong? Is my account over-lev

Currency Strength Meter is the easiest way to identify strong and weak currencies. This indicator shows the relative strength of 8 major currencies + Gold: AUD, CAD, CHF, EUR, GBP, JPY, NZD, USD, XAU. Gold symbol can be changed to other symbols like XAG, XAU etc. By default the strength value is normalised to the range from 0 to 100 for RSI algorithm: The value above 60 means strong currency; The value below 40 means weak currency;
This indicator needs the history data of all 28 major currency

YOU CAN NOW DOWNLOAD FREE VERSIONS OF OUR PAID INDICATORS . IT'S OUR WAY OF GIVING BACK TO THE COMMUNITY ! >>> GO HERE TO DOWNLOAD
More About Advanced Currency Meter Every good forex system has the following basic components: Ability to recognize the trend direction. Ability to identify the strength of the trend and answer the basic question Is the market trending or is it in a range? Ability to identify safe entry points that will give a perfect risk to reward (RR) ratio on every position.
FREE

Blahtech Fisher Transform indicator is an oscillator that displays overbought and oversold locations on the chart. The Fisher Transform algorithm transforms prices with any distribution shape into a normal distribution. The end result is a curve with sharp turning points that may help to identify bullish or bearish trends. Fisher Transform values exceeding 1.66 on the daily chart are considered to be good areas for reversal trades. Links [ Install | Update | Training | All Products ]
F

Donchian Channel (ou canal de Donchian) é um indicador criado por Richard Donchian. Ele é formado tomando a máxima mais alta e a mais baixa mais baixa do último período especificado em velas. A área entre alta e baixa é o canal para o período escolhido.
Sua configuração é simples. É possível ter a média entre a linha superior e inferior além de alertas quando o preço atinge um dos lados. Se tiver alguma dúvida ou encontrar alguma falha, me contate. Faça bom uso!
FREE
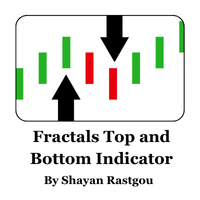
Discover the power of fractals to uncover significant market reversals! This custom Fractals Indicator for MetaTrader 5 is designed to help traders quickly and effectively spot potential swing highs and lows, providing visual cues that make trading decisions easier. Key Features: Clear Buy & Sell Signals: Green and red arrows highlight bullish and bearish fractals, helping you effortlessly identify significant price pivots. Customizable Analysis Depth: Choose the number of bars to evaluate for f
FREE

Volume Profile Pro Signals
Análise de volume de precisão com geração automática de sinais. O que faz
Volume Profile Pro Signals constrói uma visão dinâmica e baseada em dados de onde o volume de negociação realmente ocorre — revelando zonas onde o preço é aceite ou rejeitado. Destaca POC, VAH, VAL e identifica com precisão zonas HVN/LVN. A partir daí gera sinais de breakout em tempo real (VAH/VAL) e traça níveis inteligentes de SL/TP calculados pela volatilidade (ATR). Cada componente — da re
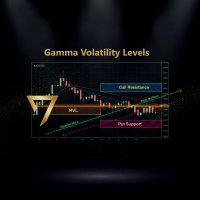
Gamma & Volatility Levels Pro [XAUUSD Edition] – The indicator used by professional gold traders in 2025 Fully automatic indicator developed exclusively for XAUUSD (Gold). Displays in real time the most powerful institutional levels that move gold price every single day: • HVL (High Volatility Level) – Orange dashed line Dynamic extreme volatility level (20-period SMA + 1 standard deviation). Gold bounces or breaks this level 87 % of sessions with moves of +$40 to +$120. • CALL RESISTANCE – Blue

Think of the rarest pair you can think of. And I assure you that this indicator can compute it is strength. This Currency Meter will literally calculate any currency pairs, either it is a major pair, metal, CFD, commodity, cryptocurrency like Bitcoin/BTC or Ethereum/ETH and even stocks. Just name it and you will get it! There is no currency pair this Currency Meter cannot solve. No matter how rare or exotic is that currency, it will always be solved by this Currency meter on a real-time basis. S

Medidor de volatilidade Phoenix ATR (MT5)
Ferramenta de monitoramento de volatilidade em tempo real para MetaTrader 5. Utiliza o Average True Range (ATR) para exibir a volatilidade atual do mercado em seu gráfico.
Objetivo
A volatilidade do mercado afeta diretamente a colocação de stops, o tamanho das posições, o slippage e a eficácia da estratégia. Negociar sem estar ciente da volatilidade muitas vezes leva a riscos excessivos em mercados rápidos ou a oportunidades perdidas em condições tran
FREE

Fechamento do Dia Anterior e Deslocamento de Barras para o MetaTrader! O Indicador de Fechamento do Dia Anterior e Deslocamento de Barras é uma ferramenta projetada para aprimorar a análise técnica e a tomada de decisões no trading. Com esse indicador, você terá acesso a informações detalhadas sobre os níveis de abertura, máxima, mínima e fechamento de qualquer barra, permitindo uma análise precisa e abrangente dos movimentos do mercado. Imagine ter a capacidade de colocar um timeframe dentro do
FREE

VM SuperAshi Trend Precision Trend Sniper using Smoothed Heiken Ashi, Supertrend and EMA Trend
Optimized for M1–M5 Scalping
Overview VM SuperAshi Trend is an indicator that combines a standardized Supertrend with smoothed Heiken-Ashi candles to deliver clear, confirmed, and non-repainting buy/sell signals directly on the chart. It automatically draws Buy/Sell arrows, displays Fast, Slow, and Trend EMA lines, and provides Popup, Email, and Push notifications.
Key Features Supertrend-based signal

Multi Currency Strength Dashboard Mini (GRÁTIS) – Medidor de Força de Moedas para MetaTrader 5 Multi Currency Strength Dashboard Mini é um indicador gratuito para MetaTrader 5 que exibe em tempo real a força relativa de 8 moedas principais (USD, EUR, GBP, JPY, CHF, CAD, AUD, NZD) em um dashboard visual limpo e fácil de interpretar. Objetivo: ajudar você a identificar rapidamente quais moedas estão fortes e quais estão fracas , para montar sua watchlist e escolher pares com lógica forte vs fraca
FREE

Modificação multimoeda e multitimeframe do indicador Moving Average (MA). No painel você pode ver o estado atual do indicador - rompimentos e toques (por preço) do MA Rápido e MA Lento, bem como a intersecção das linhas MA entre si (cruzamento da média móvel). Nos parâmetros você pode especificar quaisquer moedas e prazos desejados. Além disso, o indicador pode enviar notificações sobre o preço tocando as linhas e sobre o seu cruzamento. Ao clicar em uma célula com ponto final, este símbolo e p

O painel de alerta RSI / TDI permite monitorar RSIs de uma só vez (selecionável por você) em todos os principais pares que você negocia.
Você pode usá-lo de duas maneiras:
1. Selecione vários prazos e o traço mostrará quando houver vários prazos estendidos além das condições normais de negociação. Um ótimo indicador de que o preço aumentou muito recentemente, pois atingiu um nível de sobrecompra ou sobrevenda em vários prazos, de modo que uma retração ou reversão deve ocorrer em breve.
2. U
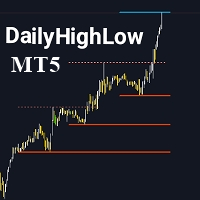
Por favor, não se esqueça de avaliar o indicador para ajudar na sua visibilidade. O indicador DailyHighLow é projetado especificamente para a plataforma MetaTrader 5 (MT5) e tem como objetivo ajudar os traders a monitorar as flutuações diárias dos preços. Este indicador traça automaticamente linhas de tendência com base nos preços mais altos e mais baixos de um período personalizado, oferecendo uma assistência visual clara para os traders que precisam de informações precisas sobre o mercado. Pri
FREE

Smart Entry Levels - Fractal and ATR Based Indicator Smart Entry Levels identifies key support and resistance zones using classical fractal detection and ATR-based volatility measurement. The indicator is designed for clarity, stability, and compliance with MQL5 Market rules. Features Upper Zone - Resistance area based on recent fractal highs Lower Zone - Support area based on recent fractal lows ATR-based sizing - Zones adapt dynamically to market volatility with selectable timeframe Non-repain
FREE

For those who appreciate Richard Wyckoff approach for reading the markets, we at Minions Labs designed a tool derived - yes, derived, we put our own vision and sauce into this indicator - which we called Waves PRO . This indicator provides a ZigZag controlled by the market volatility (ATR) to build its legs, AND on each ZigZag leg, we present the vital data statistics about it. Simple and objective. This indicator is also derived from the great book called " The Secret Science of Price and Volum

As Ondas de Weis primeiro pegam o volume do mercado e, em seguida, organiza-o com o preço nos gráficos das ondas. É o único software que apresentará a verdadeira imagem do mercado antes de você. Se você já notou o movimento do preço no período intra-diário já deve saber que ele se desdobra em uma série de movimentos de ondas de vendas e compras - movimentos que se desfazem e se acumulam.
A análise de ondas é parte integrante do método de negociação. O indicador ajuda a lidar com o mercado volá
FREE

The Breakout Finder (BF) is a technical analysis indicator designed for MetaTrader 5 (MT5) platforms. It identifies potential breakout and breakdown patterns in price action by analyzing pivot highs and lows over a specified period. The indicator detects "cup" formations—clusters of pivot points within a narrow price channel—indicating areas of consolidation that may lead to strong directional moves when broken. EA: BlackHole Breakout EA https://www.mql5.com/en/market/product/149206
Key Featur
FREE
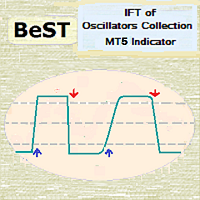
BeST_IFT of Oscillators Collection is a Composite MT4/5 Indicator that is based on the IFT ( Inverse Fisher Transformation ) applied to RSI , CCI , Stochastic and DeMarker Oscillators in order to find the best Entry and Exit points while using these Oscillators in our trading. The IFT was first used by John Ehlers to help clearly define the trigger points while using for this any common Oscillator ( TASC – May 2004 ). All Buy and Sell Signals are derived by the Indicator’s crossings of the Bu

Smart Session Box Displays Asia, London, and New York trading sessions with automatic timezone adjustment and session overlap highlighting. Main Features Complete session analysis with no limitations. Key Features The indicator draws session boxes with high and low lines for each trading session. Session overlaps are highlighted with distinct colors to identify high liquidity periods. Breakout alerts notify when price crosses previous session levels. A control panel provides quick toggles for al
FREE

Contact me after payment to send you the user manual PDF file. Download the MT4 version here. Unlocking Trading Insights Dive into the heart of market dynamics with Advance Divergence Scanner designed for traders seeking a competitive edge. The Divergence Indicator is your key to identifying crucial divergences across various charts, empowering you to make informed decisions in the dynamic world of financial markets. The Divergence A Divergence signals a potential reversal point because directi

MT5 Version : This indicator represents a genuine momentum oscillator according to the true definition of "Momentum", and as realised by the techniques of digital filters. Scholarly papers on the subject by the current developer can be found here and here , but in this description we shall borrow only the minimum of conceptual and mathematical framework needed. In the process, we expose some long-held myths about indicators supposedly measuring price momentum, and in particular the one ca
FREE

Local Time Scale Overlay is a technical indicator for MetaTrader 5 that enhances chart readability by overlaying a local time scale on the trading chart. It calculates the difference between your local system time and the server time and uses this difference to display time labels that reflect your local time at predefined intervals. The time interval is customizable via a drop‐down menu with options such as 5, 10, 15, 20, 30, 60, 120, and 480 minutes (with 15 minutes as the default).
Key Featu
FREE

Swing BOS Structure is a market structure indicator for MetaTrader 5.
The indicator automatically detects: • Swing High (SH) • Swing Low (SL) • Break of Structure (BOS) • Change of Character (CHoCH)
Swings are confirmed only after a defined number of candles, ensuring no repainting. BOS signals indicate trend continuation. CHoCH signals indicate a potential change in market structure and may appear less frequently depending on market conditions and timeframe.
The indicator is lightweight, fa
FREE

Zenith Session Flux is a professional-grade technical indicator for MetaTrader 5 designed to identify and visualize institutional trading windows known as ICT Killzones. The indicator automates the process of time-alignment by synchronizing your broker's server time with New York local time, ensuring that session boxes and price pivots appear at the precise institutional moments regardless of your broker's timezone. Indicator Features: Automatic Timezone Sync: Automatically calculates the offset
FREE

This is RSI with alarm and push notification -is a indicator based on the popular Relative Strength Index (RSI) indicator with Moving Average and you can use it in Forex, Crypto, Traditional, Indices, Commodities. You can change colors to see how it fits you. Back test it, and find what works best for you. This product is an oscillator with dynamic overbought and oversold levels, while in the standard RSI, these levels are static and do not change.
This allows RSI with alarm and push notifica
FREE

Construa sua estratégia por você mesmo Esta ferramenta permite que você desenvolva suas estratégias, utilizando todos os indicadores disponíveis nativamente no MetaTrader e todos os indicadores baixados da internet que utilizam buffers como forma de mostrar dados na tela. Esta ferramenta é mais um motivo para você considerar o MetaTrader para automatizar suas estratégias de negociação. Com ela, você pode criar os seus próprios sinais de estratégia de forma simples e intuitiva, usando qualquer in
FREE

Buy Sell Signal Low TF gives buy/sell signals and alerts with up and down arrow at potential reversal of a pullback or a trend continuation pattern in low timeframe. This is an indicator which gives signals based on trend => It works best in trend market with the principle is to ride on the trend not trade against the trend.
The components of Buy Sell Signal Low TF: - The trend is determined by SMMA 13 , SMMA 21 and SMMA 35 ( can be changed manually to suit your preference). - The signal is b
FREE

Developed by Chuck LeBeau, the Chandelier Exit indicator uses the highest high / lowest low -/+ a multiple of the ATR value to draw trailing stop lines (orange under buys, magenta over sells) that advance with the trend until the trend changes direction.The value of this trailing stop is that it rapidly moves upward in response to the market action. LeBeau chose the chandelier name because "just as a chandelier hangs down from the ceiling of a room, the chandelier exit hangs down from the high
FREE

Breakout Monitor is a powerful trading tool designed to track price action within your custom-drawn zones. Simply draw a rectangle on your chart to define your consolidation or key levels, and the indicator will do the rest. It highlights the price range clearly and monitors it in real-time, ensuring you never miss a significant market move. When the price breaks through your defined boundaries, the indicator sends an instant Push Notification directly to your mobile phone in a clear, actionable
FREE

It is one of the famous indicator in TradingView platform. Supertrend indicator shows the trend of the market intuitively . You can use it for understanding the trend or get insight about the market.
------- Value & Color -------- You can change the colour (line, filled). Default value is the same as Tradingview Supertrend default value ( period 10, ATR multiplier 3.0)

VWAP Fibo Bands RSJ é um indicador que traça a linhas do VWAP diário e a partir dela cria bandas utilizando proporções de Fibonacci.
Este espetacular indicador cria 10 níveis de bandas através da VWAP diária utilizando proporções de Fibonacci. É fantástico com os preços respeitam cada nível das bandas, aonde é possível perceber que quase toda vez que o preço fecha acima/abaixo de um nível das bandas ele irá buscar o próximo. Se fecha acima irá buscar atingir o nível acima e se fecha abaixo ir
FREE

Hydra Trend Rider is a non-repainting, multi-timeframe trend indicator that delivers precise buy/sell signals and real-time alerts for high-probability trade setups. With its color-coded trend line, customizable dashboard, and mobile notifications, it's perfect for traders seeking clarity, confidence, and consistency in trend trading. Setup & Guide: Download MT4 Version here. To learn how to use the Indicator: Indicator Manual & Guide - Read Here
Exclusively for you: It's your chance to st
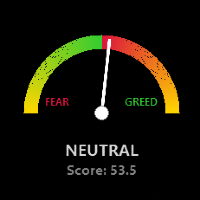
Global Market Risk Sentiment Meter 1. Abstraction The Global Market Risk Sentiment Meter is a sophisticated analytical tool designed for the MetaTrader 5 (MQL5) platform. Unlike traditional indicators that analyze a single asset in isolation, this utility employs an Inter-Market Analysis approach to reconstruct the psychological state of the global financial markets. By aggregating real-time data from US Indices, Global Equities, Cryptocurrencies, and Safe Haven assets (Gold and the US
FREE

Monitor de Padrões de Velas Phoenix (MT5)
Ferramenta de detecção e monitoramento de padrões de velas em tempo real para MetaTrader 5. Identifica automaticamente padrões clássicos de velas em vários símbolos e exibe estatísticas abrangentes de padrões por meio de um painel visual.
Visão geral
O Monitor de Padrões de Velas Phoenix detecta e rastreia os padrões Doji, Martelo, Estrela Cadente, Engolfamento de Alta, Engolfamento de Baixa, Estrela da Manhã, Estrela da Tarde, Três Soldados Brancos e
FREE

Elliot Waves Analyzer Pro calculates Elliot Waves to Help Identify Trend direction and Entry Levels. Mainly for Swing Trading Strategies. Usually one would open a Position in trend direction for Wave 3 or a Correction for Wave C . This Indicator draws Target Levels for the current and next wave. Most important Rules for Elliot Wave Analysis are verified by the Indicator. The Pro version analyzes Multiple Timeframes and shows the Subwaves and Target-Levels. For an Overview " Elliot Waves Anal

Para versão atualizada com melhorias e entrada automática. Acesse meu perfil e conheça o Fimathe Painel
O Indicador Fimathe é uma ferramenta para o MetaTrader 5 criada a partir dos ensinamentos do mestre Marcelo Ferreira, a ferramenta que facilita a identificação de níveis de suporte, resistência, zonas neutras e canais de preço. Com uma interface interativa, ele permite traçar e gerenciar linhas de suporte e resistência, gerar canais de take e zonas neutras, além de oferecer alertas visuai
FREE

FREE Bookmap Volume Heatmap Indicator Overview The Bookmap Volume Heatmap is a custom MetaTrader 5 (MQL5) indicator that creates a visual heatmap of trading volume distribution across price levels, similar to professional trading platforms like Bookmap. It provides traders with a clear visualization of where significant trading activity has occurred within a specified price range. Key Features 1. Volume Distribution Visualization Creates color-coded rectangles on the chart representing vol
FREE

Product Name: Auto Trend Pattern Pro [Subho - India] Short Description:
An advanced Price Action tool that automatically detects and draws Trend Channels, Wedges, and Triangles with a live Dashboard. Full Description: Auto Trend Pattern Pro is a sophisticated technical indicator designed for MetaTrader 5. It automates the complex task of drawing Trend Lines and Channels. By analyzing historical price action, the indicator identifies the most accurate "Best Fit" channels for both short-term
FREE

This indicator uses support and resistance, volume and some special formula to calculate the volume to filter the candles. If the volume reaches a specific value, And at the same time, Candle breaks the support/resistance line, There would be a signal and we can enter the market. Signals appear when the current candle closes. then you can enter the trade when a new candle appears. Please don't forget to follow your money management plan.
MT4 Version Support/Resistance Breakout MT4 : https:/
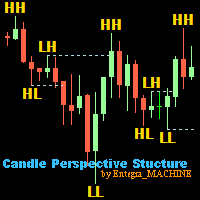
Candle Perspective Structure Indicator MT5 is a simple indicator that defines and displays the candlestick structure of the market. This indicator will suit both experienced traders and beginners who find it difficult to follow the structure visually.
If you want to see more high-quality products or order the development/conversion of your own products, visit my partners' website: 4xDev
Get 10% OFF on manual strategies automation services or indicator development/conversion services at 4xDev
FREE

A personal implementation of the famous Bollinger bands indicator as a trend following mechanism, which uses a moving average and the standard deviation to define what a trend is and when it changes. Bollinger bands are usually used as an oversold/overbought indicator only, but in my opinion, the trading approach is more complete using the trend variant as an exit strategy. [ Installation Guide | Update Guide | Troubleshooting | FAQ | All Products ] Easy to trade Customizable colors and sizes I
FREE
Volume Profile Density V2.40 Mostra a distribuição do volume por nível de preço, revelando áreas de interesse institucional.
Diferente do volume clássico (por tempo), mostra onde o volume realmente se concentrou. Conceitos principais: Barras horizontais = volume negociado em cada preço Barra mais longa → maior volume Zonas vermelhas = suportes e resistências fortes Principais usos: Identificar suportes e resistências reais Determinar o POC (Ponto de Controle) Definir a Área de Valor (70 % do vol
FREE

Multi-period Parallel Random Oscillator 1. Main chart cycle main line and signal line 2. 15M 30M 1H fixed cycle signal line Mainly used to observe the overbought and oversold conditions of other cycles in the same chart。 Its main function is to identify moments of multi-cycle resonance, enabling you to better grasp opportunities for buying and selling points.
FREE

Elliot Waves Analyzer calculates Elliot Waves to Help Identify Trend direction and Entry Levels. Mainly for Swing Trading Strategies. Usually one would open a Position in trend direction for Wave 3 or a Correction for Wave C . This Indicator draws Target Levels for the current and next wave. Most important Rules for Elliot Wave Analysis are verified by the Indicator. This free version is limited for Analyzing one Timperiod Waves. Waves are Shown only in PERIOD_H4 and above. Not Useful for Intr
FREE

DESCRIÇÃO
ICSM (Impulse-Correction SCOB Mapper) é o indicador que analisa o movimento do preço e identifica impulsos válidos, correções e SCOBs (Single Candle Order Block). É uma ferramenta poderosa que pode ser usada com qualquer tipo de análise técnica porque é flexível, informativa, fácil de usar e melhora substancialmente a consciência do trader sobre as zonas de interesse mais líquidas.
CONFIGURAÇÕES
Geral | Visuais
Tema de cor — define o tema de cor do ICSM.
SCOB | Visuais
Mostrar S
O Mercado MetaTrader contém robôs de negociação e indicadores técnicos para traders, disponíveis diretamente no terminal.
O sistema de pagamento MQL5.community está disponível para todos os usuários registrados do site do MQL5.com para transações em todos os Serviços MetaTrader. Você pode depositar e sacar dinheiro usando WebMoney, PayPal ou um cartão de banco.
Você está perdendo oportunidades de negociação:
- Aplicativos de negociação gratuitos
- 8 000+ sinais para cópia
- Notícias econômicas para análise dos mercados financeiros
Registro
Login
Se você não tem uma conta, por favor registre-se
Para login e uso do site MQL5.com, você deve ativar o uso de cookies.
Ative esta opção no seu navegador, caso contrário você não poderá fazer login.