Technische Indikatoren für den MetaTrader 5 - 11
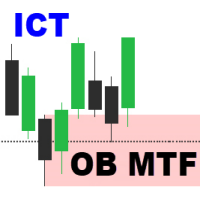
Order Block Multi Timeframe Order Block Multi Timeframe ist ein leistungsfähiges Tool für Smart Money Concept (SMC)-Händler, das eine hochpräzise Order Block-Erkennung mit einer Echtzeit-Analyse von Break of Structure (BOS) und Change of Character (CHoCH) über mehrere Zeitrahmen kombiniert. Smart Money Insight, Multi-Timeframe-Präzision Dieser Indikator identifiziert automatisch institutionelle Orderblöcke - wichtige Preiszonen, in denen große Akteure in den Markt eingetreten sind - und zeichnet

Löwenpfeil-Superpfeil-Indikator für MetaTrader 5
Der Lion Arrow Super Arrow Indicator für MetaTrader 5 ist ein hybrides Handelssystem, das mehrere fortschrittliche technische Analysetools integriert, um hochwertige Handelssignale zu generieren. Durch die Kombination von trend-, momentum- und druckbasierten Indikatoren zielt er darauf ab, Fehlsignale zu reduzieren und die Einstiegsgenauigkeit zu verbessern. Kernkomponenten des Indikators Der Lion Arrow Super Arrow-Indikator basiert auf mehreren
FREE

Currency Strength Meter is the easiest way to identify strong and weak currencies. This indicator shows the relative strength of 8 major currencies + Gold: AUD, CAD, CHF, EUR, GBP, JPY, NZD, USD, XAU. Gold symbol can be changed to other symbols like XAG, XAU etc. By default the strength value is normalised to the range from 0 to 100 for RSI algorithm: The value above 60 means strong currency; The value below 40 means weak currency;
This indicator needs the history data of all 28 major currency
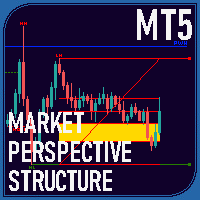
Überblick Der Market Perspective Structure Indicator ist ein umfassender MetaTrader-Indikator, der Händlern eine detaillierte Analyse der Marktstruktur über mehrere Zeitrahmen hinweg bietet. Er identifiziert und visualisiert wichtige Preisaktions-Elemente, einschließlich Swing-Hochs und -Tiefs, Break of Structure (BOS), Change of Character (CHOCH), interne Strukturen, gleiche Hochs/Tiefs, Premium/Discount-Levels, frühere Levels aus höheren Zeitrahmen und Handelssitzungszonen. Dank umfangreicher

KS ABC-Muster Live-Signal MSS mit FIB
Hauptzweck
Dies ist ein nicht-nachmalendes Preis-Aktions-Tool, das sich an Händler richtet, die **ICT (Inner Circle Trader)** oder **SMC (Smart Money Concepts)** Methoden folgen. Es konzentriert sich auf die Identifizierung von hochwahrscheinlichen **ABC-Korrektur-/Pullback-Mustern** nach starken Momentum-Impulsen, kombiniert mit **Market Structure Shift (MSS)**-Bestätigung und **Fibonacci**-Konfluenz für Einstiegssignale.
Es ist für den **manuellen Hand
FREE

MarketTime - Professionelle Multi-Zeitzonen-Uhr und Sitzungsindikator Verpassen Sie Nie Wieder eine Handelssitzung - Überwachen Sie Globale Marktzeiten in Echtzeit MarketTime ist ein professioneller Indikator, der mehrere Zeitzonen, Live-Sitzungs-Countdowns und visuelle Handelssitzungszonen direkt auf Ihren MetaTrader 5-Charts anzeigt. Beim Forex-Handel ist das Timing alles - zu wissen, wann große Finanzzentren aktiv sind und wann sich Sitzungen überschneiden, kann Ihren Handelserfolg erheblich
FREE

Super Signal Serie - V2 PRO Falcon Real Time Trend Rider Signals - Professionelles MT4 Dashboard Exklusiver GRATIS Bonus Exklusiver Bonus Wenn Sie diesen Indikator kaufen, erhalten Sie 2 professionelle Gold EAs: MT4 Gold EA
XAU Trend Matrix EA - Im Wert von $150 : Siehe den EA https://www.mql5.com/en/market/product/162870 MT5 Gold EA
XAU Steady Gain Pro - Im Wert von $150 : Siehe den EA https://www.mql5.com/en/market/product/162861 Gesamter Bonuswert: $300 Beschreibung des Produkts Falcon Trend
Advanced Trend Analyzer Pro MT5 Das ultimative Multi-Strategie-Trend-Analyse-System, das niemals nachlässt Transformieren Sie Ihr Trading mit professioneller Marktanalyse Advanced Trend Analyzer Pro MT5 ist ein revolutionärer Indikator, der Fuzzy Logic , Multi-Timeframe-Analyse und Währungsstärke-Technologie in einem leistungsstarken Handelssystem kombiniert. Entwickelt für ernsthafte Trader, die Präzision, Zuverlässigkeit und konsistente Leistung unter allen Marktbedingungen verlangen.

Pure Trend Logic MT5 - Professioneller Trendfolge-Algorithmus Pure Trend Logic MT5 ist die Verkörperung einer klassischen Handelsstrategie in einer modernen, interaktiven Hülle. Der Indikator wurde für Trader entwickelt, die saubere Charts und mathematische Präzision schätzen. Das System kombiniert drei Ebenen der Preisanalyse und ermöglicht es Ihnen, Einstiegspunkte mit einem mathematischen Vorteil zu finden. ### Philosophie des Indikators: Er basiert auf der "goldenen Regel" des Handels: Hande
FREE
Der VSA (Volume Spread Analysis)-Volumenindikator ist ein leistungsstarkes technisches Instrument, das von Händlern zur Analyse der Beziehung zwischen Preisbewegung und Handelsvolumen verwendet wird. VSA basiert auf der Wyckoff-Methode und hilft dabei, Ungleichgewichte zwischen Angebot und Nachfrage zu erkennen und die versteckten Aktionen institutioneller Akteure - oft als "smart money" bezeichnet - aufzudecken. Dieser Indikator wertet drei Schlüsselelemente aus: Volumen, Preisspanne (die Diff
FREE

VJ Sniper - MT5 Buy / Sell Indicator: Dieser Indikator ist so einfach wie Buy in Up Trend & Sell in Down Trend. Es gibt grafische Unterstützungs-/Widerstandsniveaus für die Auswahl der besten Einstiege. Hintergrund: Jeder eingebaute Indikator des MT5 funktioniert nicht als Einzelindikator, wie z.B. Stochastic, CCI oder DeMarker etc. Aber die Kombination von ihnen mit der Trendprojektion funktioniert und liefert die besten Ergebnisse für den Einstieg in den Handel. So ist dieser Indikator gemisch

SMC Liquidity MAX MT5 ist ein fortschrittlicher Smart Money Concepts (SMC)-Indikator, der für Intraday- und Swing-Trader entwickelt wurde, die eine klare und strukturierte Marktanalyse wünschen. Er integriert die wichtigsten Komponenten des institutionellen Ansatzes - Struktur, Liquidität und Volumen - in einem einzigen Panel mit optimierter Echtzeitdarstellung. Kernfunktionen Marktstruktur: Automatische Identifizierung von BOS (Break of Structure) und CHoCH (Change of Character). Ungleichgewic

Local Time Scale Overlay ist ein technischer Indikator für MetaTrader 5, der die Lesbarkeit des Charts verbessert, indem er eine lokale Zeitskala über das Chart legt. Er berechnet die Differenz zwischen Ihrer lokalen Systemzeit und der Serverzeit und verwendet diese Differenz, um Zeitlabels anzuzeigen, die Ihre lokale Zeit in vorgegebenen Intervallen darstellen. Das Zeitintervall lässt sich über ein Dropdown-Menü anpassen, das Optionen wie 5, 10, 15, 20, 30, 60, 120 und 480 Minuten bietet (mit 1
FREE

SnR-Engine Im Grunde handelt es sich um einen Unterstützungs- und Widerstandsindikator wie die meisten anderen, die Fraktale zur Bestimmung von Unterstützungs- und Widerstandsniveaus verwenden. Der Unterschied besteht darin, dass dieser Indikator anhand der ATR ermittelt, ob ein Unterstützungs- oder Widerstandsniveau durchbrochen wurde. Niveaus, die durchbrochen wurden, werden zu "toten Niveaus" und werden mit gestrichelten Linien angezeigt.
Niveaus, die viele Ablehnungen aufweisen und nicht d
FREE

Orderflow Super Candles - Einfacher Footprint Chart Indikator
Plattform: MetaTrader 5 (MT5) (Der letzte Screenshot zeigt die Verwendung des DOM-Tools in Verbindung mit dem Produkt). 1. Produktvorstellung Orderflow Super Candles ist ein professionelles Charting-Tool, das auf der Analyse der zugrunde liegenden Tick-Daten basiert und Händlern einen tiefen "Röntgenblick" auf den Markt ermöglicht. Durch die Analyse der Verteilung des Kauf- und Verkaufsvolumens innerhalb jeder Kerze visualisiert die

Natürlich, hier ist die Übersetzung in Deutsch: Vorstellung des Astronomie-Indikators für MT4 / MT5 : Dein ultimativer himmlischer Trading-Begleiter Bist du bereit, deine Trading-Erfahrung auf himmlische Höhen zu heben? Suche nicht weiter als unseren revolutionären Astronomie-Indikator für MT4. Dieses innovative Tool übertrifft herkömmliche Trading-Indikatoren und nutzt komplexe Algorithmen, um dir unvergleichliche astronomische Einblicke und präzise Berechnungen zu bieten. Ein Universum an In

Der Hybrid-Stochastik-Indikator ist ein stochastischer RSI , der von dem berühmten Tushar Chande und Stanley Kroll in ihrem Buch "The New Technical Trader" beschrieben wurde. Das Hauptziel dieses Indikators ist es, mehr überkaufte und überverkaufte Signale zu generieren als der traditionelle Relative-Stärke-Indikator (RSI). Durch die Kombination dieser beiden Indikatoren wird der Bereich des überkauften und überverkauften Bereichs vergrößert. Die Idee dahinter ist, die Stochastik-Formel über die
FREE
Supertrend G5 Indikator Supertrend G5 ist ein leistungsfähiges Trendfolge-Tool, das entwickelt wurde, um Marktumkehrpunkte genau zu identifizieren. Durch die Anzeige einer farbkodierten Linie direkt auf dem Chart hilft Ihnen dieser Indikator, Aufwärtstrends (grün) und Abwärtstrends (rot) schnell zu erkennen, und unterstützt so optimale Einstiegs- und Ausstiegspunkte. Hauptmerkmale: Klare Kauf-/Verkaufssignale Kaufen Sie, wenn die Supertrend-Linie von rot nach grün wechselt (Beginn eines Aufwärts
FREE

Projective SR – Echtzeit-projizierte Unterstützung und Widerstände Projective SR ist ein fortschrittlicher Indikator, der automatisch wichtige Unterstützungs- und Widerstandspunkte im Chart erkennt und diese diagonal und dynamisch in die Zukunft projiziert . Er antizipiert somit mögliche Zonen, in denen der Preis reagieren könnte. Im Gegensatz zu traditionellen Indikatoren, die nur feste Niveaus anzeigen, analysiert Projective SR die Preisgeometrie , identifiziert die relevantesten Pivots und ze
FREE

Der MT5-Indikator Advanced Trend Scalper wurde entwickelt, um sowohl Anfängern als auch professionellen Händlern zu helfen. Der Indikator analysiert den Markt und gibt Ihnen Kauf- und Verkaufssignale. Er verwendet keine anderen Indikatoren, sondern arbeitet nur mit den Aktionen des Marktes. Das Signal erscheint direkt nach dem Schließen der Kerze und wird nicht erneut angezeigt. Der effiziente Algorithmus sorgt für ein hohes Maß an Zuverlässigkeit solcher Signale. Advanced Trend Scalper für das
** Alle Symbole x Alle Zeitrahmen scannen nur durch Drücken der Scanner-Taste ** ***Kontaktieren Sie mich, damit ich Ihnen eine Anleitung schicken und Sie in die "RSI-Scanner-Gruppe" aufnehmen kann, um Erfahrungen mit anderen Benutzern zu teilen oder zu sehen. Einführung RSI-Divergenz ist eine wichtige Technik die verwendet wird, um die Trendumkehr zu bestimmen, wenn es Zeit ist, zu verkaufen oder zu kaufen, weil die Preise wahrscheinlich fallen oder in den Charts steigen werden. Der RSI-Diverg
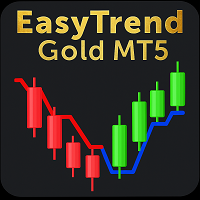
Haben Sie genug von verwirrenden Indikatoren, insbesondere beim Handel auf dem volatilen Goldmarkt? Der EasyTrend Gold MT5 wurde entwickelt, um die Volatilität von Gold in jeder Zeiteinheit zu bändigen. Er nutzt die Kraft des ATR, um die scharfen Bewegungen von Gold in eine einzige, klare und dynamische Trendlinie zu übersetzen, die das Rauschen eliminiert. Egal, ob Sie im M1-Chart scalpen oder im H4-Chart Swing-Trading betreiben, Sie können die Trendrichtung und -stärke visualisieren, Konsolidi
FREE
REVERSAL POWER PRO
Der EINZIGE Indikator, der Ihnen zeigt, wo die Märkte umkehren werden - BEVOR sie sich bewegen
WILLKOMMEN AUF DER NÄCHSTEN STUFE DER HANDELSPRÄZISION
Haben Sie es satt zu raten, wohin der Markt drehen wird ? Verpassen Sie den Einstieg, weil Sie nicht wissen, wo Unterstützung/Widerstand WIRKLICH ist ? Werden Sie bei "falschen" Niveaus ausgestoppt ? Fragen Sie sich, ob Ihr Bias richtig ist, bevor Sie einsteigen?
Was wäre, wenn Sie Folgendes hätten : Kristallklare Angebots-/
FREE

Der Demand & Supply Zone Indicator mit Volume Filtering ist ein technisches Analysetool für MetaTrader, das wichtige Preiszonen identifiziert, in denen sich der Kauf- (Nachfrage) oder Verkaufsdruck (Angebot) konzentriert. Er nutzt Fraktale, Volumenanalyse und Preisaktionen, um diese Zonen auf dem Chart zu erkennen und hervorzuheben. Hauptmerkmale: Zonenerkennung auf der Grundlage von Fraktalen Identifiziert Nachfrage- (Unterstützung) und Angebotszonen (Widerstand) anhand von Fraktalmustern ( lok
FREE
Ekom Spike-Detektor
Navigieren Sie in der volatilen Welt der Boom- und Crash-Indizes mit dem Ekom Spike Detector Indikator. Dieses leistungsstarke Instrument erkennt explosive Kursbewegungen und liefert den Händlern rund um die Uhr präzise Kauf- und Verkaufssignale.
Hauptmerkmale :
Spike-Erkennung : Identifizierung von Spike-Mustern mit hoher Wahrscheinlichkeit in Echtzeit Klare visuelle Signale : Zeigt klare Kauf- und Verkaufspfeile auf dem Chart an und erleichtert so die Entscheidungsfindu
FREE

Die Erzählung kontextualisieren: Vereinfachte Multi-Timeframe-Struktur HTF Period Cycles ist ein leistungsstarkes Visualisierungstool, das für Händler entwickelt wurde, die ihre Intraday-Analysen auf Higher Timeframe (HTF)-Ebenen verankern müssen, ohne zwischen verschiedenen Registerkarten wechseln zu müssen. Durch die Projektion von Open, High, Low und Close (OHLC) abgeschlossener HTF-Zyklen direkt auf Ihren unteren Zeitrahmen (LTF) können Sie eine kristallklare Ausrichtung beibehalten, während
FREE

Preis-Volumen-Trend (PVT) Oszillator Beschreibung: Der PVT Oscillator ist ein Volumenindikator, der als Alternative zum Standard On-Balance Volume (OBV) dient. Während gewöhnliche Volumenindikatoren verrauscht und schwer ablesbar sein können, wandelt dieses Tool den Volumenfluss in einen klaren Histogramm-Oszillator um, ähnlich wie ein MACD, aber für Volumen. Es wurde entwickelt, um erste Trendumkehrungen und Divergenzen zu erkennen, indem es die Differenz zwischen einem schnellen und einem lang
FREE

Necessary for traders: tools and indicators Waves automatically calculate indicators, channel trend trading Perfect trend-wave automatic calculation channel calculation , MT4 Perfect trend-wave automatic calculation channel calculation , MT5 Local Trading copying Easy And Fast Copy , MT4 Easy And Fast Copy , MT5 Local Trading copying For DEMO Easy And Fast Copy , MT4 DEMO Easy And Fast Copy , MT5 DEMO Fortgeschrittene Bollinger Bands:
1. Die Bollinger-Schiene ändert ihre Farbe mit der Richtung
FREE

Überblick Der Liquiditätsindikator ist ein Marktanalysetool, das Händlern helfen soll, potenzielle Marktreaktionszonen auf der Grundlage des Liquiditätsverhaltens und der Kursentwicklung zu identifizieren. Anstatt herkömmliche gleitende Durchschnitte zu verwenden, analysiert dieser Indikator den Liquiditätsfluss und die Pivot-Strukturen, um Bereiche hervorzuheben, in denen der Preis reagieren könnte. Dieser Indikator soll die technische Analyse und Entscheidungsfindung unterstützen, nicht aber M
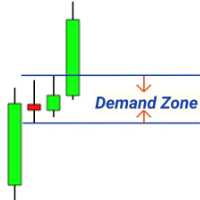
MT4-Version: https://www.mql5.com/en/market/product/125434 MT5-Version: https://www.mql5.com/en/market/product/157662
MT4-Assistent: https://www.mql5.com/en/market/product/107986
Rally Base Rally (RBR), Drop Base Rally (DBR), Drop Base Drop (DBD), Rally Base Drop (RBD), Fair Value Gap (FVG) / Ungleichgewicht, Hidden Base
Wir präsentieren den „Supply Demand MT4“-Indikator – Ihr ultimatives Werkzeug, um sich präzise und sicher in der dynamischen Welt der Finanzmärkte zu bewegen. Dieser innovat

MT4-Version: https://www.mql5.com/en/market/product/157679 MT5-Version: https://www.mql5.com/en/market/product/157680
Support & Resistance – Intelligente Marktstruktur-Levels
Ein übersichtlicher, intelligenter und hochzuverlässiger Support- und Resistance-Indikator, entwickelt für professionelle Trader und automatisierte Systeme.
Support & Resistance erkennt mithilfe eines fortschrittlichen Clustering-Algorithmus, der Fraktale, ATR-basierte Preissegmentierung und Multi-Timeframe-Analyse komb
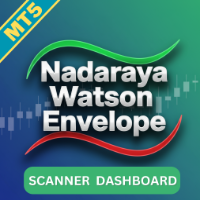
Nadaraya Watson Envelope Multicurrency Scanner MT5 bietet eine optimierte Möglichkeit, entscheidende Umkehrsignale über mehrere Währungspaare und Zeitrahmen hinweg zu überwachen. Basierend auf dem beliebten TradingView-Indikator, der für seine präzisen Umkehrsignale bekannt ist, passt dieser Scanner die gleiche Kernlogik in ein MT5-kompatibles Format an. Er konzentriert sich auf kurzfristige Chancen in niedrigeren Zeitrahmen und starke Trend-Signale in höheren Zeitrahmen, um Trader bei Marktumke

Visueller Stil der VWAP-Bänder 1.0 Finanzmarktindikatoren sind wesentliche Instrumente, die von Händlern und Anlegern verwendet werden, um die Finanzmärkte zu analysieren und Entscheidungen zu treffen. VWAP und Bollinger Bands sind zwei beliebte technische Analysetools, die von Händlern verwendet werden, um Markttrends und Preisvolatilität zu messen. In diesem Produkt schlagen wir vor, die beiden Indikatoren zu kombinieren, um ein einzigartiges Produkt zu schaffen, das eine umfassende Analyse v
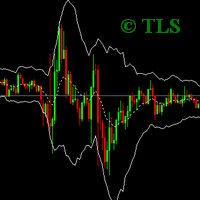
Erweiterte Version der Anzeige "Keltner Channel". Dies ist ein Analysetool, mit dem Sie das Verhältnis der Kursposition im Verhältnis zu ihrer Volatilität bestimmen können. Sie können 26 Arten von gleitenden Durchschnitten und 11 Preisoptionen verwenden, um die Mittellinie des Indikators zu berechnen. Konfigurierbare Benachrichtigungen benachrichtigen Sie, wenn der Preis die obere oder untere Grenze des Kanals berührt. Verfügbare Durchschnittstypen: Simple Moving Average, Exponential Moving Aver
Erhöhen Sie Ihre Trading-Strategie mit dem Keltner Channel Indicator MT5 , einem zeitlosen Volatilitätswerkzeug, inspiriert von Chester Keltner's Innovationen der 1960er Jahre, das exponentielle gleitende Durchschnitte mit dem Average True Range (ATR) kombiniert, um dynamische Preisspannen zu schaffen. Seit seiner Wiederbelebung im digitalen Zeitalter in Trading-Kreisen gefeiert, hat dieser Indikator auf Plattformen wie TradingView und MQL5 an Popularität gewonnen, da er zuverlässig Breakouts

MinMax Levels – ist ein Indikator für die Höchst-, Tiefst- und Eröffnungspreisniveaus für wichtige Handelsperioden: Tag, Woche und Monat.
Jeder Forex-Marktteilnehmer verwendet Level in seinem Handelssystem. Sie können entweder das Hauptsignal für die Durchführung von Transaktionen sein oder ein zusätzliches Signal, das als Analyseinstrument fungiert. In diesem Indikator wurden Tage, Wochen und Monate als wichtige Zeiträume ausgewählt, da sie die wichtigsten Handelszeiträume großer Marktteiln
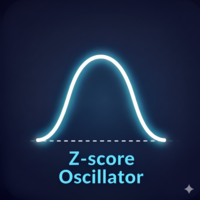
Haven ZScore Oszillator ist ein leistungsstarker statistischer Oszillator, der entwickelt wurde, um anomale Preisabweichungen von seinem Mittelwert zu erkennen. Der Indikator folgt nicht nur dem Preis, sondern misst, wie statistisch signifikant der aktuelle Preis ist, was es ermöglicht, überkaufte/überverkaufte Zonen mit hoher Präzision zu definieren und potenzielle Trendwendepunkte zu finden. Dieses Tool wird zu einem unverzichtbaren Helfer für Händler, die einen datengesteuerten Ansatz bevorzu
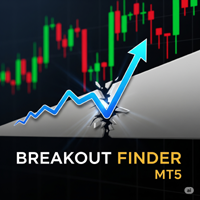
Der "Breakout Finder" ist ein technischer Indikator, der dazu dient, potenzielle Kursausbrüche und -durchbrüche auf einem Chart automatisch zu erkennen. Der Clou dieses Indikators ist sein robustes Signalfiltersystem, das Händlern hilft, falsche Signale (Fakeouts) zu vermeiden und sich auf Handelsmöglichkeiten mit höherer Wahrscheinlichkeit zu konzentrieren. Hauptmerkmale Automatische Pivot-Punkt-Erkennung: Der Indikator identifiziert automatisch signifikante Pivot-Hochs und -Tiefs auf dem Chart
FREE

Erhöhen Sie Ihre Trading-Strategie mit dem Schaff Trend Cycle Alert MT5 , einem leistungsstarken Oszillator, der MACD- und Stochastic-Elemente mischt, um geglättete, zuverlässige Trend-Signale mit minimalem Lag zu liefern. Von Doug Schaff Ende der 1990er entwickelt und auf Plattformen wie TradingView und MQL5 popularisiert, ist dieser Indikator seit den 2010er Jahren ein Favorit für Trader, da er Zyklus-Tops und -Bottoms früher als traditionelle Oszillatoren erkennt. Nicht-neumalend und anpass

Im Finanzwesen sind Z-Scores ein Maß für die Variabilität einer Beobachtung und können von Händlern verwendet werden, um die Marktvolatilität zu bestimmen. Z-Scores sagen Händlern, ob ein Score für einen bestimmten Datensatz typisch oder atypisch ist. Z-Scores ermöglichen es Analysten auch, Scores aus mehreren Datensätzen anzupassen, um Scores zu erstellen, die genauer miteinander verglichen werden können. # In der Praxis haben wir den ZScore mit Nullpunkt und Oszillationen zwischen 2 und 3 für
Dieser Indikator ist die mql5 Version des SSLHybrid Indikators . MT4-Version Erfahren Sie hier mehr: https: //www.mql5.com/en/users/rashedsamir/seller
Beschreibung der TradingView-Version: Dieses Skript wurde für die NNFX-Methode entwickelt, daher wird es nur für Daily-Charts empfohlen.
Versucht, einige VP NNFX-Regeln zu implementieren
Dieses Skript hat eine SSL / Baseline (Sie können zwischen SSL oder MA wählen), eine zweite SSL für Fortsetzungsgeschäfte und eine dritte SSL für Ausstiegsgesch

Neural-Link-Muster-Scanner: Erweiterte Candlestick-Erkennung für MetaTrader 5 Der Neural-Link Pattern Scanner ist ein professionelles Tool für die technische Analyse, das für die MetaTrader 5-Plattform entwickelt wurde. Es automatisiert die Erkennung von Candlestick-Mustern mit hoher Wahrscheinlichkeit und liefert visuelle Kennzeichnungen in Echtzeit direkt auf der Handelsoberfläche. Durch die Filterung nach bestimmten mathematischen Preisstrukturen hilft dieser Indikator Händlern, potenzielle U
FREE

Dies ist der ADX von Wilder mit der Wolkendarstellung der DI+ & DI- Linien. Merkmale
4 Standardlinien des ADX-Indikators: DI+, DI-, ADX, ADXR Wolkendarstellung der DI+/DI- Linien mit transparenten Farben anwendbar auf alle Zeitrahmen und alle Märkte
Was ist ADX
J. Welles Wilder Jr., der Entwickler bekannter Indikatoren wie RSI, ATR und Parabolic SAR, war der Meinung, dass das Directional Movement System, das teilweise im ADX-Indikator implementiert ist, seine zufriedenstellendste Leistung war. I
FREE
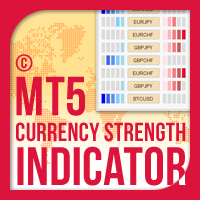
Currency Strength Indicator for MT5 ist eine innovative Lösung für jeden Anfänger oder erfahrenen Trader! Es hebt das Konzept der Währungsstärke auf eine ganz neue Ebene, da es es mit Price Action kombiniert und auf jedes Symbol/Paar angewendet werden kann, abgesehen von den üblichen 28 Kombinationen der 8 Hauptwährungen. Das bedeutet, dass Sie die Stärke oder Schwäche jedes Paares handeln können, einschließlich aller Währungen, Haupt-, Neben- und Exoten, Rohstoffe und Kryptos (keine Indizes)

NeoBull Predictive Ranges ist ein umfassendes technisches Analysesystem für den MetaTrader 5. Der Indikator kombiniert fortschrittliche Volatilitätsberechnungen mit einer volumenbasierten Trendanalyse. Das Ziel dieses Systems ist es, Tradern präzise Informationen über die Marktstruktur und den Orderflow zu liefern, ohne das Chartbild zu überladen. Dieses professionelle Werkzeug wird der Community kostenlos zur Verfügung gestellt. Konzept und Hintergrund Die strategische Grundlage und die Kombina
FREE

Der Indikator verwendet mehrere Zeitrahmen, um die besten Kaufeinträge im Boom 1000 zu ermitteln. Er ist darauf zugeschnitten, den Handel nur bei Boom-Spitzen zu unterstützen. der Indikator hat zwei Pfeile; rote und blaue. Die Bildung des roten Pfeils zeigt an, dass Sie auf einen blauen Pfeil vorbereitet sein sollten, der ein Kauf-Einstiegssignal darstellt. Der Indikator bietet keine Ausstiegspunkte. Sammeln Sie immer 3 Pips, d. h. wenn Sie einen Trade bei 10230,200 eingegangen sind, können Sie
FREE
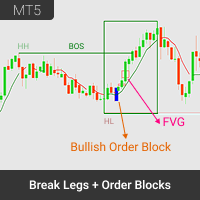
Übersicht Break Legs and Order Block Finder ist ein hochentwickelter Marktstruktur-Indikator für MetaTrader 5, konzipiert für Smart Money Trader, strukturorientierte Trader und institutionelle Handelsstrategien. Der Indikator hebt automatisch entscheidende Marktbewegungen hervor – von Break of Structure (BOS) und Market Structure Shift (MSS) bis hin zu Fair Value Gaps (FVGs) und Order Blocks (OBs) – direkt auf Ihrem Chart. Entwickelt für professionelle und anspruchsvolle Retail-Trader liefert di

Mehrwährungs- und Mehrzeitrahmen-Modifikation des Indikators Moving Average (MA). Auf dem Dashboard können Sie den aktuellen Status des Indikators sehen – Ausbrüche und Berührungen (nach Preis) des Fast MA und Slow MA sowie die Schnittpunkte der MA-Linien untereinander (Moving Average Crossover). In den Parametern können Sie beliebige Währungen und Zeitrahmen angeben. Außerdem kann der Indikator Benachrichtigungen über den Preis senden, der die Linien berührt, und über deren Kreuzung. Durch Kli

Price Direction Indicator Der Price Direction Indicator wurde entwickelt, um eine zentrale Frage objektiv zu beantworten:
Wo befindet sich der Markt im aktuellen Preisgefüge – günstig, neutral oder teuer? Statt Signale, Pfeile oder subjektive Markierungen zu erzeugen, übersetzt der PDI das aktuelle Marktverhalten in eine klar skalierte Richtungsbewertung von 0 bis 10.
Das Ergebnis ist eine ruhige, reproduzierbare Einschätzung der Marktlage, unabhängig von Emotionen oder kurzfristigem Rauschen. D

Haven VWAP Oscillator - Professioneller Umkehr-Finder Wir präsentieren den Haven VWAP Oscillator – ein fortschrittliches Analysetool, das die Kraft des Volumens (VWAP) mit statistischer Präzision (Z-Score) kombiniert. Seine Hauptaufgabe besteht darin, mathematisch begründete Marktumkehrpunkte zu finden und falsche Signale durch eine intelligente Trendlogik zu filtern. Sehen Sie sich meine anderen Produkte an -> HIER (KLICKEN) . Der Handel gegen die Masse erfordert Präzision. Die meisten Os

Willkommen beim EPo-CreW Forex Super ORB-H4 Indikator!
Diese Anleitung zeigt Ihnen, wie Sie dieses leistungsstarke Tool nutzen können, um Handelschancen mit hoher Wahrscheinlichkeit zu identifizieren – basierend auf der ersten 4-Stunden-Eröffnungsrange des Marktes.
Egal, ob Sie Anfänger oder erfahrener Trader sind, dieses System hilft Ihnen, mit mehr Vertrauen und Konstanz zu handeln. DIES IST EIN DEMO-PRODUKT. ES LÄUFT 30 TAGE NACH DEM INSTALLATIONSDATUM AB. Volle Version hier verfügbar : https
FREE

GUARDIAN: Der ultimative Trend- und Sicherheitsindikator GUARDIAN ist ein hochentwickeltes technisches Analysetool, das für Händler entwickelt wurde, die Wert auf Präzision und Kapitalerhalt legen. Dieser Indikator fungiert als wachsamer Beschützer Ihrer Trades, filtert Marktgeräusche heraus und identifiziert hochwahrscheinliche Trendumkehrungen mit einer Genauigkeit, die institutionellen Ansprüchen genügt. Hauptmerkmale: Adaptive Trend-Erkennung: Nutzt fortschrittliche Algorithmen, um Marktvers
FREE

Für MT4
Der MACD Histogramm Indikator ist eine verbesserte Version des traditionellen MACD-Indikators, die eine überlegene Einsicht in Markttrends und Momentumänderungen bietet. Im Gegensatz zum standardmäßigen MACD in MT5, enthält diese Version ein Histogramm , das die Visualisierung und Interpretation der Marktbedingungen erleichtert. Vorteile gegenüber dem standardmäßigen MACD-Indikator: Verbesserte Visualisierung: Das Histogramm bietet eine Balkendarstellung der Differenz zwischen der MACD-

Quantum Profile System ist ein vollwertiges professionelles Handelssystem mit fortschrittlichen Algorithmen, das alles vereint, was für einen sicheren und stabilen Handel erforderlich ist. Dieser Indikator vereint die Analyse der Trendrichtung, die Konzentration des Volumens auf Schlüsselebenen, die dynamische Anpassung an die Marktvolatilität und die Generierung von Handelssignalen ohne Verzögerung oder Neulackierung. Quantum Profile System integriert ein Linear Regression Volume Profile mit ei

INDICATOR: GEN Zenith Entwickler: gedeegi Allgemeine Beschreibung GEN Zenith ist ein technischer Indikator zur automatischen Erkennung von Preisumkehrmustern (Zenith) auf der Grundlage der Erkennung von Pivotpreisen und Delta-Volumenbewegungen. Dieser Indikator sucht nach Punkten, an denen der Preis ein Swing-Hoch oder Swing-Tief bildet, und erkennt dann einen Ausbruch aus diesem Bereich, um ein starkes Umkehrsignal zu bestätigen. Dieser Indikator eignet sich hervorragend für Umkehr- und Ausbru
FREE

Der Anchored VWAP Indicator für MetaTrader 5 gibt Ihnen die volle Kontrolle darüber, wo Ihr VWAP beginnt. Anstatt an Sitzungseröffnungen oder feste Zeiten gebunden zu sein,
ziehen Sie einfach den Ankerpunkt auf dem Diagramm , und der VWAP wird sofort von genau diesem Balken neu berechnet.
Dies macht es perfekt für die Analyse:
- Institutionelle Einstiegszonen
- Ausbrüche
- Hochs/Tiefs
- Reaktionspunkte auf Nachrichten
- Trendfortsetzungen Hauptmerkmale Drag & Drop Anchor Point: Verschieben Sie
FREE
Meine anderen Indikatoren: h ttps:// www.mql5.com/en/market/product/156702 https://www.mql5.com/en/market/product/153968 (KOSTENLOS) https://www.mql5.com/en/market/product/153960 (KOSTENLOS)
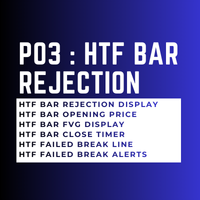
Dieser Indikator zeigt Kerzen mit höherem Zeitrahmen direkt auf Ihrem Chart mit niedrigerem Zeitrahmen an. Er ermöglicht es Ihnen, die Kursentwicklung in einem höheren Zeitrahmen zu beobachten, ohne zwischen den Charts wechseln zu müssen. Was dieser Indikator tut: Der Indikator platziert Kerzen eines ausgew
FREE

SMC LIQUIDITY Fortgeschrittene Smart Money- und Liquiditätsanalyse-Suite für MT5 in institutioneller Qualität SMC LIQUIDITY ist ein umfassendes institutionelles Toolkit, das für Händler entwickelt wurde, die ein präzises Liquiditäts-Mapping, Marktstruktur-Intelligenz, Smart Money-Konzepte und Orderflow-Bewusstsein in einer einzigen integrierten Schnittstelle benötigen. Es wurde für professionelle Arbeitsabläufe, Multi-Timeframe-Klarheit und nahtlose Ausführung unter schnelllebigen Bedingungen en
FREE

[Power Volume Candle] - Indikator, um den Vergleich von bullish und bearish Volumen zu sehen
Volumenvergleichsindikator auf Candlestick, durch Berechnung des Volumenwertes der angegebenen Kerzenhistorie, um den Prozentsatz der Volumenstärke zu bestimmen. Berechnet den prozentualen Vergleich jedes auf 1 Bildschirm angezeigten Zeitrahmens. Abonnieren Sie den MQL5-Kanal für weitere interessante Informationen : (Automatic) Forex Tools Treten Sie der neuen öffentlichen Gruppe bei, um Ihre Meinungen a
FREE

Sehen Sie sich meinen TRADE PLANNER MT5 an - dringend empfohlen, um Kontoszenarien zu antizipieren, bevor Sie Geld riskieren. Sie erhalten einen professionellen gleitenden Durchschnittsindikator mit mehreren verfügbaren Berechnungsmethoden, darunter exponentielle, lineare, geglättete und linear gewichtete Ansätze. Der Indikator wurde für geglättete Heikin Ashi-Kerzen entwickelt, die im Ordner "Beispiele" von Meta Trader 5 enthalten sind. Durch die Anwendung dieses Tools können Händler unerwünsc
FREE

Smart Session Box Zeigt die Handelssitzungen in Asien, London und New York mit automatischer Zeitzonenanpassung und Hervorhebung von Sitzungsüberschneidungen an. Wichtigste Merkmale Vollständige Sitzungsanalyse ohne Einschränkungen. Hauptmerkmale Der Indikator zeichnet Session-Boxen mit Hoch- und Tiefstkursen für jede Handelssitzung. Sitzungsüberschneidungen werden mit unterschiedlichen Farben hervorgehoben, um Perioden mit hoher Liquidität zu identifizieren. Ausbruchswarnungen benachrichtigen S
FREE

Dies ist eine Multi-Timeframe-Version des Supply and Demand-Indikators . Er ermöglicht es Ihnen, ein Diagramm anhand des Gesetzes von Angebot und Nachfrage auf drei verschiedenen Zeitrahmen gleichzeitig zu analysieren. Sie werden Zonen von Käufen und Verkäufen sehen und die profitabelsten Punkte für die Eröffnung von Positionen bestimmen. Der Indikator basiert auf dem Prinzip der Marktfraktalität. Die Angebots- und Nachfragezonen zeigen die Stellen an, an denen ein starker Käufer oder Verkäufer
FREE

Der Weis Wave Scouter Basic ist die essenzielle Version unseres renommierten Indikators für MetaTrader 5, entwickelt für Trader, die die Konzepte der Wyckoff-Methode und der VSA-Analyse (Volume Spread Analysis) auf zugängliche und effiziente Weise erkunden möchten. Basierend auf der Analyse von Volumenwellen ermöglicht dieser vereinfachte Indikator eine klare Erkennung von Marktbewegungen, wobei der Schwerpunkt auf den Prinzipien Aufwand vs Ergebnis sowie Angebot und Nachfrage liegt, wie von Ric
FREE

TG MTF MA MT5 wurde entwickelt, um einen gleitenden Durchschnitt (MA) mit mehreren Zeitfenstern auf jedem Chart-Zeitfenster anzuzeigen, wobei die Benutzer die MA-Werte eines bestimmten Zeitfensters über alle Zeitfenster hinweg angeben und anzeigen können. Diese Funktionalität ermöglicht es den Benutzern, sich auf den gleitenden Durchschnitt eines bestimmten Zeitrahmens zu konzentrieren, ohne den Chart wechseln zu müssen. Durch die Isolierung der gleitenden Durchschnittswerte eines bestimmten Zei
FREE
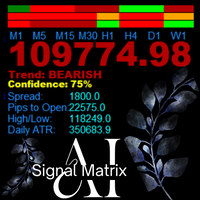
AanIsnaini Signal Matrix MT5 Multi-Timeframe-Vertrauenssignal Dashboard Die kostenlose Version von AanIsnaini Signal Matrix MT5 Pro AanIsnaini Signal Matrix MT5 ist ein leistungsstarker All-in-One-Indikator, der die Marktrichtung und das Vertrauensniveau über mehrere Zeitrahmen hinweg analysiert und es Händlern ermöglicht, die allgemeine Tendenz des Marktes auf einen Blick zu erkennen. Der Indikator kombiniert Signale von Price Action , Support-Resistance und mehreren bewährten technischen Tool
FREE

Einführung Der "Ultimate Retest"-Indikator stellt die Spitze der technischen Analyse dar, die speziell für Händler von Unterstützung/Widerstand oder Angebot/Nachfrage entwickelt wurde. Durch die Verwendung fortschrittlicher mathematischer Berechnungen kann dieser Indikator schnell und genau die stärksten Unterstützungs- und Widerstandsniveaus identifizieren, auf denen die großen Akteure ihre großen Orders platzieren, und den Händlern die Chance geben, mit einem tadellosen Timing in den Retest de
FREE
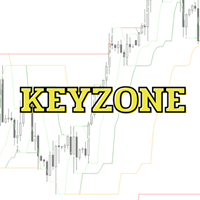
Keyzone ist ein Indikator, der entwickelt wurde, um Unterstützungs- und Widerstandsniveaus zu identifizieren. Diese sind in vier Hauptstufen unterteilt: 3, 8, 21 und 89 . Diese Niveaus basieren auf einer fortgeschrittenen Anpassung des Smart Money Concept (SMC) und bieten eine hohe Effizienz bei einfacher Anwendung. Dank seines minimalistischen und dennoch leistungsstarken Designs kann Keyzone in verschiedenen Handelsstilen eingesetzt werden, darunter:
Scalping – Schnelle, hochfrequente Trades S
FREE

Dieser Indikator ist speziell für den Boom 1000 Index entwickelt worden. Der Indikator enthält optimierte Trendfilter, um Kaufspitzen in einem Aufwärtstrend zu erkennen. Der Indikator fügt außerdem ein Raster-Kaufsignal hinzu, um einen Teil des Verlustes des ersten Kaufsignals wieder aufzuholen. Der Indikator liefert auch Ausstiegssignale für verzögerte Spikes, die beim Risikomanagement helfen können, analysiert Signale für historische Daten und zeigt den Prozentsatz der guten Signale an, die d
FREE

Dieser Indikator basiert auf dem Zickzack... Hinzugefügt: 1. 1. zusätzliche Pfeile, um das Diagramm deutlicher zu machen. 2) Preisanzeige hinzugefügt, so dass Sie den Preis besser sehen können. 3) Alarm-Einstellungen hinzugefügt, und kann das Senden von E-Mails unterstützen. Merkmale des ursprünglichen Indikators. 1) Grundlegende Konfiguration des Wellenindikators. 2. die letzten 2 ZIGZAG Punkte haben keine Stabilität, mit dem Markt und ändern, (das heißt, sagte der Benutzer die Zukunft Funktion
FREE

** Alle Symbole x Alle Zeitrahmen scannen durch einfaches Drücken der Scannertaste ** *** Kontaktieren Sie mich, damit ich Ihnen eine Anleitung schicken und Sie in die "Head & Shoulders Scanner Gruppe" aufnehmen kann, damit Sie Ihre Erfahrungen mit anderen Nutzern austauschen und sehen können. Einführung: Head and Shoulders Pattern ist ein sich sehr häufig wiederholender Typ von Preisumkehrmustern. Das Muster erscheint auf allen Zeitrahmen und kann von allen Arten von Tradern und Investoren verw
MetaTrader Market - Handelsroboter und technische Indikatoren stehen Ihnen direkt im Kundenterminal zur Verfügung.
Das MQL5.community Zahlungssystem wurde für die Services der MetaTrader Plattform entwickelt und steht allen registrierten Nutzern der MQL5.com Webseite zur Verfügung. Man kann Geldmittel durch WebMoney, PayPal und Bankkarten einzahlen und sich auszahlen lassen.
Sie verpassen Handelsmöglichkeiten:
- Freie Handelsapplikationen
- Über 8.000 Signale zum Kopieren
- Wirtschaftsnachrichten für die Lage an den Finanzmärkte
Registrierung
Einloggen
Wenn Sie kein Benutzerkonto haben, registrieren Sie sich
Erlauben Sie die Verwendung von Cookies, um sich auf der Website MQL5.com anzumelden.
Bitte aktivieren Sie die notwendige Einstellung in Ihrem Browser, da Sie sich sonst nicht einloggen können.