Guarda i video tutorial del Market su YouTube
Come acquistare un Robot di Trading o un indicatore
Esegui il tuo EA
hosting virtuale
hosting virtuale
Prova un indicatore/robot di trading prima di acquistarlo
Vuoi guadagnare nel Market?
Come presentare un prodotto per venderlo con successo
Indicatori tecnici per MetaTrader 4 - 5
Indicatore di Spostamento della Struttura del Mercato e Gap di Valore Equo (FVG) per MT4 Questo indicatore per MT4 identifica spostamenti nella struttura del mercato e gap di valore equo (FVG), fornendo ai trader potenziali opportunità di trading. Avvisa gli utenti di questi eventi tramite notifiche mobili, consentendo loro di reagire rapidamente alle mutevoli condizioni di mercato. Caratteristiche principali: Rilevamento dello Spostamento della Struttura del Mercato: Identifica spostamenti ria
FREE

Currency Power Meter shows the power of major currencies against each other. The indicator shows the relative strength of currency/pair at the current moment in a period of time (H4, daily, weekly, monthly). It is useful for day traders, swing traders and position traders with suitable period options. Currency power is the true reason of market trend: The strongest currency against the weakest currency will combine into a most trending pair. As we know, trend makes money and all traders love tre

Scalpers Zone – Indicatore definitivo di Supply/Demand + Rifiuto Stocastico & Triple Touch Scalpers Zone è progettato per trader che cercano ingressi a scalp ad alta probabilità. Rileva le zone di supply/demand giornaliere e settimanali (7 giorni) e mette in evidenza le aree in cui queste zone si allineano perfettamente, segnando i punti di inversione più forti. Per asset volatili come criptovalute e oro, lo spessore delle zone può essere aumentato per una migliore visibilità e precisione. Carat
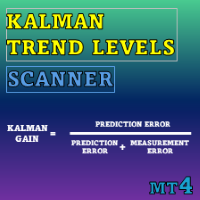
Special offer : ALL TOOLS , just $35 each! New tools will be $30 for the first week or the first 3 purchases ! Trading Tools Channel on MQL5 : Join my MQL5 channel to update the latest news from me Kalman Trend Levels è un indicatore avanzato di follow-up delle tendenze che utilizza la tecnologia all'avanguardia dei filtri di Kalman per fornire ai trader segnali analitici potenti. Progettato per precisione e adattabilità, questo strumento non solo identifica zone critiche di suppor
The We-Spread mt4 indicator is a spread trading tools and it is suitable for those who want to study the markets with a different approach to the contents that are normally available in online trading bookstores. I think the Spread Trading strategy is one of the best I've ever used in the last few years. This is a unique indicator for spread trading because allow you to study till 3 spreads in one time. What is Spread Trading on forex The Spread Trading is the study of the strength of 2 currency

VWAP Ultimate Pro MT4 – Anchored VWAP | Session VWAP | Dynamic Bands & Smart Alerts Bring Institutional‑Grade VWAP Precision to the Classic MetaTrader 4 Platform
WHY TRADERS CHOOSE VWAP ULTIMATE PRO MT4?
VWAP (Volume‑Weighted Average Price) is the benchmark used by banks, prop desks, and hedge funds to gauge fair value. VWAP Ultimate Pro MT4 delivers that same power to retail traders, optimised for MT4’s architecture while preserving every professional feature you expect. This Indicator is cu

Gold Trend - è un buon indicatore tecnico azionario. L'algoritmo dell'indicatore analizza il movimento del prezzo di un asset e riflette la volatilità e le potenziali zone di ingresso.
I migliori segnali dell'indicatore:
- Per VENDERE = istogramma rosso + puntatore SHORT rosso + freccia di segnale gialla nella stessa direzione + freccia rossa di direzione del trend. - Per l'ACQUISTO = istogramma blu + puntatore LONG blu + freccia di segnale acquatica nella stessa direzione + freccia blu di
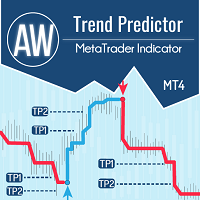
La combinazione di trend e livelli di rottura in un unico sistema. Un algoritmo di indicatore avanzato filtra il rumore del mercato, determina la tendenza, i punti di ingresso e i possibili livelli di uscita. I segnali indicatori sono registrati in un modulo statistico, che permette di selezionare gli strumenti più adatti, mostrando l'efficacia dello storico dei segnali. L'indicatore calcola i segni Take Profit e Stop Loss. Manuale e istruzioni -> Qui / Versione MT5 -> Qui Come fare tradi

AlphaTrend Pro - Enhanced Visual Trend Detection Indicator Product Title AlphaTrend Pro - Advanced Trend Detection with Crystal-Clear Visual Signals Brief Description AlphaTrend Pro is a sophisticated trend-following indicator that combines volatility analysis (ATR) with momentum oscillators (RSI/MFI) to create dynamic support and resistance levels. Enhanced with large directional arrows and smart visual positioning, this professional MT4 indicator provides unmistakable buy/sell signals that ada

Presentazione di Parabolic Predictor Dashboard , un avanzato indicatore di dashboard multisimbolo, multitimeframe e non riverniciabile basato sul popolare indicatore parabolico. Filtra i segnali parabolici tradizionali per identificare la tendenza esatta e prevedere i livelli di ingresso e uscita dal mercato.
Questo indicatore non è solo un cruscotto. Con un clic sul simbolo, puoi vedere la direzione del trend, i livelli di entrata accurati e i livelli di take profit su una nuova finestra

IL Candle Power Pro è uno strumento di trading sofisticato progettato per decodificare pressione del volume reale, squilibri dei dati tick e dinamiche del flusso degli ordini istituzionali misurando il battaglia tra zecche tori e zecche orsi in tempo reale. Questo indicatore trasforma i dati grezzi dati di volume in informazioni fruibili , aiutando i trader a identificare Movimenti di denaro intelligente, caccia alla liquidità e psicologia nasco

The indicator automatically identifies the 1-2-3 pattern on the chart. The indicator is able to monitor the formation of pattern in real time. It informs the trader when the pattern is completely formed (when the price breaks the line in point 2) and displays the completed patterns in history. The patterns are never redrawn. The indicator can identify patterns on any instruments (currency pairs, stock market, gold, etc.) without the need to adjust to each instrument. Simple and clear visualizati

"Ppr PA" is a unique technical indicator created to identify "PPR" patterns on the currency charts of the MT4 trading platform. These patterns can indicate possible reversals or continuation of the trend, providing traders with valuable signals to enter the market.
Features: Automatic PPR Detection: The indicator automatically identifies and marks PPR patterns with arrows on the chart. Visual Signals: Green and red arrows indicate the optimal points for buying and selling, respectively. Ar
FREE
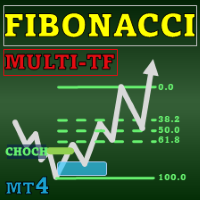
Special offer : ALL TOOLS , just $35 each! New tools will be $30 for the first week or the first 3 purchases ! Trading Tools Channel on MQL5 : Join my MQL5 channel to update the latest news from me Il Fibonacci Confluence Toolkit Multi-Timeframe è uno strumento avanzato di analisi tecnica progettato per trader professionisti, che aiuta a identificare potenziali zone di inversione del prezzo combinando segnali e modelli chiave del mercato. Con capacità di visualizzazione multi-timef

Wave Reversal Indicator - determina la direzione e le inversioni di prezzo attorno alla linea di equilibrio.
L'indicatore mostra i movimenti delle onde e i picchi di tendenza. Dà consigli su dove seguire il trader, aiuta a seguire la strategia di trading.
È un'aggiunta a una strategia intraday o a medio termine.
Quasi tutti i parametri vengono selezionati per ciascun intervallo di tempo e cambiano automaticamente; l'unico parametro per la regolazione manuale è la lunghezza d'onda.
Tempi ottimal
FREE
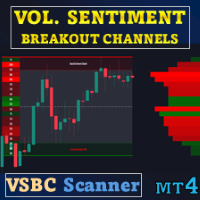
Offerta speciale : ALL TOOLS , solo $35 ciascuno. I nuovi strumenti saranno a $30 per la prima settimana oppure per i primi 3 acquisti ! Trading Tools Channel on MQL5 : unisciti al mio canale MQL5 per ricevere tutti i miei aggiornamenti Volume Sentiment Breakout Channels è un indicatore che visualizza le zone di breakout basate sul sentiment del volume all’interno di canali di prezzo dinamici. Invece di considerare il breakout come un semplice evento tecnico di prezzo, si concent

Place price Alerts on extended Rectangles and Trendlines - Risk reward indicator MT4 Extend Rectangles & Trendlines to the right edge Mark your supply demand zones with extended rectangle and draw support resistance lines with extended trendline. Find detailed manuals here . Find contacts on my profile . MT4 Rectangle extender indicator will simplify and make it easier for you to analyze markets and stay notified about important events. When you extend rectangle or trendline the action butto

Multi-currency and multitimeframe Heikin Ashi indicator. Shows the current state of the market. On the scanner panel you can see the direction, strength and number of bars of the current trend. The Consolidation/Reversal candles are also shown using color. You can specify any desired currencies and periods in the parameters. Also, the indicator can send notifications when the trend changes or when reversal and consolidation candles (dojis) appear. By clicking on a cell, this symbol and period wi

The Smart Liquidity Profile is color-coded based on the importance of the traded activity at specific price levels, allowing traders to identify significant price levels such as support and resistance levels, supply and demand zones, liquidity gaps, consolidation zones, Buy-Side/Sell-Side Liquidity and so on. Smart Liquidity Profile allows users to choose from a number of different time periods including 'Auto,' 'Fixed Range,' 'Swing High,' 'Swing Low,' 'Session,' 'Day,' 'Week,' 'Month,' 'Quar

The Reversal Master is an indicator for determining the current direction of price movement and reversal points. The indicator will be useful for those who want to see the current market situation better. The indicator can be used as an add-on for ready-made trading systems, or as an independent tool, or to develop your own trading systems. The Reversal Master indicator, to determine the reversal points, analyzes a lot of conditions since the combined analysis gives a more accurate picture of t

MACD indicator in MetaTrader 4/5 looks different than MACD does in most other charting software. That is because the MetaTrader 4/5 version of MACD displays the MACD line as a histogram when it is traditionally displayed as a line. Additionally, the MetaTrader 4/5 version computes the Signal line using an SMA, while according to MACD definition it is supposed to be an EMA. The MetaTrader 4/5 version also does not compute a true MACD Histogram (the difference between the MACD/Signal lines). This
FREE

The SuperTrend AI indicator is a novel take on bridging the gap between the K-means clustering machine learning method & technical indicators. In this case, we apply K-Means clustering to the famous SuperTrend indicator. USAGE Users can interpret the SuperTrend AI trailing stop similarly to the regular SuperTrend indicator. Using higher minimum/maximum factors will return longer-term signals. (image 1) The displayed performance metrics displayed on each signal allow for a deeper interpretat

Auto Fibo è un indicatore sviluppato per migliorare il vostro trading manuale. Disegna automaticamente il rapporto aureo, facendovi risparmiare tempo e facilitando il vostro trading. Collegando l'indicatore al grafico, questo disegnerà automaticamente l'esatto rapporto aureo, risparmiandovi la fatica di trovare il punto critico. L'interfaccia si regola in base al computer e indica i punti alti e bassi approssimativi della banda. Questo indicatore corregge la maggior parte degli errori di selezi
FREE

The latest version of Indicator is fully integrated into an all-in-one package, including: Fair Value Gaps (FVG). Implied Fair Value Gap (IFVG). OrderBlock (OB). The options in the settings section are relatively easy to navigate, and you can even use them right away upon activation without encountering difficulties when using the default configuration. The indicator utilizes an algorithm to automatically draw and identify Order Blocks (OB), Fair Value Gaps (FVGs), and Implied Fair Value Gap

Trading doesn’t have to be complicated. With the right visual guidance, market decisions become clearer, calmer, and more confident.
Nebula Arrow is designed to help traders focus on what truly matters: high-quality entries based on refined market behavior. Just load it on your chart and let the arrows guide your trading decisions. Trade With Confidence We believe that simplicity is power. Nebula Arrow was created after extensive market observation and practical research, transforming complex
FREE

ISTRUZIONI RUS / ISTRUZIONI ENG / Versione MT5 Funzioni principali: Visualizza le zone attive di venditori e acquirenti! L'indicatore mostra tutti i livelli/zone di primo impulso corretti per acquisti e vendite. Quando questi livelli/zone vengono attivati, ovvero dove inizia la ricerca dei punti di ingresso, i livelli cambiano colore e vengono riempiti con colori specifici. Vengono visualizzate anche delle frecce per una percezione più intuitiva della situazione. LOGIC AI - Visualizzazion

1.tendenze dei prezzi in un mercato libero che scorre. La base di questa strategia è che la quantità di strumenti disponibili e la domanda di strumenti da parte degli acquirenti determinano il prezzo. Segna sul grafico le aree in cui la domanda supera l'offerta (regioni della domanda), spingendo i prezzi verso l'alto, o dove l'offerta supera la domanda (regioni dell'offerta), spingendo i prezzi verso il basso. La maggior parte dei trader domanda e offerta aspettano che i prezzi entrino nelle are
FREE
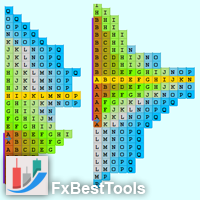
Definition : A Market Profile is an intra-day charting technique (price vertical, time/activity horizontal). Market Profile is best understood as a way to see order in the markets. Market Profile was a way for traders to get a better understanding of what was going on, without having to be on the trading floor. The current indicator is developed based on Easy-to-Use architecture including a wide range of visual settings.
Major Features of Indicator : Various Views of Market Profile The indicat

The indicator analyzes the volume scale and splits it into two components - seller volumes and buyer volumes, and also calculates the delta and cumulative delta. The indicator does not flicker or redraw, its calculation and plotting are performed fairly quickly, while using the data from the smaller (relative to the current) periods. The indicator operation modes can be switched using the Mode input variable: Buy - display only the buyer volumes. Sell - display only the seller volumes. BuySell -
FREE

This is MT4 version of StochScanner It scans Stochastic from Multi Symbols and Multi Timeframes and displayed on the dashboard on a single chart. . 4 scanning modes: 1. Mode OverBought/OverSold Indicator scans Overbought and OverSold . OverBought : current stochastic is above level 80 and OverSold : current stochastic is below level 20 2. Mode Signal It means if the previous stochastic is on OverBought or OverSold ( either Main Line and Signal Line ) and the current Main Line cross over the curr

** All Symbols x All Timeframes scan just by pressing scanner button ** *** Contact me to send you instruction and add you in "All Divergences scanner group" for sharing or seeing experiences with other users. Introduction Divergence is a main technique used to determine trend reversing when it’s time to sell or buy because prices are likely to drop or pick in the charts. All Divergence indicator can help you locate the top and bottom of the market. This indicator finds Regular divergences for

Introduction to Fractal Pattern Scanner Fractal Indicator refers to the technical indicator that makes use of the fractal geometry found in the financial market. Fractal Pattern Scanner is the advanced Fractal Indicator that brings the latest trading technology after the extensive research and development work in the fractal geometry in the financial market. The most important feature in Fractal Pattern Scanner is the ability to measure the turning point probability as well as the trend probabi

"The trend is your friend" is one of the best known sayings in investing, because capturing large trendy price movements can be extremely profitable. However, trading with the trend is often easier said than done, because many indicators are based on price reversals not trends. These aren't very effective at identifying trendy periods, or predicting whether trends will continue. We developed the Trendiness Index to help address this problem by indicating the strength and direction of price trend

Vantaggi di questo indicatore: Strumento per il trading Smart Money Concepts (SMC) , focalizzato su fasi laterali (Range) e rotture (Breakout) con analisi volumetrica avanzata. Rilevamento Automatico del Range: Nessun disegno manuale: Traccia canali (Box) automaticamente durante le fasi laterali. Zone Chiave: Evidenzia Accumulazione e Distribuzione. Analisi Dettagliata del Volume: Analisi interna: Scompone il volume all'interno del range di prezzo. Acquisti vs Vendite: Mostra la pressione preval

Versione MT5 | Indicatore Trend Monitor VZ | Indicatore Owl Smart Levels | Strategia Owl Smart Levels | FAQ La teoria delle onde di Elliott è un'interpretazione dei processi nei mercati finanziari che si basa su un modello visivo delle onde nei grafici dei Prezzi. L'indicatore ZigZag Valable mostra la struttura delle onde del mercato su cui puoi fare affidamento per prendere decisioni di trading. L'indicatore ZigZag Valable è più stabile e spesso non cambia direzione come il classi
FREE

Multicurrency and multitimeframe modification of the Commodity Channel Index (CCI) indicator. You can specify any desired currencies and timeframes in the parameters. Also, the panel can send notifications when crossing overbought and oversold levels. By clicking on a cell with a period, this symbol and period will be opened. This is MTF Scanner. The key to hide the dashboard from the chart is "D" by default.
Parameters CCI Period — averaging period.
CCI Applied price — price type.
Clear the

Cruscotto TrendSeeker ― Filtro di mercato intelligente per operazioni ad alta probabilità Il cruscotto TrendSeeker è uno strumento di analisi di mercato multi-simbolo potente, progettato per evitare i mercati laterali e concentrarsi solo su strumenti di alta qualità con trend nel timeframe H4 . Il cruscotto scansiona continuamente tutti i simboli disponibili e classifica ogni coppia come segue: Trend rialzista (Trending UP) Trend ribassista (Trending DOWN) Mercato laterale / No-trade (Ranging /
FREE

The balance of supply and demand is a simple and effective market analysis method. The supply and demand diagram can show you in advance, even before the trend reversal, where the supply ends and the demand is already emerging, where the demand ends and the supply is emerging, while substantially increasing the probability of making a deal in the right direction and with a high profit factor.
Indicator Signals The indicator uses the price/volume values to generate signals: ED – excess demand. E
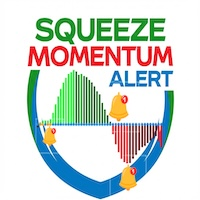
Squeeze Momentum Alert 1. Identifica i Punti di "Esplosione" del Prezzo (The "Squeeze") Il vantaggio principale è la capacità di catturare i momenti di "consolidamento" prima di un grande movimento. Perché è utile: Lo strumento ti dice: "Il grafico si sta comprimendo, preparati al prossimo scatto" , assicurandoti di non perdere l'inizio di un trend. 2. Distingue la "Forza" del Trend (Color Coded Momentum) L'istogramma usa 4 colori : Verde Lime (Lime): Rialzo forte. Verde Scuro (Dark Green): Rial
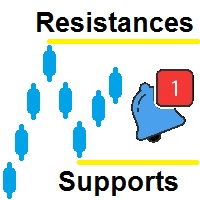
Supporti e resistenze, è stato creato per aiutarti a identificare automaticamente i massimi e i minimi su diversi intervalli di tempo diversi e quindi tracciare questi massimi e minimi sul grafico corrente. Andiamo alla spiegazione della creazione delle resistenze C'è un campo regola, che puoi definire cos'è un alto e un basso la regola superiore è impostata per impostazione predefinita in questo modo: H[ 0 ]<=H[ 1 ] and H[ 1 ]=>H[ 2 ]
Dove:
Elemento Descrizione H significa Alto
[0] signi
FREE

RSI divergence indicator finds divergences between price chart and RSI indicator and informs you with alerts (popup, mobile notification or email). Its main use is to find trend reversals in the chart. Always use the divergence indicators with other technical assets like support resistance zones, candlestick patterns and price action to have a higher possibility to find trend reversals. Three confirmation type for RSI divergences: RSI line cross 50 level (doesn't repaint) Price returns to
FREE
Multi Timeframe Buy and Sell Power MT4
The Multi Timeframe Buy and Sell Power indicator for MetaTrader 4 is a versatile tool designed to provide traders with a clear visual representation of market pressure across nine standard timeframes, from M1 to MN1. By aggregating buy and sell strength percentages derived from recent price action and tick volume, it helps identify potential trends, reversals, and neutral conditions in real-time. The indicator displays this information in a compact dashbo
FREE

The Ultimate Trading Companion: Smart Trend Tracer Tired of getting lost in market noise? Ready to find the clearest trends with pinpoint accuracy? Introducing Smart Trend Tracer , the ultimate tool designed to cut through the clutter and reveal the most profitable market swings. This isn't just another indicator; it's your personal guide to spotting trends as they form, giving you the confidence to make smarter trading decisions. Smart Trend Tracer identifies significant highs and lows on your
FREE

2 SNAKES è un sistema di scalping di prima classe.
Poiché gli inserimenti sono piuttosto precisi, è probabile che diventiate dipendenti da questo sistema molto rapidamente.
Avete 2 serpenti. Quando vedete una candela al di sopra o al di sotto di esse che non le tocca, questo è il vostro segnale di scalping.
Se si utilizza un time frame più ampio, lo scalping può diventare trend following. Le serpentine sono calcolate con precisione in relazione allo stato attuale del mercato. NON SONO me
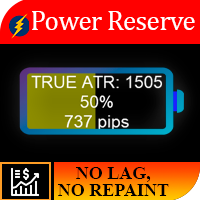
Logica di lavoro
L'importanza di questo indicatore risiede nel fatto che permette di capire quanto “carburante è rimasto sullo strumento”. Immagina la situazione, sei partito in un'auto con una batteria mezza scarica, in media questa quantità di energia è sufficiente per un'auto per 250 km, quindi se vuoi, non puoi superare una distanza di 700 km. Quindi, per ogni strumento, c'è un certo movimento di prezzo giornaliero e, come risultato di osservazioni statistiche, è stato rivelato che l'85% d
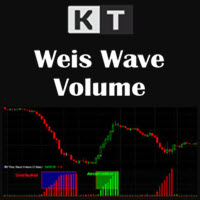
Il KT Weis Wave Volume è un indicatore tecnico basato sulla tendenza attuale del mercato e sulla direzione del movimento dei prezzi. L'indicatore si basa sul volume e mostra i volumi cumulativi degli aumenti e delle diminuzioni dei prezzi sul grafico.
Inoltre, la finestra dell'indicatore mostra un istogramma con onde verdi e onde rosse in aumento.
Il colore verde rappresenta un movimento al rialzo; più il prezzo sale, maggiore è il volume verde. Il colore rosso rappresenta un'onda in discesa;
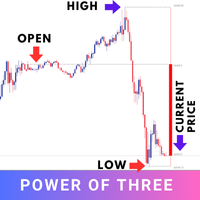
The "Power of Three" (PO3) is a concept developed by the Inner Circle Trader (ICT) to illustrate a three-stage approach used by smart money in the markets: Accumulation, Manipulation, and Distribution . ICT traders view this as a foundational pattern that can explain the formation of any candle on a price chart. In simple terms, this concept is effective for any time frame, as long as there's a defined start, highest point, lowest point, and end. MT5 - https://www.mql5.com/en/market/product/124
FREE
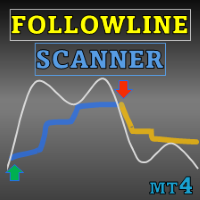
Special offer : ALL TOOLS , just $35 each! New tools will be $30 for the first week or the first 3 purchases ! Trading Tools Channel on MQL5 : Join my MQL5 channel to update the latest news from me Massimizza il tuo vantaggio nel trading con Follow Line con Scanner, un indicatore avanzato basato sulla volatilità progettato per trader seri. Questo strumento combina la potenza delle Bande di Bollinger con impostazioni personalizzabili, offrendo intuizioni precise sui movimenti dei pr
FREE

This indicators automatically draws the Trend Channels for you once you've dropped it on a chart. It reduces the hustle of drawing and redrawing these levels every time you analysis prices on a chart. With it, all you have to do is dropped it on a chart, adjust the settings to your liking and let the indicator do the rest. Get an alternative version of this indicator here: https://youtu.be/lt7Wn_bfjPE For more free stuff visit: https://abctrading.xyz
Parameters 1) Which trend do you want t
FREE
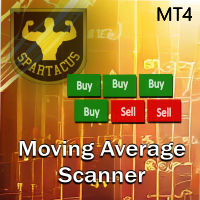
Moving Average Scanner è uno scanner multi-timeframe perfetto per vedere la tendenza su diversi intervalli di tempo a colpo d'occhio senza modificare il grafico.
Può utilizzare fino a 4 medie mobili a tua scelta su 9 unità di tempo. È completamente configurabile e può essere spostato in qualsiasi punto del grafico semplicemente “trascinando e rilasciando”.
Le medie mobili possono essere configurate in 4 diversi metodi di calcolo. Puoi anche impostare avvisi in base al numero di medie mobili e
Informazioni su Range Explosion Range Explosion è uno strumento di trading potente e gratuito, progettato per rilevare i range di mercato, disegnare zone di supporto e resistenza precise e identificare opportunità di breakout con precisione.
È parte del progetto Break Out Explosion, offrendo una soluzione affidabile e visivamente avanzata sia per principianti che per trader professionisti. La versione MT5 di questo prodotto è disponibile qui:
https://www.mql5.com/en/market/product/153004
Se sei
FREE

Trend Arrow Reaper è un indicatore di tendenza che mostra segnali di ingresso tramite frecce. Analizza il prezzo e identifica potenziali inversioni. Caratteristiche principali: Frecce di trading: Freccia blu verso l'alto – Segnale di acquisto (long). Freccia gialla verso il basso – Segnale di vendita (short). Meno falsi segnali – Filtro integrato per maggiore precisione. Funziona su tutti i timeframe – Da M1 a MN. Facile da usare – Nessuna impostazione complessa. Come usarlo? Attende
Hi Trader, ================================================================================ If you like my indicator, please do not hesitate to give a review and/or comment. Thank you! ================================================================================
This indicator draws trade entry zone and target levels based on the levels of the previous day.
A blue zone (BUY) or red zone (SELL) is drawn and two targets. The optimal trade entry value is also indicated.
A second gray zone is
FREE
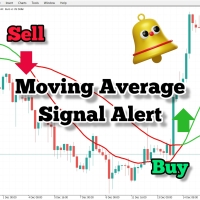
Se utilizzi le medie mobili nella tua strategia di trading, allora questo indicatore può esserti molto utile. Fornisce segnali all'incrocio di due medie mobili, invia avvisi sonori, visualizza notifiche sulla piattaforma di trading e invia anche una email sull'evento. Viene fornito con impostazioni facilmente personalizzabili per adattarsi al tuo stile e strategia di trading.
Parametri regolabili: Media Mobile Veloce (Fast MA) Media Mobile Lenta (Slow MA) Invio Email (Send_Email) Avvisi Sonori
FREE
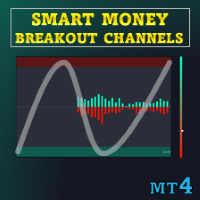
Offerta speciale : ALL TOOLS , solo $35 ciascuno! Nuovi strumenti a $30 per la prima settimana o per i primi 3 acquisti ! Canale Trading Tools su MQL5 : unisciti al mio canale MQL5 per ricevere le ultime novità Questo indicatore traccia zone di rilevamento del breakout, denominate “Smart Breakout Channels”, basate sul movimento dei prezzi normalizzato per la volatilità. Queste zone sono visualizzate come box dinamici con overlay di volume. Lo strumento rileva range temporanei di ac

Capture every opportunity: your go-to indicator for profitable trend trading Trend Trading is an indicator designed to profit as much as possible from trends taking place in the market, by timing pullbacks and breakouts. It finds trading opportunities by analyzing what the price is doing during established trends. [ Installation Guide | Update Guide | Troubleshooting | FAQ | All Products ]
Trade financial markets with confidence and efficiency Profit from established trends without getting whip
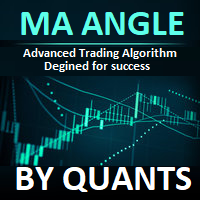
La pendenza media mobile di Quants è un indicatore molto potente per dare indicazione direzionale e slancio. L'indicatore non viene ridipinto. È possibile calcolare l'angolo ma in modo efficiente e trovare la tendenza.
Il conteggio dei profitti inizia una volta chiusa la candela di segnale. Quindi sono i risultati esatti che sarebbero in diretta.
TimeFrame suggerito lo sta usando su H1. Tutte le opzioni dell'indicatore sono modificabili.
Suggerimenti: oscillazioni commerciali e direzioni di b
FREE
Market Structure Order Block Dashboard MT4 – Indicatore ICT / Smart Money Concepts per MetaTrader 4 Market Structure Order Block Dashboard MT4 è un indicatore avanzato per MetaTrader 4, progettato per i trader che utilizzano i Smart Money Concepts (SMC) e l’approccio ICT : struttura di mercato, Order Blocks , BOS / ChoCH , Fair Value Gaps (FVG) , zone di liquidità , Kill Zones e Volume Profile , tutto riunito in un unico dashboard visivo. Non è un Expert Advisor e non apre né gestisce operazioni
** All Symbols x All Time frames scan just by pressing scanner button ** Discount: The price is $50$, But now it is just $35, Limited time offer is active.
*** Contact me to send you instruction and add you in "Swing scanner group" for sharing or seeing experiences with other users. Swing EA: https://www.mql5.com/en/market/product/124747 Introduction: Swing Scanner is the indicator designed to detect swings in the direction of the trend and possible reversal swings. The indicator studies sev

Fair Value Gap Finder detects fair value gaps and generates a signal when price returns to one. Set the minimum and maximum fvg size, customize the colors, style, and length, then let the indicator highlight them for you.
Key Features: Automatic FVG highlights - The indicator detects all fair value gaps that fit your criteria and marks them on the chart.
Entry Signal - A signal is created whenever price retests a fair value gap.
Notification - Alerts notify you when a fair value gap
FREE

** All Symbols x All Timeframes scan just by pressing scanner button ** *** Contact me to send you instruction and add you in "Market Structure group" for sharing or seeing experiences with other users. Introduction: Market structure is important for both new and professional traders since it can influence the liquidity and price action of a market (Breakout and Retest). It’s also one of the most commonly used techniques to understand trends, identify potential reversal points, and get a feel f
Non-Repainting Indicator dont; s forget this;s work well stronger trend fast markert lower time frame How to trade with SL Scalping Arrow * this system trend trading system we trade 15M chart using day tp,if you want identify Accumulation Distribution (H4) i am reccomend my SL Currency Strength Meter 28 Pair monthy weekly strenght you can easy filter best rank symbol list weekly monthy * we dont;s trade trend change time waiting trade next day pullback * if you want golden entry find. SL Cur
User Manual For more information pm me SL Currency28 Pair Dashboard is even used by the Banks to make profits. They take a strong currency and pitch against a weak currency This strategy i am made my other indicator SL Currency Strength Meter 28 Pair more improvement We can easily study the financial strength of multi-faceted trading SL Currency28 Pair Dashboard strength meter which creates multiple charts in a single window based on the price action of each currency in relation to

** All Symbols x All Timeframes scan just by pressing scanner button ** - Discount : it is not 50$, it is just 39$. *** Contact me to send you instruction and add you in "Head & Shoulders Scanner group" for sharing or seeing experiences with other users. Introduction: Head and Shoulders Pattern is a very repetitive common type of price reversal patterns. The pattern appears on all time frames and can be used by all types of traders and investors. The Head and Shoulders Scanner in
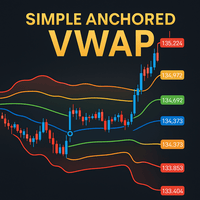
Simple Anchored VWAP is a lightweight yet powerful tool designed for traders who want precise volume-weighted levels without complexity.
This indicator lets you anchor VWAP from any point on the chart and instantly see how price reacts around institutional volume zones. MT5 Version - https://www.mql5.com/en/market/product/155321/
Join To Learn Market Depth - https://www.mql5.com/en/channels/suvashishfx Using VWAP bands and dynamic levels, the tool helps you understand where real buying and s
FREE

L'algoritmo trova le zone di volatilità ridotta in base all'indicatore UPD1 Trend Direction e traccia il volume orizzontale massimo in base all'indicatore UPD1 Volume Box . Di norma, un forte movimento di tendenza si verifica quando si esce dall'accumulo. Se il prezzo ha lasciato l'accumulo, può testare il suo volume orizzontale massimo (POC). Smart Alert sono disponibili nelle impostazioni.
Parametri di input.
Impostazioni di base. Bars Count – numero di barre della cronologia su cui verrà e
FREE

Volume Footprint Analysis is a precision-engineered, volume-based indicator that transforms raw market volume into an intuitive, color-coded signal system. Built on concepts from Volume Spread Analysis (VSA) and Smart Money principles, this tool removes the guesswork from volume interpretation and gives traders clear, actionable insights on when to buy or sell — on any timeframe and across any trading instrument. MT5 Version - https://www.mql5.com/en/market/product/138565/ Join To Learn Mark
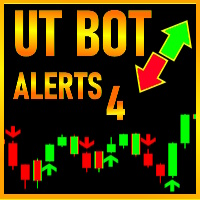
Good old UT BOT converted from TradingView script by ' QuantNomad ', initially by ' Yo_adriiiiaan ' and ' HPotter ' - so you can bet this is powerful tool. If you know, you know. This is top of the line, while keeping it really simple.
Main function: trend identification with trend switch points , created by EMA(source) and ATR -source is CLOSE PRICE with option to use HEIKEN ASHI chart instead, for this you need "Heiken Ashi" indicator - its available as free download by MetaQuotes
One of th
FREE

Ants Lite ATR allows you to enter and manage your trades based on the market volatility, giving you safer entries and better exits. Based on the work by Daryl Guppy.
Features Ability to define the bar the Long and Short calculation starts from. Can be used to generate both entry or exit signals. Customizable ATR period and multiplier. GMMA is a tried and tested indicator with a long pedigree. Volatility based entry and exit signal rather than time based.
How To Use Simply drag the indicator fr

The indicator of the indicators. The Most Powerful Technique to Determine Forex Trend Strength in 2023. We have perfected Supreme Commander that it calculates an average of the selected indicators (up to 16) and the selected timeframe (all) with the result of a single trend that indicates the potential of buying and selling. It includes the following indicators:
Accelerator/Decelerator oscillator Average Directional Movement Index Awesome oscillator; Bulls and Bears Commodity Channel Index; De
Il MetaTrader Market è un sito semplice e pratico dove gli sviluppatori possono vendere le loro applicazioni di trading.
Ti aiuteremo a pubblicare il tuo prodotto e ti spiegheremo come prepararne la descrizione per il Market. Tutte le applicazioni sul Market sono protette da crittografia e possono essere eseguite solo sul computer dell'acquirente. La copia illegale è impossibile.
Ti stai perdendo delle opportunità di trading:
- App di trading gratuite
- Oltre 8.000 segnali per il copy trading
- Notizie economiche per esplorare i mercati finanziari
Registrazione
Accedi
Se non hai un account, registrati
Consenti l'uso dei cookie per accedere al sito MQL5.com.
Abilita le impostazioni necessarie nel browser, altrimenti non sarà possibile accedere.