MetaTrader 4용 기술 지표 - 5

Special offer : ALL TOOLS , just $35 each! New tools will be $30 for the first week or the first 3 purchases ! Trading Tools Channel on MQL5 : Join my MQL5 channel to update the latest news from me ICT의 Inversion Fair Value Gap (IFVG) 개념을 Inversion Fair Value Gaps Indicator 로 활용해보세요! 이 첨단 도구는 Fair Value Gap(FVG)을 한 단계 끌어올려, 역전된 FVG 영역을 식별하고 표시합니다. 이러한 영역은 가격 조정 후 형성되는 주요 지지 및 저항 구역입니다. 스캘퍼, 스윙 트레이더 또는 장기 투자자이든 상관없이 IFVG 지표는 실시간 의사결정을 위한 귀중한 통찰력을 제공합니다. MT5 버전 보기: Inversion Fair V
This index is based on the secondary development of supertrend, adding the combination index of Ma mean line user-defined algorithm, NRP, MTF three index weighted realization function.
There are two colors in the batch marking, orange for short and green for long.
Supertrend index is the first artificial intelligence indicator in the whole network --- signal light trading strategy.
It imitates the uncertain concept judgment and reasoning thinking mode of human brain. For the description
FREE
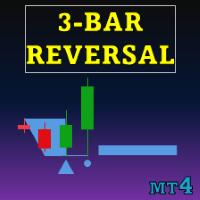
Special offer : ALL TOOLS , just $35 each! New tools will be $30 for the first week or the first 3 purchases ! Trading Tools Channel on MQL5 : Join my MQL5 channel to update the latest news from me 삼중 반전 패턴 지표 는 트레이더들에게 강력한 도구를 제공하여 가격 차트에 삼중 반전 패턴을 자동으로 식별하고 강조 표시합니다. 이 지표는 잠재적인 트렌드 반전을 탐지하는 데 유용하며, 통합된 트렌드 지표를 통해 신호 정확도를 향상시킬 수 있습니다. MT5 버전 보기: Three Bar Reversal Pattern MT5 다른 제품 보기: 모든 제품 주요 특징 자동 패턴 감지: 이 지표는 삼중 반전 패턴을 스캔하며, 명확한 시각적 신호로 표시하여 잠재적인 트렌드 반전 포인트를 인식하는 데 도움을 줍니다.

수동으로 그리지 않고 몇 초 만에 명확한 시장 구조 확인!
HTF 자동 지지/저항 지표 는 차트에 주요 지지 및 저항 레벨을 자동으로 표시합니다. 이 레벨은 높은 타임프레임(HTF)에 기반하므로, 단기 임의선보다 훨씬 신뢰성이 높습니다. 주요 기능: 가장 강한 지지/저항 구역 자동 감지 멀티 타임프레임 분석: 더 정확한 레벨을 위해 상위 타임프레임 선택 즉각적인 인식을 위한 색상 구분된 명확한 구역 주관적 오류 없음 – 고정 규칙에 따라 객관적으로 계산 모든 시장 최적화: 포렉스, 지수, 원자재, 암호화폐 바로 사용 가능 – 최적 기본 설정 포함 트레이더 장점: 시장이 전환하거나 반응할 가능성이 높은 위치를 빠르게 확인 강력한 구역에서만 거래하여 나쁜 세팅 필터링 시간을 절약하고 일관된 분석 레벨로 성공률 향상 스캘퍼, 데이 트레이더, 스윙 트레이더에 적합 사용 팁: 설정에서 원하는 상위 타임프레임 선택 (예: H4, D1, W1) 구역을 프라이스 액션 또는 캔들 패턴과 결합 시장
FREE

2 copies left at $65, next price is $120
Scalper System is a user-friendly indicator designed to detect market consolidation zones and anticipate breakout movements. Optimized for the M1 or M15 timeframe, it performs best on highly volatile assets like gold (XAUUSD). Although originally designed for the M1 or M15 timeframe, this system performs well across all timeframes thanks to its robust, price action-based strategy.
You can visually backtest the indicator to evaluate the accuracy of its si

The Only 100% Universal Tool! Stop trading against nature! This is your chance to secure the only indicator rooted in the absolute laws that govern the entire universe. Most tools guess—this one reveals the truth. Buy another toy or buy the truth. Your choice...
Based on Universal Laws — NOT Some Guy’s Algorithm: Let the market adjust to the Hidden Cycles Geometry — not the other way around.
Most indicators are based on a man-made formula. They often lag, fail over time, or need constant re-o
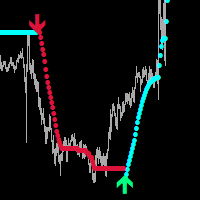
Global Parabolic MT4
Indicator for scalping on M1-M5.
A very good indicator for your trading system, it can be used as a standalone
trading system, I recommend using it together with - System Trend Pro The indicator does not repaint and does not change its data.
Settings:
Change the FILTER parameter for accurate market entries.
Any questions? Need help?, I am always happy to help, write me in private messages or
In telegram

기본 렌코 지표는 명확하고 간결한 시장 관점을 찾는 트레이더를 위한 강력한 도구입니다. 이 인디케이터는 추세 시각화를 단순화할 뿐만 아니라 반전에 대한 정확한 알림을 제공하여 거래에서 전략적 우위를 제공합니다 / 무료 MT5 버전
특징 완전 사용자 지정 가능: 고급 사용자 지정 옵션으로 비즈니스 선호도에 맞게 지표를 조정할 수 있습니다. 색상부터 박스 크기 설정까지 차트에 정보가 표시되는 방식을 완벽하게 제어할 수 있습니다. 반전 알림: 반전 알림: 반전 알림을 통해 시장 방향의 잠재적 변화에 대해 가장 먼저 알아보세요. 이를 통해 정보에 입각한 시기적절한 결정을 내려 수익을 극대화하고 손실을 최소화할 수 있습니다.
입력 Size of the boxes: 박스 크기(포인트 기준) Bullish box colour: 상승 박스 색상 Bearish box colour: 약세 상자 색상 Box opacity: 불투명도(0~100 사이)입니다. 불투명도가 낮아질수록
FREE
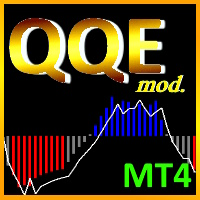
The Quantitative Qualitative Estimation (QQE) indicator is derived from Wilder’s famous Relative Strength Index (RSI). In essence, the QQE is a heavily smoothed RSI.
Modification of this version: ( converted from tradingview script by Mihkell00, original from Glaz, 100% identical output)
So there are Two QQEs. One that is shown on the chart as columns, and the other "hidden" in the background which also has a 50 MA bollinger band acting as a zero line.
When both of them agree - y
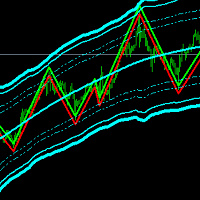
Channel Trend Bands – A Comprehensive Indicator for Market Analysis MetaTrader 5 Version
Simple to Use, Effective in Application User-Friendly and Suitable for All Traders This indicator stands out due to its straightforward functionality. Whether you're a beginner exploring the market or an experienced trader refining your strategy, this tool offers valuable insights. Using a Triangular Moving Average (TMA) with additional ATR-based bands , it provides structured market data to support well-i
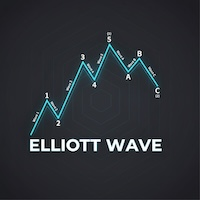
자동 엘리어트 파동 이론 (Automated Elliott Wave) 1. 자동 파동 카운팅 및 편향 감소 (객관성) 보통 엘리어트 파동 카운팅은 개인적인 "상상"이나 주관이 많이 개입됩니다. 이 보조지표는 다음과 같이 도와줍니다: 충격 파동(Impulse Wave 1-2-3-4-5) 탐지: 엄격한 규칙(예: 3파는 가장 짧을 수 없음, 4파는 1파와 겹칠 수 없음)을 사용하여 이론적으로 정확한 가격 구조를 보여줍니다. 조정 파동(Corrective Wave A-B-C) 탐지: 추세에 따라 재진입할 기회를 찾기 위해 가격 조정 구간을 포착합니다. 2. 다중 등급 분석 (Multi-Degree Analysis) 하나의 시간 프레임만 보는 것이 아니라 3가지 깊이 수준을 동시에 분석하여 시장을 입체적으로 보여줍니다: Minor (단기): 빠른 움직임 확인용. Intermediate (중기): 주요 추세 확인용. Primary (장기): 시장의 큰 흐름 확인용. 장점: 트레이딩 스타일에

Simple QM Pattern is a powerful and intuitive trading indicator designed to simplify the identification of the Quasimodo (QM) trading pattern. The QM pattern is widely recognized among traders for effectively signaling potential reversals by highlighting key market structures and price action formations. This indicator helps traders easily visualize the QM pattern directly on their charts, making it straightforward even for those who are new to pattern trading. Simple QM Pattern includes dynamic
FREE

Stochastic Oscillator의 다중 통화 및 다중 시간 프레임 수정. 매개변수에서 원하는 통화와 기간을 지정할 수 있습니다. 패널에는 신호 및 기본(확률적 교차) 선의 현재 값과 교차점이 표시됩니다. 또한 지표는 과매수 및 과매도 수준을 넘을 때 알림을 보낼 수 있습니다. 마침표가 있는 셀을 클릭하면 해당 기호와 마침표가 열립니다. MTF 스캐너입니다.
통화 강도 측정기(CSM)와 마찬가지로 대시보드는 지정된 통화가 포함된 쌍 또는 해당 통화가 기본 통화로 포함된 쌍을 자동으로 선택할 수 있습니다. 표시기는 "쌍 집합"에 지정된 모든 쌍에서 통화를 검색합니다. 다른 쌍은 무시됩니다. 그리고 이 쌍을 기반으로 이 통화에 대한 총 확률론적 금액이 계산됩니다. 그리고 그 통화가 얼마나 강하거나 약한지 알 수 있습니다.
차트에서 대시보드를 숨기는 키는 기본적으로 "D"입니다
매개변수 %K Period — K 라인의 기간입니다. %D Period — D 라인의 기간입니다.
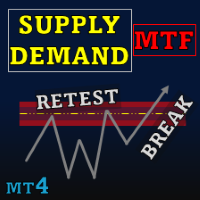
Special offer : ALL TOOLS , just $35 each! New tools will be $30 for the first week or the first 3 purchases ! Trading Tools Channel on MQL5 : Join my MQL5 channel to update the latest news from me Supply Demand Retest and Break Multi Timeframe , 이 도구는 강한 모멘텀 캔들에 기반하여 공급 및 수요 영역을 그리며, timeframe selector 기능을 사용하여 여러 시간대에서 이러한 영역을 식별할 수 있게 합니다. 재테스트 및 브레이크 라벨과 맞춤형 검증 및 스타일링 옵션을 통해 이 도구는 효과적인 거래 분석을 지원합니다. MT5 버전 자세히 보기: Supply Demand Retest and Break MT5 Multi Timeframe 더 많은 제품

Bermaui Bands(BB)는 범위 및 추세 가격 움직임 사이를 필터링하는 데 도움이 되는 기술 분석 도구입니다. 이 지표의 이면에 있는 아이디어는 다음 단계에서 설명할 수 있습니다. 표준 편차를 0과 100 사이에서 이동하는 오실레이터로 계산합니다. 나는 그것을 Bermaui Deviation 퍼센트(BD %)라고 명명하겠습니다. "BD %"가 0에 가까우면 변동성이 극심합니다. 또한 "BD %"가 100에 가까우면 변동성이 매우 낮습니다. 높은 변동성은 추세 시장에 대한 큰 가능성을 의미하고 낮은 변동성은 횡보 또는 범위 시장을 의미합니다. 중간선은 표준편차가 SMA에 따라 계산되기 때문에 단순 이동 평균(SMA)입니다. Upper Bermaui Band를 얻으려면 계산에서 동일한 수의 막대를 사용하여 단순 이동 평균에 "BD %"를 추가하십시오. The Lower Bermaui Bands를 얻으려면 계산에서 동일한 수의 막대가 있는 단순 이동 평균에서 "BD %"를 빼십시오

Introducing our exciting new Price Retest indicator! Get instant alerts when the price retests, giving you a powerful edge in your trading strategy. Remember to do your own analysis before making any moves in the market. MT5 Version - https://www.mql5.com/en/market/product/118159/ Join To Learn Market Depth - https://www.mql5.com/en/channels/suvashishfx
Here’s a detailed explanation of how the Price Retest indicator works, its components, and how you can incorporate it into your trading str
FREE
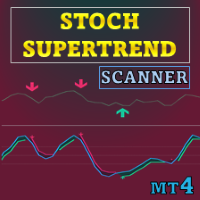
특별 제공 : ALL TOOLS , 개당 $35 ! 새 도구 는 첫 주 또는 처음 3회 구매 에 한해 $30 입니다! Trading Tools Channel on MQL5 : 최신 소식을 받으려면 제 MQL5 채널에 참여하세요 이 도구는 Stochastic RSI와 SuperTrend 로직을 결합하여 모멘텀 변화에 기반한 방향성 신호를 생성합니다. Stochastic RSI 위에 SuperTrend 스타일의 엔벨로프를 오버레이하고, 모멘텀이 과매수/과매도 임계값을 통과할 때 전환점을 강조합니다. MT5 버전 보기: Stochastic SuperTrend MT5 Scanner MT4 버전 보기: Stochastic SuperTrend MT4 Scanner 더 많은 제품 보기: All P roducts 개념 Stochastic RSI: 가격이 아닌 RSI 라인에 확률 계산을 적용하여 모멘텀을 측정합니다. SuperTrend 밴드: 사용자 지정 배수를 사용해

Introducing Order Blocks Breaker , a brand-new way to identify and leverage order blocks in your trading strategy. After developing multiple order block tools with unique concepts, I’m proud to present this tool that takes things to the next level. Unlike previous tools, Order Blocks Breaker not only identifies order blocks but also highlights Breaker Order Blocks —key areas where the price is likely to retest after a breakout. MT5 - https://www.mql5.com/en/market/product/124102/ This tool inco

It is FREE on EURUSD chart. All Symbols version! Contact me for any questions Introduction The breakout and retest strategy is traded support and resistance levels. it involves price breaking through a previous level. The break and retest strategy is designed to help traders do two main things, the first is to avoid false breakouts. Many false breakouts start with a candlestick that breaks out of a level but ends with an immediate candlestick that brings the price back into the level. The
FREE

Summer Sale: 50% OFF!!! Promotion is valid until 08 August 2025! This indicator is unstoppable when combined with our other indicator called Katana. After purchase, send us a message and you could get Katana for FREE as a BONUS After purchase, send us a private message for your instructions. The Trend Forecasting indicator is a very unique & easy tool that is able to make prediction about future price movement based on the signals generated by MACD . It helps you have an estimation on the are
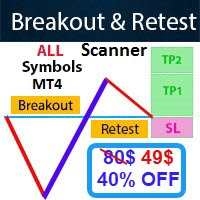
- Real price is 80$ - 40% Discount (It is 49$ now) Contact me for instruction, add group and any questions! - Non-repaint - I just sell my products in Elif Kaya profile, any other websites are stolen old versions, So no any new updates or support. - Lifetime update free Related product: Bitcoin Expert
Introduction The breakout and retest strategy is traded support and resistance levels. it involves price breaking through a previous level. The break and retest strategy is designed to help tr

Scalpers Zone – 궁극의 공급/수요 + 스토캐스틱 반발 & 트리플 터치 지표 Scalpers Zone은 고확률 스캘핑 진입을 찾는 트레이더를 위해 설계되었습니다. 일간 및 7일 공급/수요 구역을 감지하고, 이러한 구역이 완벽하게 일치하는 영역을 강조하여 가장 강력한 잠재적 반전 지점을 표시합니다. 암호화폐나 금과 같은 변동성이 큰 자산의 경우, 구역 두께를 늘려 가시성과 정확성을 높일 수 있습니다. 주요 기능: 정렬된 구역 감지: 일간 및 7일 공급/수요 구역이 겹침 → 고확률 진입 스토캐스틱 반발 알림: 주요 구역에서 과매수/과매도 반응 확인 트리플 터치 반전 감지: 강력한 레벨에서 반복 터치로 추가 확인 맞춤 알림 & 시각화: 색상 코딩된 화살표와 두꺼운 음영 구역, 소리/이메일/푸시 알림 지원 조정 가능한 구역 두께: 암호화폐 및 금과 같이 변동성이 큰 상품에 유용 Scalpers Zone의 장점: 구역이 겹치는 강력한 반전 지점에서 거래 스토캐스틱 및 트리플 터치
Nadaraya Watson Envelope 멀티커런시 스캐너 MT4 는 여러 통화 쌍과 시간 프레임에서 중요한 반전 신호를 모니터링하는 간소화된 방법을 제공합니다. TradingView에서 정확한 반전 신호로 유명한 인기 지표를 기반으로 구축된 이 스캐너는 동일한 핵심 로직을 MT4 호환 형식으로 변환합니다. 낮은 시간 프레임에서의 단기 기회와 높은 시간 프레임에서의 강한 추세 신호에 초점을 맞춰 트레이더가 시장 전환점에 주의를 기울일 수 있도록 돕습니다. MT5 버전은 여기에서 확인할 수 있습니다: Nadaraya Watson Envelope Multicurrency Scanner MT5 자세한 문서는 여기에서 클릭하세요: 문서 주요 기능: 지표 통합: Nadaraya Watson Envelope 지표를 사용하며, 가격 움직임 주변에 부드러운 엔벨로프를 계산합니다. 트레이더는 Length 파라미터를 조정하여 고려할 바의 수를 정의하고, Bandwidth를 조정하여 평활화를 제어하
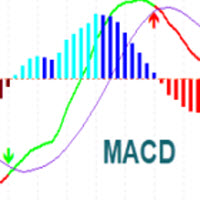
MACD Indicator It has MACD line, Signal line, and Histogram. The Histogram has 4 colors based on Direction Above and Below the Zero Line, showing its movement direction as simple as possible. Allows Show MACD & Signal Line, Show Change In color of MACD Line based on cross of Signal Line. Show Dots at Cross of MacD and Signal Line, Turn on and off Histogram. Enjoy your trading experience, and feel free to share your comments and reviews.
If you are interested in this indicator, you might
FREE

Trend Guardian Pro - Advanced Trend Prediction Indicator Trend Guardian Pro is the result of collaborative work by a team of professional mathematicians, analysts, and traders. The indicator is based on years of market data analysis and employs cutting-edge mathematical modeling techniques for early detection of potential trend changes. Key Features: Early prediction - the indicator analyzes multiple market factors to identify signs of trend changes before they become apparent Comprehensive an

This indicator uses Donchian channel and ATR indicators. This trend tracking system uses historical data to buy and sell. This indicator does not repaint. The point at which the signal is given does not change. You can use it in all graphics. You can use it in all pairs. This indicator shows the input and output signals as arrows and alert. Open long deals on blue arrows Open short deals on red arrows When sl_tp is set to true, the indicator will send you the close long and close short warnings.

"Ppr PA" is a unique technical indicator created to identify "PPR" patterns on the currency charts of the MT4 trading platform. These patterns can indicate possible reversals or continuation of the trend, providing traders with valuable signals to enter the market.
Features: Automatic PPR Detection: The indicator automatically identifies and marks PPR patterns with arrows on the chart. Visual Signals: Green and red arrows indicate the optimal points for buying and selling, respectively. Ar
FREE

개발자 노트 저는 11년 이상의 경력을 가진 MQL4/5 개발자입니다. 인디케이터 판매에 집중해 온 적은 없지만, 이 시스템의 안정적인 긍정적 손익 비율은 저 자신도 놀라게 했습니다 (Rare Spear 인디케이터 포함).
그렇기 때문에 이를 공개하기로 결정했습니다. 모든 로직, 구조 및 저작권은 전적으로 저에게 있습니다.
어떠한 약속도 하지 않습니다 — 직접 테스트하고 판단하시기 바랍니다. 이 인디케이터가 특별한 이유 주의 — 이것은 단순한 시각적 착시가 아닙니다!
경험 많은 개발자가 만든 이 인디케이터는 실제로 거래 가능한 진입 및 청산 지점을 보여줍니다. 많은 인디케이터는 캔들이 마감된 후 과거 캔들에 화살표가 나타나는 시각적 오류를 가지고 있으며, 이는 비현실적인 수익 계산과 오해를 불러오는 통계로 이어집니다. 본 인디케이터는 이 문제를 완전히 제거했습니다: 진입 화살표는 새 바가 열릴 때만 표시 화살표는 실제 거래 가능한 가격에 표시 청산 화살표는 고점/저점이 아닌 정확히
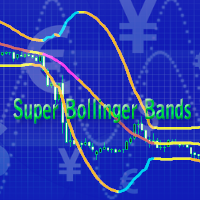
This is a forward-looking indicator for trading on all instruments. An advanced version of Bollinger Bands indicator created by outstanding analyst John Bollinger. One of the main differences of Super Bollinger Bands indicator from its predecessor consists in displaying upper and lower bands behavior on the middle line with some specific colors. Thus, the indicator gives a trader some visual information about trend development at the moment, and not in the past, as majority of other indicators d
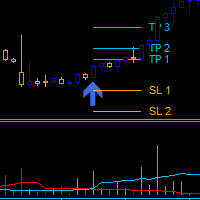
Dark Power is an Indicator for intraday trading. This Indicator is based on Trend Following strategy, also adopting the use of an histogram to determine the right power . We can enter in good price with this Indicator, in order to follow the strong trend on the current instrument. The histogram is calculated based on the size of the bars and two moving averages calculated on the histogram determine the direction of the signal
Key benefits
Easily visible take profit/stop loss lines Intui
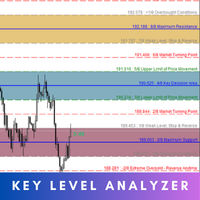
Key Level Analyzer – Know Better, Trade Smarter Key Level Analyzer is a powerful trading tool designed to provide precise market insights by identifying high-probability price zones , market turning points , and key decision areas . Unlike traditional indicators, it uses a smart algorithm to dynamically calculate support, resistance, and balance zones, helping traders make informed, data-driven decisions . MT5 Version - https://www.mql5.com/en/market/product/132810/ With real-time updates, mul
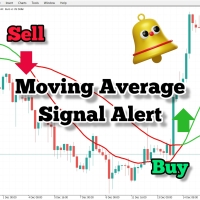
Ultimate Moving Average Crossover Alert Indicator Unlock the power of moving averages with our sophisticated crossover alert indicator, designed to enhance your trading strategy and ensure you never miss a crucial signal. Key Features Our Moving Average Crossover Alert Indicator is essential for traders who rely on moving averages. It not only identifies crossovers but also provides multiple forms of alerts to keep you informed, wherever you are. 1. Real-Time Alerts: Crossover Notifications:
FREE

Gold Pro Scalper
Precise entry points for currencies, crypto, metals, stocks, indices! Indicator 100% does not repaint!!!
If a signal appeared, it does not disappear! Unlike indicators with redrawing, which lead to loss of deposit, because they can show a signal, and then remove it.
Trading with this indicator is very easy.
Wait for a signal from the indicator and enter the deal, according to the arrow
(Blue arrow - Buy, Red - Sell).
I recommend using it with the Trend Filter (download
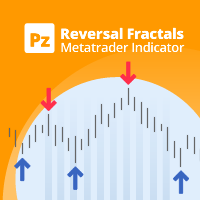
이것은 거의 10년 전에 처음으로 출판된 나의 유명한 지표인 Reversal Fractals의 최신 버전입니다. 그것은 프랙탈의 가격 구조를 조사하여 시장에서 가능한 반전 지점을 결정하고 이미 기본 또는 기술 평가 모델을 가지고 있는 포지션 트레이더에게 타이밍을 제공합니다. [ 설치 가이드 | 업데이트 가이드 | 문제 해결 | 자주하는 질문 | 모든 제품 ] 반전 프랙탈은 긴 추세를 시작할 수 있습니다 표시기는 다시 칠하지 않음
모든 종류의 경고를 구현합니다. 사용자 정의 가능한 색상 및 크기 이 표시기는 반응적이거나 지연되는 신호입니다. 왜냐하면 aa 프랙탈은 그 형성에서 가장 높거나 낮은 중간 막대인 홀수의 막대 형성이고, 표시기는 프랙탈의 모든 막대가 닫힐 때 그려지기 때문입니다. 그러나 기존의 방향성 편향이 있는 트레이더는 이 지표가 초기 진입점을 선택하는 데 매우 유용하다는 것을 알게 될 것입니다. 이 지표는 요약된 신호 지표나 완전한 거래 시스템이 아닙니다. 그런 식으로
FREE

This indicators automatically draws the Trend Channels for you once you've dropped it on a chart. It reduces the hustle of drawing and redrawing these levels every time you analysis prices on a chart. With it, all you have to do is dropped it on a chart, adjust the settings to your liking and let the indicator do the rest. Get an alternative version of this indicator here: https://youtu.be/lt7Wn_bfjPE For more free stuff visit: https://abctrading.xyz
Parameters 1) Which trend do you want t
FREE
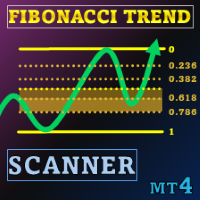
스페셜 오퍼 : ALL TOOLS , 각 $35 에 구매 가능! New tools will be $30 for the first week or the first 3 purchases ! Trading Tools Channel on MQL5 : Join my MQL5 channel to update the latest news from me 변동성이 큰 트레이딩 환경에서 강력하고 직관적인 분석 도구는 신속하게 기회를 포착하는 데 도움이 됩니다. Fibonacci Trend Scanner는 전통적인 피보나치(Fibonacci) 지표 기능과 SuperTrend를 통합할 뿐만 아니라, 통화쌍 스캔, 멀티 타임프레임 모니터링, 그리고 추세가 상승세에서 하락세로(또는 반대로) 전환될 때 인텔리전트 알림을 제공하도록 기능을 확장하였습니다. See more MT5 version at: Fibonacci Trend MT5 Scanner See more products a

The most important price level in any "Volume profile" is the "Point of Control" . This is the price level with the highest trading volume. It is primarily the level where large players initiate their positions, making it the accumulation/distribution level for the "Smart money" .
The idea of the indicator arose after the "MR Volume Profile Rectangles" indicator was made. When creating the "MR Volume Profile Rectangles" indicator, we spent a lot of time comparing the volumes with those from the

Nas100 killer V2 (See video of how we test the indicator live) 1000% non-repaint indicator appears on current candlestick. Timeframes: M5, M15, M30, H1, H4. Works on pairs such as (NAS100, US30, SPX500, and Gold) The indicator is strictly for scalping do not hold trades for too long. Orange arrows look for selling opportunities. Light Blue arrows look for buying opportunities.
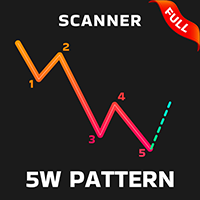
Contact me after payment to send you the User-Manual PDF File. 5W Pattern introduction The 5W pattern occurs when the price forms an alternating 5-wave cycle with its volatility. In fact, the 5W pattern is a price series of alternating HH or LL (higher high or lower low), which is the main characteristic of a trend. The pattern of 5W should have the characteristic of non-overlapping waves, also the points of the pattern are usually formed in Fibonacci levels. The completed pattern of 5W actua
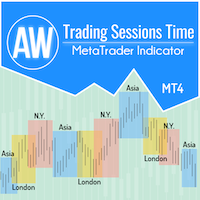
거래자가 시장 성과에 대한 데이터를 쉽게 얻고 거래 전략을 더 잘 수립할 수 있도록 거래 세션 지표를 개발했습니다. 다양한 거래소의 개장 시간은 시장 활동 및 거래량에 영향을 미치므로 거래에 영향을 미칩니다. 이러한 요소는 다양한 상품의 변동성과 거래 기회를 결정합니다. AW 거래 세션 표시기는 아시아, 런던 및 뉴욕 시장의 거래 시간을 표시합니다. 거래자는 더 나은 경험을 위해 다양한 시간대를 표시하거나 숨길 수 있습니다. 차트에서는 세션 종료까지의 시간과 거래 세션 규모를 확인할 수 있습니다. 차트의 데이터 표시에는 다양한 스타일의 거래 차트에 적합한 유연한 그래픽 조정 기능이 있습니다.
더 많은 제품 -> 여기
장점:
아시아, 런던, 뉴욕 거래 세션을 표시합니다. 필요한 경우 세션 크기를 숫자로 표시하고, 켜져 있으면 거래 세션이 끝날 때까지의 시간을 표시합니다. 거래 세션을 개별적으로 비활성화할 수 있습니다. 차트의 사용자 정의 가능한 세션 테두리 스타일 필요한 경우
FREE

덮어 촛대 패턴을 표시하는 표시기. 설정에서 침몰 유형(몸,그림자 및 조합)을 지정할 수 있습니다. 추세(2 이동 평균)와 반전(리시 및 볼린저 밴드)으로 필터링 할 수 있습니다. 이것은 매우 인기있는 가격 행동 패턴입니다. 다중 통화 대시 보드를 사용할 수 있습니다. 그것으로,당신은 쉽게 차트 사이를 전환 할 수 있습니다.
거래 패턴: 트렌드 별 재시험. 거짓 브레이크 아웃. 주문 블록. 기타.
EURUSD, GBPUSD, XAUUSD, ... M15, M30, H1.
입력 매개변수.
인기 있는. Bars Count – 표시기가 작동하는 히스토리 바의 수. Calc Mode – 침몰 유형 선택. 3 Lines Strike (Close overlap First Open).
PPR (Close overlap High) - 가까운 오버랩 높은. High overlap High - 높은 오버랩 높은. Close overlap Open - 닫기 오버랩 열기. High and Cl
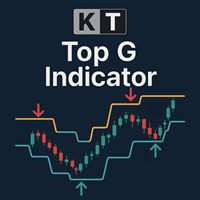
KT Top G는 가격 행동 기반의 인디케이터로, 스마트 채널 분석을 결합하여 시장의 잠재적인 고점과 저점을 식별합니다. 반전 가능성이 감지되면, 차트에 굵고 선명한 화살표를 표시하여 시장이 반전되기 전에 미리 알려줍니다. 큰 화살표: 가격 소진과 모멘텀 전환을 감지하여 고확률의 시장 고점과 저점을 강조합니다. 작은 화살표: 낮은 확률의 반전 지점을 나타내며, 실제 반전 전에 종종 돌파됩니다.
기능 광범위한 호환성: 모든 통화쌍은 물론, 지수, 주식, ETF 등 다양한 종목에서 매끄럽게 작동합니다. 다중 시간 프레임 최적화: M1, M5에서의 스캘핑, H1, H4, D1에서의 스윙 트레이딩에 모두 적합합니다. 중심선 포함 동적 채널: 화살표 외에도 현재 시장 범위와 추세 방향을 강조하는 중간선을 포함한 채널이 함께 표시됩니다. 리페인트 없음: 차트에 화살표가 한 번 나타나면 유지되며, 사라지거나 바뀌지 않습니다. 변동성 있는 시장 대응 가능: 길이 및 스무딩 계수를 조정하여 예측
트렌드 추종 거래는 트레이더가 가격의 주요 움직임 방향으로 포지션에 진입하고, 트렌드가 바뀔 때까지 그 포지션을 유지하는 전략입니다. Anti EMA MT4는 MetaTrader 4 터미널용 전문 지표로, 장기적인 가격 데이터에 초점을 맞추어 지속적인 움직임을 파악하고 단기적인 변동으로 인한 잘못된 신호를 피할 수 있도록 도와주기 때문에 이러한 거래에 유용한 도구가 될 수 있습니다. MetaTrader 5 터미널용 Anti EMA 버전: https://www.mql5.com/ko/market/product/152766 Anti EMA가 단순 이동평균(SMA)이나 지수 이동평균(EMA)과 같은 일반적인 이동평균과 구별되는 핵심 차이점은 가중치 배분 방식에 있습니다. 표준 이동평균은 가중치를 균등하게 또는 과거로 갈수록 감소하도록 배분하므로 최근 가격에 더 민감하게 반응합니다. 반면 Anti EMA는 과거 가격에 더 높은 가중치를, 최근 가격에는 더 낮은 가중치를 부여합니다. 이로

Good old UT BOT converted from TradingView script by ' QuantNomad ', initially by ' Yo_adriiiiaan ' and ' HPotter ' - so you can bet this is powerful tool. If you know, you know. This is top of the line, while keeping it really simple.
Main function: trend identification with trend switch points , created by EMA(source) and ATR -source is CLOSE PRICE with option to use HEIKEN ASHI chart instead, for this you need "Heiken Ashi" indicator - its available as free download by MetaQuotes
One of th
FREE
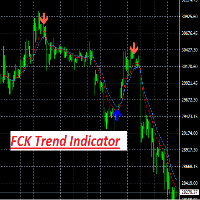
FCK Trend Indicator is an indicator for determining the current direction of price movement and reversal points. The indicator will be useful for those who want to see the current market situation better. The indicator can be used as an add-on for ready-made trading systems, or as an independent tool, or to develop your own trading systems. FCK Trend Indicator indicator, to determine the reversal points, analyzes a lot of conditions since the combined analysis gives a more accurate picture of t
Range Explosion 소개 Range Explosion은 시장 범위를 감지하고, 정확한 지지선과 저항선을 그리며, 돌파 기회를 정확하게 식별하는 강력하고 무료인 트레이딩 도구입니다.
Break Out Explosion 프로젝트의 일부로서, 초보자와 전문가 모두에게 신뢰할 수 있는 고급 시각적 솔루션을 제공합니다. 이 제품의 MT5 버전은 여기에서 확인할 수 있습니다:
https://www.mql5.com/en/market/product/153004
추세선 돌파 개념에 관심이 있다면, 주요 추세 방향의 돌파를 감지하는 고급 도구를 확인해 보세요:
https://www.mql5.com/en/market/product/155132 이 지표의 화살표를 기반으로 거래하는 EA를 원하시나요? 아래 링크를 통해 $30 에 직접 작업을 생성하시면 제가 만들어드리겠습니다:
https://www.mql5.com/en/job/new?prefered=eeecad Break Out Explosio
FREE

Scalping Binary Option Pro is an arrow indicator that is completely free from repainting . Although it may work incorrectly in strategy testers, its signals remain relevant for real trading. Signals: A red arrow pointing down indicates a selling opportunity, while a green arrow pointing up indicates a buying opportunity. Settings: All you need to adjust are the colors of the signal arrows and the sound alert for signal notifications. Usage Recommendations: It is best to use the indicator on hig

RSI divergence indicator finds divergences between price chart and RSI indicator and informs you with alerts (popup, mobile notification or email). Its main use is to find trend reversals in the chart. Always use the divergence indicators with other technical assets like support resistance zones, candlestick patterns and price action to have a higher possibility to find trend reversals. Three confirmation type for RSI divergences: RSI line cross 50 level (doesn't repaint) Price returns to
FREE

Was: $299 Now: $99 Supply Demand uses previous price action to identify potential imbalances between buyers and sellers. The key is to identify the better odds zones, not just the untouched ones. Blahtech Supply Demand indicator delivers functionality previously unavailable on any trading platform. This 4-in-1 indicator not only highlights the higher probability zones using a multi-criteria strength engine, but also combines it with multi-timeframe trend analysis, previously confirmed swings
This indicator was specially developed to support the powerful day trading strategy described in the book "The Price in Time". The NTZ BOX indicator automatically creates: The Day separators The No Trading Zone divided with the Green Box, the Peach Box and the Turqoise Box Extensions of the long and short Take Profit levels The Yellow Box to display the range of the Asian session The Money Manager for a perfect Position Sizing calculated on your risk percentage Using the NTZ BOX indicator will e
탑 바텀 트래커는 시장 추세를 분석하고 추세의 고점과 저점을 감지할 수 있는 정교한 알고리즘을 기반으로 하는 지표입니다 / MT5 버전 .
가격은 500$에 도달할 때까지 점진적으로 상승합니다. 다음 가격 --> $99
특징 다시 칠하지 않음 이 표시기는 새 데이터가 도착해도 값을 변경하지 않습니다
거래 쌍 모든
외환 쌍
기간 모든
기간
파라미터 ==== 인디케이터 구성 ====
구성 매개 변수 // 40 (값이 높을수록 신호가 적지만 더 정확한 신호가 제공됩니다)
상위 레벨 값 // 80 (상단 수평선의 값)
하단 레벨 값 // 20 (하단 수평선 값)
인디케이터 계산 막대 수 // 3000 (인디케이터를 계산할 막대 수). 값 0은 모든 막대에 대해 인디케이터를 계산합니다)
==== 알람 구성 ====
팝업 알림 // 참(터미널에서 알람)
이메일 알림 // 참(이메일로 알람 전송)
알람 시간 간격 // 10 (분 단위의 알람 간격)
경고
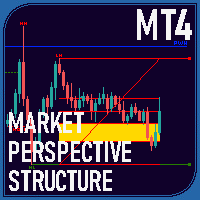
Overview The Market Perspective Structure Indicator is an indicator designed to provide traders with a detailed analysis of market structure across multiple timeframes. It identifies and visualizes key price action elements, including swing highs and lows, Break of Structure (BOS), Change of Character (CHOCH), internal structures, equal highs/lows, premium/discount levels, previous levels from higher timeframes, and trading session zones. With extensive customization options, this indicator is

This scanner is for showing Cross of various TDI elements: PriceLine, Trade Signal Line and Market Base Line And for getting alerts, so you can be prepared for finding good trade setups before they happen. It also shows TDI signals, trend, volatility and different timeframe alignment.
Detailed blog post:
https://www.mql5.com/en/blogs/post/759050
Features: Show TDI Signal and Trend Show Volatility & Overbought/Oversold Show cross between: PriceLine & TSL PriceLine & MBL MBL & TSL PriceLine and

** All Symbols x All Timeframes scan just by pressing scanner button ** *** Contact me to send you instruction and add you in "All Divergences scanner group" for sharing or seeing experiences with other users. Introduction Divergence is a main technique used to determine trend reversing when it’s time to sell or buy because prices are likely to drop or pick in the charts. All Divergence indicator can help you locate the top and bottom of the market. This indicator finds Regular divergences for
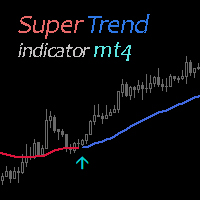
Super Trend Indicator uses two moving averages for calculating the trend direction. Combination with other market signals and analysis is necessary and provides more stable results. Indicator can be easily customized by the user including change of colors, with and arrow sizes.
FREE Super Trend Expert Advisor > https://www.mql5.com/en/market/product/81160?source=Site +Profile+Seller
FREE

Introduction to Fractal Pattern Scanner Fractal Indicator refers to the technical indicator that makes use of the fractal geometry found in the financial market. Fractal Pattern Scanner is the advanced Fractal Indicator that brings the latest trading technology after the extensive research and development work in the fractal geometry in the financial market. The most important feature in Fractal Pattern Scanner is the ability to measure the turning point probability as well as the trend probabi

Fair Value Gap Finder detects fair value gaps and generates a signal when price returns to one. Set the minimum and maximum fvg size, customize the colors, style, and length, then let the indicator highlight them for you.
Key Features: Automatic FVG highlights - The indicator detects all fair value gaps that fit your criteria and marks them on the chart.
Entry Signal - A signal is created whenever price retests a fair value gap.
Notification - Alerts notify you when a fair value gap
FREE

The Super Arrow Indicator provides non-repainting buy and sell signals with exceptional accuracy. Key Features No repainting – confirmed signals remain fixed Clear visual arrows: green for buy, red for sell Real-time alerts via pop-up, sound, and optional email Clean chart view with no unnecessary clutter Works on all markets: Forex, gold, oil, indices, crypto Adjustable Parameters TimeFrame Default: "current time frame" Function: Sets the time frame for indicator calculation Options: Can be set

In the "Masters of Risk" trading system, one of the main concepts is related to places where markets change direction. In fact, this is a change in priority and a violation of the trend structure at the extremes of the market, where supposedly there are or would be stop-losses of "smart" participants who are outside the boundaries of the accumulation of volume. For this reason, we call them "Reversal Patterns" —places with a lot of weight for the start of a new and strong trend. Note:
We are r

Moving Average Crossover Scanner and Dashboard Advanced Moving Average Scanner Moving Average Crossover Dashboard The indicator scans the market and sends signals and alerts for Moving Averages crossovers, death cross and golden cross. Crossovers are one of the main moving average ( MA ) strategies. MA Crossover ( cut ) strategy is to apply two moving averages to a chart: one longer and one shorter. When the shorter-term ( fast MA ) MA crosses above the longer-term ( slow MA ) MA, it's a buy sig
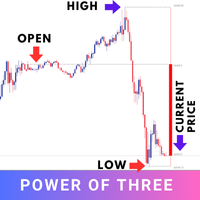
The "Power of Three" (PO3) is a concept developed by the Inner Circle Trader (ICT) to illustrate a three-stage approach used by smart money in the markets: Accumulation, Manipulation, and Distribution . ICT traders view this as a foundational pattern that can explain the formation of any candle on a price chart. In simple terms, this concept is effective for any time frame, as long as there's a defined start, highest point, lowest point, and end. MT5 - https://www.mql5.com/en/market/product/124
FREE
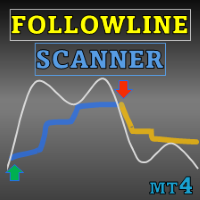
Special offer : ALL TOOLS , just $35 each! New tools will be $30 for the first week or the first 3 purchases ! Trading Tools Channel on MQL5 : Join my MQL5 channel to update the latest news from me Follow Line 와 스캐너로 거래에서 앞서 나가세요. 이 고급 변동성 기반 지표는 진지한 트레이더를 위해 설계되었습니다. 이 도구는 Bollinger 밴드의 강력한 기능과 맞춤 설정을 결합하여 가격 움직임에 대한 정확한 통찰력을 제공합니다. See more MT5 version at: Follow Line MT5 with Scanner See more products at: https://www.mql5.com/en/users/ndhsfy/seller Follow Line의 핵심은 가격이 1 표준
FREE

** All Symbols x All Timeframes scan just by pressing scanner button ** - Discount : it is not 50$, it is just 39$. *** Contact me to send you instruction and add you in "Head & Shoulders Scanner group" for sharing or seeing experiences with other users. Introduction: Head and Shoulders Pattern is a very repetitive common type of price reversal patterns. The pattern appears on all time frames and can be used by all types of traders and investors. The Head and Shoulders Scanner in

차트에 수동으로 피보나치 레벨을 그리는 데 지쳤습니까? 거래에서 주요 지지선과 저항선을 식별할 수 있는 편리하고 효율적인 방법을 찾고 계십니까? 더 이상 보지 마세요! 자동 피보나치 수준 을 수행하는 최고의 MetaTrader 4 지표인 DrawFib Pro를 소개합니다. 차트에 그림을 그리고 이러한 수준이 위반되면 적시에 경고를 제공합니다. DrawFib Pro를 사용하면 거래 전략을 강화하고 시간을 절약하며 정보에 입각한 결정을 내릴 수 있습니다. 내 피보나치 기반 지표: WH Advanced Gartley Pattern MT4 || WH Price Wave Pattern MT4 주요 특징들:
자동화 피보나치 그리기. 사용자 정의 가능 매개변수 . 정확한 그리고 믿을 수 있는. 실시간 경고. 사용자 친화적 인터페이스. DrawFib Pro는 효율적이고 신뢰할 수 있으며 사용자 친화적인
FREE

Did You Have A Profitable Trade But Suddenly Reversed? In a solid strategy, exiting a trade is equally important as entering.
Exit EDGE helps maximize your current trade profit and avoid turning winning trades to losers.
Never Miss An Exit Signal Again
Monitor all pairs and timeframes in just 1 chart www.mql5.com/en/blogs/post/726558
How To Trade You can close your open trades as soon as you receive a signal
Close your Buy orders if you receive an Exit Buy Signal. Close your Sell orders if
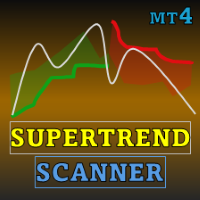
Special offer : ALL TOOLS , just $35 each! New tools will be $30 for the first week or the first 3 purchases ! Trading Tools Channel on MQL5 : Join my MQL5 channel to update the latest news from me SuperTrend by Kivanc Ozbilgic with Scanner 를 소개합니다 – 시장 트렌드를 앞서기 위해 설계된 다기능 강력한 도구로, 사용자 맞춤형 기능과 실시간 알림을 제공합니다. ATR 계산 방법을 RMA (상대 이동 평균)와 SMA (단순 이동 평균) 중에서 선택하여 최대한의 유연성을 제공할 수 있습니다. 기본 설정으로 ATR 기간은 10, 배수는 3으로 설정되어 있으며, SuperTrend 는 매수 및 매도 신호를 효율적으로 감지합니다. 내장된 스캐너와 알림 시스템은 여러 통화 쌍과 시
FREE
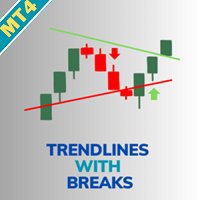
거래의 브레이크아웃을 강화하기 위해 Trendlines with Breaks by LuxAlgo MT5를 사용하세요. 이는 피벗 기반의 혁신적인 지표로, 동적 추세선을 자동으로 그리고 실시간 브레이크아웃을 강조하며, TradingView의 인기 LuxAlgo 스위트에서 유래하여 100,000회 이상 사용되고 긍정적인 리뷰를 받은 지지/저항 수준 탐색 정확성으로 평가됩니다. Reddit 및 YouTube와 같은 거래 커뮤니티에서 비재도색 옵션과 사용자 정의 기울기로 찬사를 받는 이 도구는 외환, 주식, 암호 트레이더에게 추세 반전과 지속을 포착하는 힘을 부여하며, 사용자들은 진입 타이밍 개선과 거짓 신호 감소를 보고—변동성 시장에서 승률을 10-20% 향상시키는 경우가 많습니다, 투기적 이동이 아닌 확인된 브레이크아웃에 집중함으로써. 그 이점에는 공격적 진입을 위한 브레이크아웃 포인트의 정확한 식별, 시장 조건에 맞는 적응형 추세선 경사, 지속 모니터링 없이 앞서 나가기 위한 통합 경

안녕하세요, 이것은 빙입니다. ICT 개념을 거래하기 위한 신뢰할 수 있는 지표를 찾고 있다면, ICT Market Structure는 보다 고급 전략을 사용하는 트레이더들을 위한 사용자 매뉴얼을 제공합니다. 이 올인원 지표는 ICT 개념(스마트 머니 개념)에 초점을 맞추고 있습니다. ICT Market Structure는 기관들이 어떻게 거래하는지 이해하려고 하며, 그들의 움직임을 예측하는 데 도움이 됩니다. 이 전략을 이해하고 활용함으로써, 트레이더들은 시장 움직임에 대한 귀중한 통찰력을 얻고 가격 행동에 기반한 더 실용적인 진입 및 청산 포인트를 찾을 수 있습니다. 다음은 일부 기능에 대한 간단한 소개입니다: 비재페인팅, 비리드로잉, 비래깅 지표 오더 블록(상승 및 하락), 볼륨 메트릭스와 얼럿이 있는 오더 블록 실시간 시장 구조와 스윙 구조 고점과 저점(HH, HL, LL, LH)과 얼럿이 있는 구조 붕괴(BOS), 성격 변화(CHoCH)/ 모멘텀 변화(MS) 브레이커 블록
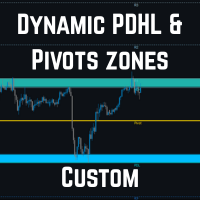
AutoPivot - 자동 피벗 포인트 지표 MT4용 고급 인디케이터로, 일간·주간·월간 주요 피벗 포인트(PP, R1, R2, R3, S1, S2, S3)를 자동 계산 및 표시하며, 전일 고점(PDH)과 저점(PDL)을 함께 표시하여 트레이더가 잠재적 지지·저항 구역을 한눈에 파악할 수 있도록 돕습니다. 주요 기능: 지능형 시간 프레임 인식 : 차트의 주기(H4, D1, W1)를 자동 감지하여 각 시간대에 맞는 정확한 피벗 계산 수행. 전일 고점/저점 표시 : PDH/PDL을 자동으로 표시하고, 현재 가격과의 상대적 위치를 직관적으로 확인 가능. 지지/저항 구역 시각화 : PDH/PDL과 인접한 피벗 라인 사이에 반투명 영역을 생성하여 반전 또는 돌파 가능 구간을 명확히 표현. 8가지 색상 테마 : 클래식, 다크, 라이트, 블루, 프로페셔널 등 8가지 프리셋 테마 제공. 색상, 선 스타일, 투명도 모두 사용자 맞춤 설정 가능. 가격 라벨 옵션 : 각 피벗
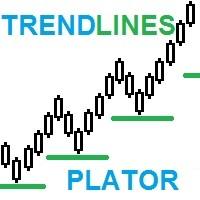
TrendLines Plator: 트레이딩 전략을 발전시키는 고급 추세 예측 지표 혁신적인 우리 지표의 잠재력을 탐색하세요! 더 긴 시간프레임의 추세선을 분석하고 현재 시간프레임에 직접 투영하는 능력으로, 일반 트레이더의 주목을 받는 전략적인 서포트를 제공합니다. 이 점들은 거래에 매우 강력한 서포트 또는 저항 수준으로 전환되어, 트레이딩 전략을 강화합니다. 당신의 가격 행동 인디케이터 선택에 완벽하게 조화를 이루는 지표의 가능성을 시각화해보세요. 우리의 혁신적인 지표로 이 빈 공간을 채우세요! 그 정확성에 놀라실 것입니다. 이것은 전략을 향상시키고 결과를 도출하는 데 필수적인 요소가 될 수 있습니다. 이 기회를 놓치지 마세요! 지금 바로 이 놀라운 도구를 거래 리소스에 통합하는 기회를 활용하세요. 그 가치와 잠재력을 인지하면, 오늘 바로 획득하는 결심을 망설이지 마세요. 고성능 지표로 거래 정확성을 향상시키고 새로운 성공 수준에 도달하세요! 최신 소식을 놓치지 마세요 독점적인 출시
MetaTrader 마켓은 개발자들이 거래 애플리케이션을 판매할 수 있는 간단하고 편리한 사이트이다.
제품을 게시하고 마켓용 제품 설명을 어떻게 준비하는가를 설명하는 데 도움이 됩니다. 마켓의 모든 애플리케이션은 암호화로 보호되며 구매자의 컴퓨터에서만 실행할 수 있습니다. 불법 복제는 불가능합니다.
트레이딩 기회를 놓치고 있어요:
- 무료 트레이딩 앱
- 복사용 8,000 이상의 시그널
- 금융 시장 개척을 위한 경제 뉴스
등록
로그인
계정이 없으시면, 가입하십시오
MQL5.com 웹사이트에 로그인을 하기 위해 쿠키를 허용하십시오.
브라우저에서 필요한 설정을 활성화하시지 않으면, 로그인할 수 없습니다.