Liquidity shock detector

LIQUIDITY SHOCK DETECTOR ( XAUUSD 1 minute EDITION)
===================================================

BRIEF DESCRIPTION :
-----------------------------------
Detects institutional liquidity zones created by sudden price movements and provides multi-timeframe trend analysis.


FULL DESCRIPTION:
-----------------

Liquidity Shock Detector identifies significant price movements that often indicate institutional activity. When large market participants enter or exit positions, they create liquidity zones that price frequently revisits. This indicator automatically detects these zones and provides real-time trend analysis across multiple timeframes.

How It Works

The indicator monitors price velocity and candle size to detect sudden movements. When a significant move occurs, a validation period confirms whether the zone holds. Validated zones are displayed on the chart with clear visual markers showing zone strength and direction.

Key Features

- Automatic detection of liquidity shock zones based on price velocity and ATR
- Self-learning threshold that adapts to current market conditions
- Zone flip detection: bullish zones flip to bearish when price closes through, and vice versa
- Multi-timeframe trend analysis showing M15, M30 and H1 candle direction
- HTF trend alignment check using EMA crossover on higher timeframe
- Session detection highlighting London, New York and Overlap trading hours
- Volume spike confirmation for additional zone strength validation
- Buy and sell signals generated on wick rejections from active zones

Zone Behavior

When a liquidity shock is detected, the indicator creates a zone based on the candle direction. Bullish zones act as support and generate buy signals on wick rejections. Bearish zones act as resistance and generate sell signals. If price closes through a zone, it automatically flips direction. A bullish support zone becomes bearish resistance, and a bearish resistance zone becomes bullish support. This flip behavior reflects how institutional levels often change role after being broken.

Dashboard Display

The indicator includes a comprehensive dashboard showing:
- Current session with color coding
- Detection count and learning status
- Active zone information with strength rating
- Trend analysis score from multiple factors
- Multi-timeframe candle direction
- Trade recommendation based on confluence

Trend Analysis Scoring

The indicator calculates a score based on:
- HTF trend alignment with zone direction
- Trading session quality
- Volume confirmation
- Zone freshness
- Price proximity to zone
- Moving average structure
- Multi-timeframe candle alignment

Recommendations range from High Probability to Weak based on the total score.

Recommended Settings

The indicator works on any timeframe. Default settings are optimized for XAUUSD but can be adjusted for other instruments. Validation period of 5-10 bars is recommended to filter false signals.

Input Parameters

Detection Settings: Tick window, threshold points, standard deviation multiplier, cooldown period
Candle Detection: ATR period, candle multiplier for large candle detection  
Strength Boosters: HTF period, volume multiplier, session filtering options
Validation: Number of bars required for zone confirmation
Zone Display: Colors, extension settings, midline and strength label options
Dashboard: Position, colors, enable/disable options
Alerts: Sound, push notification, alert on detection/signal/flip


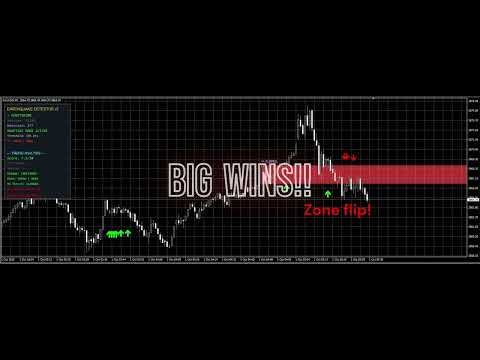
SCREENSHOTS TO INCLUDE:
-----------------------
1. Main chart view showing detected zone with dashboard
2. Buy signal example with zone touch rejection
3. Sell signal example with zone touch rejection
4. Dashboard close-up showing all trend analysis factors
5. Settings/inputs panel


TAGS TO USE:
------------
indicator, liquidity, zones, institutional, smart money, trend analysis, multi-timeframe, MTF, support resistance, supply demand, XAUUSD, gold, forex


Recommended products
Alpha Trend sign has been a very popular trading tool in our company for a long time. It can verify our trading system and clearly indicate trading signals, and the signals will not drift. Main functions: Based on the market display of active areas, indicators can be used to intuitively determine whether the current market trend belongs to a trend market or a volatile market. And enter the market according to the indicator arrows, with green arrows indicating buy and red arrows indicating se
"Dynamic Scalping Oscillator" - is an advanced custom Crypto_Forex indicator - efficient Trading tool for MT4!  - New generation of Oscillators - see pictures to check how to use it. - Dynamic Scalping Oscillator has adaptive Oversold/Overbought zones. - Oscillator is an auxiliary tool to find exact entry points from dynamic OverSold/OverBought areas. - Oversold values: below Green line, Overbought values: over Orange line . - This indicator is great to combine with Price Action patterns as we
We present you the indicator "Candle closing counter", which will become your indispensable assistant in the world of trading. That’s why knowing when the candle will close can help: If you like to trade using candle patterns, you will know when the candle will be closed. This indicator will allow you to check if a known pattern has formed and if there is a possibility of trading. The indicator will help you to prepare for market opening and market closure. You can set a timer to create a pre
PZ Harmonacci Patterns
PZ TRADING SLU
3.17 (6)
Trade smarter, not harder: Empower your trading with Harmonacci Patterns This is arguably the most complete harmonic price formation auto-recognition indicator you can find for the MetaTrader Platform. It detects 19 different patterns, takes fibonacci projections as seriously as you do, displays the Potential Reversal Zone (PRZ) and finds suitable stop-loss and take-profit levels. [ Installation Guide | Update Guide | Troubleshooting | FAQ | All Products  ] It detects 19 different harmonic pric
Blahtech Market Profile
Blahtech Limited
4.53 (15)
Was: $249  Now: $99   Market Profile defines a number of day types that can help the trader to determine market behaviour. A key feature is the Value Area, representing the range of price action where 70% of trading took place. Understanding the Value Area can give traders valuable insight into market direction and establish the higher odds trade. It is an excellent addition to any system you may be using. Blahtech Limited presents their Market Profile indicator for the MetaTrader community. Ins
Daily Candle Predictor is an indicator that predicts the closing price of a candle. The indicator is primarily intended for use on D1 charts. This indicator is suitable for both traditional forex trading and binary options trading. The indicator can be used as a standalone trading system, or it can act as an addition to your existing trading system. This indicator analyzes the current candle, calculating certain strength factors inside the body of the candle itself, as well as the parameters of
VR Cub
Vladimir Pastushak
VR Cub is an indicator for getting high-quality entry points. The indicator was developed to facilitate mathematical calculations and simplify the search for entry points into a position. The trading strategy for which the indicator was written has been proving its effectiveness for many years. The simplicity of the trading strategy is its great advantage, which allows even novice traders to successfully trade with it. VR Cub calculates position opening points and Take Profit and Stop Loss targe
Super Reversal Pattern
Parfait Mujinga Ndalika
Super Reversal Pattern Indicator Unlock the power of advanced pattern recognition with our Super Reversal Pattern Indicator. Designed for traders seeking precision and reliability, this indicator identifies one of the most effective reversal patterns in technical analysis, offering a significant edge in your trading strategy. Key Features: Non-Repainting Accuracy: Enjoy the confidence of non-repainting technology. Once a Super Reversal Pattern is detected, it remains static, providing consiste
Introduction It is common practice for professional trades to hide their stop loss / take profit from their brokers. Either from keeping their strategy to the themselves or from the fear that their broker works against them. Using this indicator, the stop loss / take profit points will be drawn on the product chart using the bid price. So, you can see exactly when the price is hit and close it manually.  Usage Once attached to the chart, the indicator scans the open orders to attach lines for t
Auto Fibo Pro m
DMITRII GRIDASOV
"Auto FIBO Pro"   Crypto_Forex  indicator  - is great auxiliary tool in trading! Indicator automatically calculate and place on chart Fibo levels and local trend lines (red color). Fibonacci levels indicate key areas where price can reverse. Most important levels are 23.6%, 38.2%, 50% and 61.8%. You can use it   for reversal scalping  or for zone grid trading. There are plenty of opportunities to  improve your current system using Auto FIBO Pro indicator as well. It has Info Spread Swap Displa
The SMC Venom Model BPR indicator is a professional tool for traders working within the Smart Money (SMC) concept. It automatically identifies two key patterns on the price chart: FVG (Fair Value Gap) is a combination of three candles, in which there is a gap between the first and third candles. It forms a zone between levels where there is no volume support, which often leads to a price correction. BPR (Balanced Price Range) is a combination of two FVG patterns that form a “bridge” - a zone of
Infinity Trend Pro
Yaroslav Varankin
1 (1)
This is a trend indicator without redrawing Developed instead of the binary options strategy (by the color of the Martingale candlestick) Also works well in forex trading When to open trades (binary options) A signal will appear in the place with a candle signaling the current candle It is recommended to open a deal for one candle of the current timeframe M1 and M5 When a blue dot appears, open a deal up When a red dot appears, open a trade down. How to open trades on Forex. When a signal is rec
Fibonacci retracement and extension line drawing tool Fibonacci retracement and extended line drawing tool for MT4 platform is suitable for traders who use  golden section trading Advantages: There is no extra line, no too long line, and it is easy to observe and find trading opportunities Trial version: https://www.mql5.com/zh/market/product/35884 Main functions: 1. Multiple groups of Fibonacci turns can be drawn directly, and the relationship between important turning points can be seen
The Sextet Scalper Pro  is an MT4 indicator that gives signals when new waves are starting in a trend. The trends are calculated using the original " The Sextet " indicator method. You get a free EA to trade with The Sextet Scalper Pro: Free EA . Default settings were optimized on GBPUSD H1 from 2017. EA could be tested on free demo version of The Sextet Scalper Pro, before purchase. Key Features: Uses The Sextet Trend Detection Method which is already a good strategy in itself for detecting lo
Quantum Balance
Adolfina Denysenko
Quantum Balance is a modern arrow indicator that identifies key price reversal points in the market with high accuracy. It is based on a combination of WPR (Williams %R) and RSI (Relative Strength Index), which allows you to identify overbought/oversold moments and enter trades at points of maximum potential. The indicator analyzes price dynamics and market conditions, generating signals only when several confirming factors coincide. This reduces the number of false signals and increases tradin
The Super Arrow Indicator provides non-repainting buy and sell signals with exceptional accuracy. Key Features No repainting – confirmed signals remain fixed Clear visual arrows: green for buy, red for sell Real-time alerts via pop-up, sound, and optional email Clean chart view with no unnecessary clutter Works on all markets: Forex, gold, oil, indices, crypto Adjustable Parameters TimeFrame Default: "current time frame" Function: Sets the time frame for indicator calculation Options: Can be set
[ZhiBiCCI] indicators are suitable for all cycle use, and are also suitable for all market varieties. [ZhiBiCCI] Green solid line is a reversal of bullish divergence. The green dotted line is a classic bullish divergence. [ZhiBiCCI] The solid line to the red is a reverse bearish divergence. The red dotted line is a classical bearish divergence. [ZhiBiCCI] can be set in the parameters (Alert, Send mail, Send notification), set to (true) to send instant signals to the alarm window, email, insta
Noize Absorption Index MT4
Ekaterina Saltykova
5 (1)
Noize Absorption Index - is the manual trading system that measures the difference of pressure between bears forces and bulls forces. Green line - is a noize free index that showing curent situation. Zero value of index shows totally choppy/flat market.Values above zero level shows how powerfull bullish wave is and values below zero measures bearish forces.Up arrow appears on bearish market when it's ready to reverse, dn arrow appears on weak bullish market, as a result of reverse expectation. S
Volume Profile Sniper v11.1 is a comprehensive market analysis tool A professional approach to trading Volume Profile Sniper v11.1 combines more than 15 key filters in one indicator, providing clear signals based on a comprehensive assessment of the market situation. Main features Volume imbalance analysis – the algorithm calculates the share of buyers and sellers in each candle, signaling the predominance of one of the parties (configurable threshold from 50% to 90%). Multilevel signal filte
"Impulses and Corrections 4" is created to help traders navigate the market situation. The indicator shows multi-time frame upward and downward "Impulses" of price movements. These impulses are the basis for determining the "Base" , which is composed of zones of corrections of price movements, as well as "Potential" zones for possible scenarios of price movement. Up and down impulses are determined based on a modified formula of Bill Williams' "Fractals" indicator. The last impulse is always "U
RSI Speed mp
DMITRII GRIDASOV
Crypto_Forex   Indicator "RSI SPEED" for MT4 - great predictive tool , No Repaint. The calculation of this indicator is  based on equations from physics . RSI SPEED is the  1st derivative of RSI  itself. RSI SPEED is   good for scalping entries   into the direction of main trend. Use it   in combination   with suitable   trend indicator , for example HTF MA (as on pictures). RSI SPEED indicator shows how fast RSI itself changes its direction   - it is very sensitive . It is recommended to use RS
Quantum Falcon Signal Free is a smart visual trading indicator for MetaTrader 4 designed for Forex and Gold traders. The indicator combines: • Trend analysis • RSI momentum confirmation • MACD momentum filtering • ATR volatility filtering • Higher timeframe confirmation • Smart exit signal detection Main Features: • Smart Buy and Sell signals • Exit Buy / Exit Sell alerts • Real-time dashboard on chart • Professional candle arrows • Multi-timeframe trend confirmation • ATR market volatility filt
FREE
Forex Gump
Andrey Kozak
2.4 (5)
Forex Gump is a fully finished semi-automatic trading system. In the form of arrows, signals are displayed on the screen for opening and closing deals. All you need is to follow the instructions of the indicator. When the indicator shows a blue arrow, you need to open a buy order. When the indicator shows a red arrow, you need to open a sell order. Close orders when the indicator draws a yellow cross. In order to get the most effective result, we recommend using the timeframes H1, H4, D1. There
KT Renko Patterns MT4
KEENBASE SOFTWARE SOLUTIONS
2.33 (3)
KT Renko Patterns scans the Renko chart brick by brick to find some famous chart patterns that are frequently used by traders across the various financial markets. Compared to the time-based charts, patterns based trading is easier and more evident on Renko charts due to their uncluttered appearance. KT Renko Patterns features multiple Renko patterns, and many of these patterns are extensively explained in the book titled Profitable Trading with Renko Charts by Prashant Shah. A 100% automated
Binary Options Support Resistance Indicator This indicator is designed for binary options trading and effectively shows retracements from support and resistance levels. Signals appear on the current candle. A red arrow pointing downwards indicates a potential selling opportunity, while a blue arrow pointing upwards suggests buying opportunities. All that needs adjustment is the color of the signal arrows. It is recommended to use it on the M1-M5 timeframes as signals are frequent on these timef
Shark Deal Book
Philip Pankaj Suthagar
4 (3)
Term  "shark"  in the business world denotes a high volume investor who just made a good investment in a highly Potential business deal.So, sharks are the ones who make the market move. In our case, if an American shark bought a Japanese company, he/she has to convert American dollars into Japanese yen to make the deal. So, the demand for the Japanese yen will increase sharply. Thus USD/JPY will go short rapidly if the deal was from the shark. Another example, In the case of forex, if fed increa
Heiken Ashi candle chart is an improved version of The Japanese candle chart, which can effectively filter the market "noise" of the Japanese candle chart. It is favored by many traders for its simplicity and intuition. For trend traders, the HA candle chart is a magic tool. Unlike the traditional Japanese candle chart, Heikenashi does not reflect the opening price, high price, low price and closing price of the market. Instead, Heikenashi calculates the value of a single K line in the dominant
Title : Market Bias Indicator - Oscillator-Based Trading Tool Introduction : Discover the potential of the "Market Bias Indicator," a revolutionary oscillator-based trading tool designed for precise market analysis. If you're in search of a robust alternative to traditional bias indicators, your quest ends here. Market Bias Indicator offers unparalleled accuracy in identifying market sentiment and is your gateway to confident trading decisions. Recommended Trading Pairs : Market Bias Indicator i
Price Magnet — Price Density and Attraction Levels Indicator Price Magnet is a professional analytical tool designed to identify key support and resistance levels based on statistical Price Density. The indicator analyzes a specified historical period and detects price levels where the market spent the most time. These zones act as “magnets,” attracting price action or forming a structural base for potential reversals. Unlike traditional Volume Profile tools, Price Magnet focuses on price-time d
Description The Market Profile & Volume Profile Indicator is a powerful technical analysis tool designed to visualize market activity and price distribution over specific timeframes. Unlike standard technical indicators that focus solely on price over time, this indicator organizes price data to show where the market spent the most time (TPO) and where the most volume was traded (Volume Profile). It automatically calculates and displays key structural levels such as the Point of Control (POC) ,
Buyers of this product also purchase
The Propfolio Master Suite is the ultimate all-in-one analytical workstation for professional traders. Combining the power of the Beat The Market Maker (BTMM) methodology, Smart Money Concepts (SND/Liquidity), and Advanced Volume Profile, this suite replaces multiple different indicators with one optimized engine. Monitor up to 14 pairs simultaneously from a single chart, instantly identify market cycles, and seamlessly map institutional footprints with the click of a button. The Command Center
Scalper Inside PRO
Alexey Minkov
4.74 (69)
Scalper Inside PRO Scalper Inside PRO is an intraday trend and scalping indicator for MetaTrader 4 that uses an exclusive algorithm to quickly detect market direction and key target levels. It automatically calculates entry, exit and multiple profit targets, and shows detailed performance statistics so you can see how different instruments and strategies performed. This helps you choose the most suitable trading instruments for the current market conditions. Additionally, you can easily integrat
NAM Order Blocks
NAM TECH GROUP, CORP.
3.67 (3)
MT4 Multi-timeframe Order Blocks detection indicator. Features - Fully customizable on chart control panel, provides complete interaction. - Hide and show control panel wherever you want. - Detect OBs on multiple timeframes. - Select OBs quantity to display. - Different OBs user interface. - Different filters on OBs. - OB proximity alert. - ADR High and Low lines. - Notification service (Screen alerts | Push notifications). Summary Order block is a market behavior that indicates order collection
First of all Its worth emphasizing here that this Trading Tool is Non-Repainting Non-Redrawing and Non-Lagging Indicator Which makes it ideal for professional trading . [Online course] ,   and   [manual] The Smart Price Action Concepts Indicator is a very powerful tool for both new and experienced traders . It packs more than 20 useful indicators into one combining advanced trading ideas like Inner Circle Trader Analysis and Smart Money Concepts Trading Strategies . This indicator focuses on Sm
Quants HL Break
Ferhat Mutlu
5 (2)
Advanced calculation made by pure price action to find LH and HL breakouts. It will give you a great reversal points in the market. LH and HL signals can used for the traingle breakouts as well. Once breakout happens its indicate strong reversal. Nice filter for Moving Averages. I highly suggest to use that with trend indicators. Can be used as an extra confirmation for support and resistance , supply demand indicators. The indicator is not repainting. Buffers :   SetIndexBuffer ( 0 ,UpBar);
Dynamic Forex28 Navigator
Bernhard Schweigert
4.43 (7)
Specials Discount now. The Next Generation Forex Trading Tool. Dynamic Forex28 Navigator is the evolution of our long-time, popular indicators, combining the power of three into one: Advanced Currency Strength28 Indicator (695 reviews) + Advanced Currency IMPULSE with ALERT (520 reviews) + CS28 Combo Signals (recent Bonus) Details about the indicator  https://www.mql5.com/en/blogs/post/758844 What Does The Next-Generation Strength Indicator Offer? Everything you loved about the originals, now
RFI levels PRO
Roman Podpora
5 (1)
The indicator accurately shows the reversal points and price return zones where the   Major players . You see where new trends are forming and make decisions with maximum precision, maintaining control over every trade. VERSION MT5     -     Reveals its maximum potential when combined with the   TREND LINES PRO   indicator What the indicator shows: Reversal structures and reversal levels with activation at the beginning of a new trend. Display of   TAKE PROFIT   and   STOP LOSS   levels with mi
Grabber System
Ihor Otkydach
5 (2)
Let me introduce you to an excellent technical indicator – Grabber, which works as a ready-to-use "All-Inclusive" trading strategy. Within a single code, it integrates powerful tools for technical market analysis, trading signals (arrows), alert functions, and push notifications. Every buyer of this indicator also receives the following for free: Grabber Utility for automatic management of open orders Step-by-step video guide: how to install, configure, and trade with the indicator Custom set fi
GoldRush Trend Arrow Signal V1.6 The GoldRush Trend Arrow Signal indicator V1.6 continues to provide precise, real-time trend analysis tailored for high-speed, short-term scalpers in XAU/USD , but it now has additional features and improved efficiency and reliability. Built specifically for the 1-minute time frame, this tool displays directional arrows for clear entry points, allowing scalpers to navigate volatile market conditions with confidence. The indicator consists of PRIMARY and SECONDARY
Introduction to Fractal Pattern Scanner Fractal Indicator refers to the technical indicator that makes use of the fractal geometry found in the financial market. Fractal Pattern Scanner is the advanced Fractal Indicator that brings the latest trading technology after the extensive research and development work in the fractal geometry in the financial market. The most important feature in Fractal Pattern Scanner is the ability to measure the turning point probability as well as the trend probabi
Cycle Sniper
Elmira Memish
4.39 (36)
Please contact us after your purchase and we will send you the complimentary indicators to complete the system Cycle Sniper is not a holy grail but when you use it in a system which is explained in the videos, you will feel the difference. If you are not willing to focus on the charts designed with Cycle Sniper and other free tools we provide, we recommend not buying this indicator. We recommend watching the videos about the indiactor and system before purchasing. Videos, settings  and descri
Route Lines Prices is an indicator designed for finding price directions. Its simple interface contains multiple algorithms for price behavior and future direction calculations. These algorithms include volatility calculations and price smoothing based on the timeframes used. The indicator has a single parameter for changing the " Calculating Price Values " value. The default value of 1 provides a balanced automatic calculation, which can be used without manually configuring the indicator. By m
Technical indicator that structures charts and identifies cyclical price movements. Can work on any charts. Several types of alerts. There are additional arrows on the chart itself. Without redrawing on history, works on closing a candle. Recommended TF from M5 and higher. Easy to use and configure parameters. When using 2 indicators with different parameters, you can use without other indicators. Has 2 input parameters Cyclicality and Signal duration These 2 parameters work with the processin
KuKl
IGOR KIRIANEN
The indicator is built on a non-standard Zig Zag, it draws accumulations after which if the price leaves this zone and a test of this zone occurs, then a sound signal is given and an arrow appears - after the test candle closes.The indicator does not redraw its signals, it is very easy to use, there are only three settings 1- this is the zig zag parameter 2- this is the minimum price exit from the zone 3- this is the maximum price exit from the zone. The lower the parameter for Zig Zag, the more
NAM Divergences
NAM TECH GROUP, CORP.
5 (1)
MT4 Multi-timeframe Divergence and Overbougt/Oversold detection indicator. Features - Fully customizable on chart control panel, provides complete interaction. - Hide and show control panel wherever you want. - Real time information about non-capitalized divergences. - Real time information about overbougt / oversold situations. - Real time information about regular divergences. - Real time information about hidden divergences. - Oscillators available for divergences detection: AO, RSI, CCI, MA
Super Signal – Skyblade Edition Professional No-Repaint / No-Lag Trend Signal System with Exceptional Win Rate | For MT4 / MT5 It works best on lower timeframes, such as 1-minute, 5-minute, and 15-minute charts. Core Features: Super Signal – Skyblade Edition is a smart signal system designed specifically for trend trading. It applies a multi-layered confirmation mechanism to detect only strong, directional moves supported by real momentum. This system does not attempt to predict tops or bottoms
Gold Channel is a volatility-based indicator, developed with a specific timing algorithm for the XAUUSD pair, which consists of finding possible corrections in the market. This indicator shows two outer lines, an inner line (retracement line) and an arrow sign, where the theory of the channel is to help identify overbought and oversold conditions in the market. The market price will generally fall between the boundaries of the channel. If prices touch or move outside the channel it is a tradi
The " Dynamic Scalper System " indicator is designed for the scalping method of trading within trend waves. Tested on major currency pairs and gold, compatibility with other trading instruments is possible. Provides signals for short-term opening of positions along the trend with additional price movement support. The principle of the indicator. Large arrows determine the trend direction. An algorithm for generating signals for scalping in the form of small arrows operates within trend waves.
GOLD Impulse with Alert
Bernhard Schweigert
4.67 (12)
This indicator is a super combination of our 2 products  Advanced Currency IMPULSE with ALERT  and  Currency Strength Exotics . It works for all time frames and shows graphically impulse of strength or weakness for the 8 main currencies plus one Symbol! This Indicator is specialized to show currency strength acceleration for any symbols like Gold, Exotic Pairs, Commodities, Indexes or Futures. Is first of its kind, any symbol can be added to the 9th line to show  true currency strength accelerat
Miraculous Indicator – 100% Non-Repaint Forex and Binary Tool Based on Gann Square of Nine This video introduces the Miraculous Indicator , a highly accurate and powerful trading tool specifically developed for Forex and Binary Options traders. What makes this indicator unique is its foundation on the legendary Gann Square of Nine and Gann's Law of Vibration , making it one of the most precise forecasting tools available in modern trading. The Miraculous Indicator is fully non-repaint, meaning t
Quantum Breakout Indicator PRO
Bogdan Ion Puscasu
4.96 (26)
Introducing   Quantum Breakout PRO , the groundbreaking MQL5 Indicator that's transforming the way you trade Breakout Zones! Developed by a team of experienced traders with trading experience of over 13 years, Quantum Breakout PRO is designed to propel your trading journey to new heights with its innovative and dynamic breakout zone strategy. Quantum Breakout Indicator will give you signal arrows on breakout zones with 5 profit target zones and stop loss suggestion based on the breakout box. I
Trend Signal Advanced System - is a trading system operating within a trend channel, detecting price movements following a trend correction. The signal search algorithm operates on the current price candle, generating signals at the highs and lows of the last candle. It includes integrated built-in indicators and filters. It allows you to find trading signals based on the intraday trend-correction system, detecting short- and medium-term movements. The system features a trend detector based on
IQ FX Gann Levels a precision trading indicator based on W.D. Gann’s square root methods . It plots real-time, non-repainting support and resistance levels to help traders confidently spot intraday and scalping opportunities with high accuracy. William Delbert Gann (W.D. Gann) was an exceptional market analyst, whose trading technique was based on a complex blend of mathematics, geometry, astrology, and ancient mathematics which proved to be extremely accurate. Setup & Guide:  Download  MT5 Ver
Precautions for subscribing to indicator This indicator only supports the computer version of MT4 Does not support MT5, mobile phones, tablets The indicator only shows the day's entry arrow The previous history arrow will not be displayed (Live broadcast is for demonstration) The indicator is a trading aid Is not a EA automatic trading No copy trading function The indicator only indicates the entry position No exit (target profit)  The entry stop loss point is set at 30-50 PIPS Or the front hi
Volatility Trend System - a trading system that gives signals for entries. The volatility system gives linear and point signals in the direction of the trend, as well as signals to exit it, without redrawing and delays. The trend indicator monitors the direction of the medium-term trend, shows the direction and its change. The signal indicator is based on changes in volatility and shows market entries. The indicator is equipped with several types of alerts. Can be applied to various trading ins
Apex Edge No Repaint Professional Non-Repainting Trading Indicator for MT4 Apex Edge No Repaint is a premium, clean, and reliable trading tool designed for serious forex and cryptocurrency traders who want clear signals without the frustration of repainting arrows. Key Features: 100% No Repaint – Signals remain fixed once they appear on the chart Dual signal system: RAW signals for early opportunities and CONF signals for high-probability confirmed entries Simple one-click toggle buttons: RAW ON
Panther Trade Scenario — displays a clear trade scenario directly on the chart. The indicator removes the main problem in trading — uncertainty at the moment you need to act. Instead of trying to guess the best timing, you see exactly: where to enter, where to limit risk, and where to take profit.   Why most trading mistakes happen at the entry The problem is not that you don’t understand the market. In most cases, it looks like this: you see the move, understand the direction, but at the moment
This indicator has been designed to integrate with the Elliott Wave theory, providing two distinct methods of operation: Automatic Work: In this mode, the indicator operates autonomously by detecting all five motive waves on the chart according to Elliott Wave theory. It offers predictions and identifies potential reversal zones. Additionally, it has the capability to generate alerts and push messages to notify traders of significant developments. This automated functionality streamlines the pro
Please send me Direct message on MQL5 CHAT after purchasing the Indicator for Training and Installation Support There are some additional files that is important to use with the Indicator . So be sure to contact me after purchasing the Indicator So that I can add you for training and support . If you find any difficulty with installation then send me Direct message here So that I can connect with you via Anydesk or Teamview for the product installation. " Smart Order Block Indicator " to find m
KT Alpha Hunter Arrows MT4
KEENBASE SOFTWARE SOLUTIONS
Most arrow indicators give you a signal and leave you to figure out the rest. KT Alpha Hunter Arrows gives you the full trading plan. Every signal arrow prints with a full plan already drawn: entry line, stop-loss, four take-profit levels, and a live edge verdict telling you whether this symbol and time-frame is worth trading right now. An included Trade Manager EA handles the execution after you enter, so discipline stays intact when the market gets loud. Non-repaint. Closed-bar signals only. B
More from author
DTM Hypertrend
Gabor Bocsak
5 (1)
Hypertrend is a visual indicator which will color the candles according to the strength of the trend with confirmation arrows. It also draws the Ichimoku cloud, and daily important levels. The indicator checks 2 moving averages , Rsi and Macd and colors the candles accordingly. Confirmation arrow will appear if there is a pullback and an ENGULFING candle is formed. Strategy: Possible long trade: Early entry: Candle is green, above the  Ichimoku cloud + 200 moving average, and confirmation arrow
Follow the trend is a visual indicator which will color the candles according to the RSI algorithm  and gives you recommended  FVG entry points and recommended stoploss. NON REPAINTING! A confirmation arrow will appear on the first new Fair Value Gap formed! Best used :   5 minute timeframe or higher !    Trend Panel: FVG : Last fair value gap. Span : above , below or inside the Ichimoku cloud. Rsi: RSI algorithm section You can easily grab and move the panel on the chart! By looking at the pane
Filter:
No reviews
Reply to review