YouTube'dan Mağaza ile ilgili eğitici videoları izleyin
Bir alım-satım robotu veya gösterge nasıl satın alınır?
Uzman Danışmanınızı
sanal sunucuda çalıştırın
sanal sunucuda çalıştırın
Satın almadan önce göstergeyi/alım-satım robotunu test edin
Mağazada kazanç sağlamak ister misiniz?
Satış için bir ürün nasıl sunulur?
MetaTrader 4 için teknik göstergeler - 5
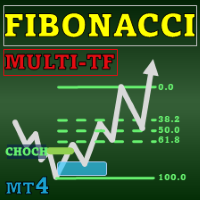
Special offer : ALL TOOLS , just $35 each! New tools will be $30 for the first week or the first 3 purchases ! Trading Tools Channel on MQL5 : Join my MQL5 channel to update the latest news from me Fibonacci Confluence Toolkit Multi-Timeframe , profesyonel traderlar için tasarlanmış gelişmiş bir teknik analiz aracıdır ve ana piyasa sinyalleri ile kalıplarını birleştirerek potansiyel fiyat dönüş bölgelerini belirlemenize yardımcı olur. Timeframe Selector panosu üzerinden çok zaman d
Trend takibi, yatırımcıların fiyatın ana hareket yönünde pozisyon almayı ve trend değişene kadar bu pozisyonu tutmayı amaçladığı bir stratejidir. Anti EMA MT4, MetaTrader 4 terminali için profesyonel bir indikatördür ve bu tür bir işlemde faydalı bir araç olabilir; çünkü uzun vadeli fiyat verilerine odaklanır, sürdürülebilir hareketleri görmeyi kolaylaştırır ve kısa vadeli dalgalanmaların neden olduğu yanlış sinyallerden kaçınmayı sağlar. MetaTrader 5 terminali için Anti EMA sürümü: https://ww
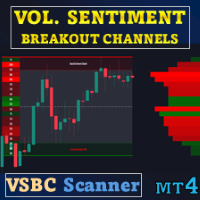
Özel teklif : ALL TOOLS , her biri sadece $35 . Yeni araçlar ilk hafta veya ilk 3 alışveriş için $30 olacaktır! Trading Tools Channel on MQL5 : MQL5 kanalına katılın, benden gelen en son haberleri alın Volume Sentiment Breakout Channels , dinamik fiyat kanalları içindeki hacim duyarlılığına dayalı kırılma bölgelerini görselleştiren bir göstergedir. Kırılmayı yalnızca basit bir teknik fiyat olayı olarak ele almak yerine, alış/satış hacminin konsolidasyon bölgeleri içinde nasıl dağıl
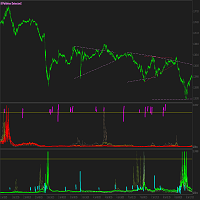
Hello Guys, WinningSpell Indicator (No Repaint) shows Buyers and Sellers activity on any given chart and timeframe of any quote that is available in MT4 platform. It calculates those values by a sophisticated formulae that I have discovered a long time ago and improved over the years. It uses OHLCV values of every M1 bar to make the calculation for any timeframe by a formulae and represents those values via oscillator creating waves of spikes. It can be easily used as a system by its own, or be
SL Curruncy impulse https://www.mql5.com/en/market/product/82593 SL Session Strength 28 Pair flow of this intraday Asian London New York Sessions strength.SL Session Strength 28 indicator best for intraday scalper. market powerful move time you can catch best symbol. because you'll know which currencies are best to trade at that moment. Buy strong currencies and sell weak currencies (Diverging currencies). Suggested timeframes to trading : M5 - M15 - M30 - You can however just change session

Açıklama (MT4)
Bu gösterge, bir mum çubuğunun Bollinger Bantları'nın dışına çıkmasının ardından fiyatın tekrar içeri girdiği “reentry” anlarını tespit eder ve yanlış pozitifleri azaltmak için isteğe bağlı bir RSI teyidiyle birleştirir.
Buy ReEntry sinyali, fiyat alt banda inip sonra tekrar içeri döndüğünde üretilir; isteğe bağlı olarak RSI’nın oversold (aşırı satım) durumundan çıkmış olmasıyla teyit edilir.
Sell ReEntry sinyali ise fiyat üst bandın üzerine çıkıp tekrar içeri döndüğünde ve RSI’n
FREE
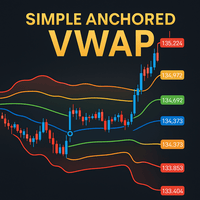
Simple Anchored VWAP is a lightweight yet powerful tool designed for traders who want precise volume-weighted levels without complexity.
This indicator lets you anchor VWAP from any point on the chart and instantly see how price reacts around institutional volume zones. MT5 Version - https://www.mql5.com/en/market/product/155321/
Join To Learn Market Depth - https://www.mql5.com/en/channels/suvashishfx Using VWAP bands and dynamic levels, the tool helps you understand where real buying and s
FREE

Was: $299 Now: $99 Supply Demand uses previous price action to identify potential imbalances between buyers and sellers. The key is to identify the better odds zones, not just the untouched ones. Blahtech Supply Demand indicator delivers functionality previously unavailable on any trading platform. This 4-in-1 indicator not only highlights the higher probability zones using a multi-criteria strength engine, but also combines it with multi-timeframe trend analysis, previously confirmed swings

The Forex Master Pattern is an alternative form of technical analysis that provides a framework which will help you to find and follow the hidden price pattern that reveals the true intentions of financial markets. This algorithm here does a good job detecting the Phase 1 of the Forex Master Pattern cycle, which is the contraction point (or Value).
On Phase 2 we get higher timeframe activation (also called Expansion), which is where price oscillates above and below the average price defined

This indicator is SO SIMPLE… when the green Rise Coming arrow appears, a price drop may be on the way! Plain and easy profits! As you receive more than one 'Rise Coming' text signal in a downtrend, it means momentum is building larger for a bull run. HOW TO USE 1. When the green "Rise Coming" text appears, a price jump may be on the way! This indicator Never Repaints! To get the best setting it's a matter of tweaking the indicator until it gives you the best results. Our recommendation, and what
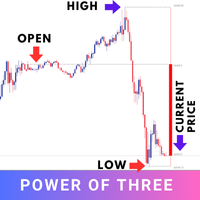
The "Power of Three" (PO3) is a concept developed by the Inner Circle Trader (ICT) to illustrate a three-stage approach used by smart money in the markets: Accumulation, Manipulation, and Distribution . ICT traders view this as a foundational pattern that can explain the formation of any candle on a price chart. In simple terms, this concept is effective for any time frame, as long as there's a defined start, highest point, lowest point, and end. MT5 - https://www.mql5.com/en/market/product/124
FREE

Önemli Bölge Dedektörü (Key Zone Detector)
Arz ve Talep Seviyesi Dedektörü (Key Level Supply & Demand Zone Detector) Genel Bakış (Overview)
Piyasada önemli faaliyetlerin gerçekleştiği kilit fiyat seviyelerini tanımlayan ve değerlendiren sofistike bir arz ve talep bölgesi tespit göstergesi. Gösterge, işlem bölgelerini tespit etmek ve sınıflandırmak için fraktal analiz ve çoklu doğrulama yöntemleri kullanır. Temel Özellikler (Key Features) Bölge Tespiti (Zone Detection) Destek ve direnç bölgeler
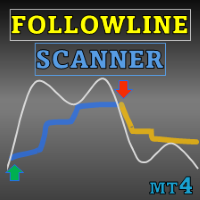
Special offer : ALL TOOLS , just $35 each! New tools will be $30 for the first week or the first 3 purchases ! Trading Tools Channel on MQL5 : Join my MQL5 channel to update the latest news from me Volatiliteye dayalı gelişmiş bir gösterge olan Follow Line ve Tarayıcı ile ticaret avantajınızı en üst düzeye çıkarın. Bu araç, özelleştirilebilir ayarlarla Bollinger Bantlarının gücünü birleştirir ve fiyat hareketlerine ilişkin hassas bilgiler sunar. See more MT5 version at: Follow Li
FREE
Advanced UT BOT ALERTS for MT4 Profesyonel Çok Katmanlı Trend Tespit Sistemi | Geliştirilmiş UT BOT Motoru Yalnızca yüksek kaliteli göstergeler sunuyoruz. Advanced UT BOT , profesyonel kullanım için tasarlanmıştır.
Kararlı sinyal mantığı ve güvenli hesaplama yapısı sayesinde gecikme veya hatalı güncelleme olmaz.
Geçmiş sinyalleri yeniden çizmez, değiştirmez veya silmez.
Tüm BUY ve SELL sinyalleri mum kapanışı gerçekleştikten sonra oluşturulur ve sabitlenir.
Canlı işlem sırasında repaint yoktur

Bu İndikatörün Avantajları: Bu, Akıllı Para Kavramları (SMC) tarzı ticaret için tasarlanmış, fiyat sıkışmalarını (Yatay seyir/Range) ve Kırılımları (Breakout) derinlemesine hacim analizi ile birlikte bulan bir araçtır. Otomatik Aralık Tespiti (Automated Range Detection): Elle çizmeye gerek yok: Piyasa yataya bağladığında kutuları/kanalları otomatik çizer. Önemli Bölgeler: SMC'nin temeli olan Birikim (Accumulation) ve Dağıtım (Distribution) bölgelerini netleştirir. Hacim Detay Analizi (Volume Bre

Market Structure ICT İndikatörü 1. Otomatik Piyasa Yapısı (Market Structure) En büyük avantajı, öznel yorumlamadan kaynaklanan hataları azaltmasıdır. Hassas Trend Tespiti: Trend devamı için BOS (Yapı Kırılımı) ve trend dönüşü için CHoCH (Karakter Değişimi) noktalarını otomatik olarak belirler. Swing Sınıflandırması: Kullanıcı, piyasa yapısı türünü (Kısa, Orta veya Uzun vadeli) seçebilir, bu da hem Scalperlar hem de Swing Traderlar için uygundur. 2. Profesyonel Gösterge Paneli (Dashboard) Diğer z
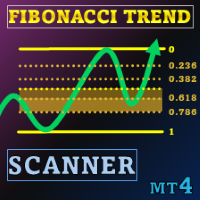
Özel Fırsat : ALL TOOLS , her biri sadece $35 ! New tools will be $30 for the first week or the first 3 purchases ! Trading Tools Channel on MQL5 : Join my MQL5 channel to update the latest news from me Volatil bir işlem ortamında, güçlü ve sezgisel bir analiz aracı fırsatları hızla yakalamanıza yardımcı olabilir. Fibonacci Trend Scanner, sadece geleneksel Fibonacci indikatörü ve SuperTrend işlevlerini bir araya getirmekle kalmaz, aynı zamanda para birimi taraması, çoklu zaman dili

Moving Average Crossover Scanner and Dashboard Advanced Moving Average Scanner Moving Average Crossover Dashboard The indicator scans the market and sends signals and alerts for Moving Averages crossovers, death cross and golden cross. Crossovers are one of the main moving average ( MA ) strategies. MA Crossover ( cut ) strategy is to apply two moving averages to a chart: one longer and one shorter. When the shorter-term ( fast MA ) MA crosses above the longer-term ( slow MA ) MA, it's a buy sig

The Moving Average Convergence Divergence (MACD) işlem stratejisi, momentum ve trend yönündeki değişiklikleri belirlemek için kullanılan popüler bir teknik analiz aracıdır. MACD, 26 periyotlu üssel hareketli ortalamanın (EMA) 12 periyotlu EMA'dan çıkarılmasıyla hesaplanır. Ardından, "sinyal çizgisi" olarak adlandırılan 9 periyotlu EMA MACD'nin üzerine çizilir ve alım satım sinyalleri için bir tetikleyici olarak görev yapar. MACD, MACD hattı sinyal çizgisinin üzerindeyken boğa bölgesinde ve altın
FREE
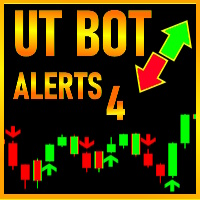
Good old UT BOT converted from TradingView script by ' QuantNomad ', initially by ' Yo_adriiiiaan ' and ' HPotter ' - so you can bet this is powerful tool. If you know, you know. This is top of the line, while keeping it really simple.
Main function: trend identification with trend switch points , created by EMA(source) and ATR -source is CLOSE PRICE with option to use HEIKEN ASHI chart instead, for this you need "Heiken Ashi" indicator - its available as free download by MetaQuotes
One of th
FREE

ICT, SMC, SMART MONEY CONCEPTS, SMART MONEY, Smart Money Concept, Support and Resistance, Trend Analysis, Price Action, Market Structure, Order Blocks, BOS/CHoCH, Breaker Blocks , Momentum Shift, Supply&Demand Zone/Order Blocks , Strong Imbalance, HH/LL/HL/LH, Fair Value Gap, FVG, Premium & Discount Zones, Fibonacci Retracement, OTE, Buy Side Liquidity, Sell Side Liquidity, BSL/SSL Taken, Equal Highs & Lows, MTF Dashboard, Multiple Time Frame, BigBar, HTF OB, HTF Market Structure,

This indicators automatically draws the Trend Channels for you once you've dropped it on a chart. It reduces the hustle of drawing and redrawing these levels every time you analysis prices on a chart. With it, all you have to do is dropped it on a chart, adjust the settings to your liking and let the indicator do the rest. Get an alternative version of this indicator here: https://youtu.be/lt7Wn_bfjPE For more free stuff visit: https://abctrading.xyz
Parameters 1) Which trend do you want t
FREE
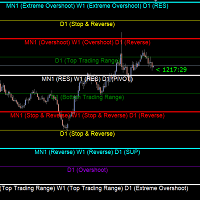
Gold Levels MTF - this is a fine stock technical indicator. The indicator algorithm analyzes the movement of the asset price, displays price levels of support and resistance from all time frames (TF) using the Murray method based on the Gann theory. The indicator indicates overbought and oversold fields, giving an idea of possible reversal points and at the same time giving some idea of the strength of the current trend. Description of levels: (Extreme Overshoot) - these levels are the ultimat
FREE

We mark the fair value gap (FVG) and wait for the price to reach that zone, but sometimes it reverses before getting there. This can happen because we didn't notice the Balanced Price Range (BPR). My tools will enhance your analysis by displaying everything on the chart, helping you identify potential price reversal areas so you can make informed decisions about when to enter the market. MT5 - https://www.mql5.com/en/market/product/119228/ So, what is BPR or Balanced Price Range? A Balanced Pr

LİKİDİTE ŞOK DEDEKTÖRÜ (XAUUSD 1 Dakika Sürümü) ====================================================
KISA AÇIKLAMA: ---------------------------------- Ani fiyat hareketleriyle oluşan kurumsal likidite bölgelerini tespit eder ve çoklu zaman diliminde trend analizi sağlar.
TAM AÇIKLAMA: -----------------
Likidite Şok Dedektörü, genellikle kurumsal aktiviteyi gösteren önemli fiyat hareketlerini belirler. Büyük piyasa katılımcıları pozisyonlara girip çıktıklarında, fiyatın sık sık tekrar ziyaret
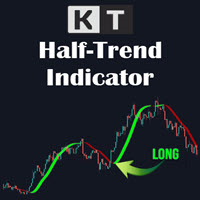
KT HalfTrend, hareketli ortalamaya dayalı bir trend göstergesidir ve grafik üzerinde bölgeler çizer. Trendin değiştiğini, yükseliş ve düşüş geçersizlik bölgelerini göstererek belirtir. Ana grafikte oklarla alım-satım gücünü de görüntüler. Eğer trend yoksa, gösterge yatay olur — bu da birikim, geçici fiyat hareketi veya dağıtım bölgelerine işaret eder. Eğer trend varsa, o yönde bir eğim gösterir. Eğim ne kadar dikse, trend sinyali o kadar güçlüdür — ister yukarı ister aşağı yönlü. Güçlü bir yükse

TREND FLOW PRO TREND FLOW PRO , piyasa yönünü gösteren ve yeniden çizim yapmayan (non-repainting) bir göstergedir. Trend dönüşlerini ve büyük piyasa katılımcılarının ilk ve tekrar eden girişlerini tespit eder. Grafikteki BOS işaretleri, gerçek trend değişimlerini ve üst zaman dilimlerine ait kilit seviyeleri temsil eder. Veriler yeniden çizilmez ve her mum kapanışından sonra grafikte kalır. Özel mesajlar aracılığıyla strateji örnekleri içeren detaylı bir PDF kılavuzu talep edin ve alın. Gösterge
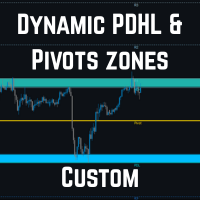
AutoPivot – Otomatik Pivot Noktaları Göstergesi MT4 göstergesi, pivot noktalarını (PP, R1/R2/R3, S1/S2/S3) ve önceki günün seviyelerini (PDH/PDL) gösterir. Ana özellikler: Grafiğin zaman dilimine (H4/D1/W1) göre otomatik uyum PDH/PDL ile en yakın destek/direnç seviyesi arasındaki bölgeler 8 önceden ayarlanmış renk teması Renkler, çizgi stilleri ve bölge saydamlığı tamamen özelleştirilebilir Fiyat gösterimi isteğe bağlı kompakt etiketler Yapılandırılabilir otomatik güncellemeler Seviyeler, standa
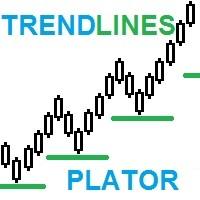
TrendLines Plator: Gelişmiş Eğilim Projeksiyon Göstergesiyle Ticaret Stratejilerinizi Güçlendirin Yenilikçi göstergemizin potansiyelini keşfedin! Daha geniş zaman aralıklarındaki eğilim çizgilerini doğrudan mevcut zaman aralığınıza analiz edebilme ve projekte edebilme yeteneği, genel olarak tüccarların dikkatini çeken stratejik bir destek sunar. Bu noktalar, işlemleriniz için stratejik destek veya direnç seviyelerine dönüşür ve ticaret stratejinizi güçlendirir. Price action göstergeleri koleksiy
RSI Çoklu Para Birimi Tarayıcı Panosu MT4 , Göreceli Güç Endeksi (RSI) kullanarak birden fazla döviz çifti ve zaman diliminde sinyalleri izlemek için tasarlanmış güçlü bir işlem aracıdır. Sinyalleri semboller ve zaman dilimlerine (M1'den MN1'e kadar) göre düzenleyen bir ızgara formatı sunar. Traderlar, stratejilerine uygun olarak belirli zaman dilimlerini etkinleştirebilir veya devre dışı bırakabilir, böylece hassas ve verimli piyasa analizi sağlar. Araç, aşağıdaki RSI stratejilerine dayalı siny
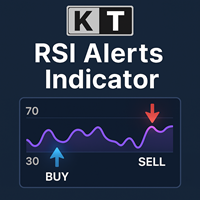
KT RSI Alerts, RSI (Göreceli Güç Endeksi) osilatörünün kişiselleştirilmiş bir versiyonudur ve aşağıdaki dört özel duruma dayalı olarak sinyaller ve uyarılar sağlar: RSI aşırı alım bölgesine girdiğinde. RSI aşırı alım bölgesinden çıktığında. RSI aşırı satım bölgesine girdiğinde. RSI aşırı satım bölgesinden çıktığında.
Özellikler RSI’nin aşırı alım/aşırı satım bölgelerindeki hareketlerine göre işlem yapan yatırımcılar için mükemmel bir seçimdir. Oldukça hafif kodlanmış olup sistem kaynaklarını mi
MT4 için Para Birimi Gücü Göstergesi , yeni başlayan veya uzman tüccarlar için yenilikçi bir çözümdür! Fiyat hareketi ile birleştirdiği ve 8 ana para biriminin olağan 28 kombinasyonu dışında herhangi bir sembol/çift üzerine uygulanabildiği için para birimi gücü kavramını tamamen yeni bir seviyeye taşıyor. Bu, tüm para birimleri, majör, minör ve egzotikler, emtialar ve kriptolar (endeksler değil) dahil olmak üzere herhangi bir çiftin gücünü veya zayıflığını takas edebileceğiniz anlamına gelir. H

Contact me after payment to send you the User-Manual PDF File.
Triangle Pattern
Sometimes the price cannot make higher highs or lower lows and it moves in a converging price range and waves are shorter than before until the movement creates a geometric shape of a symmetrical triangle, which indicates It is maybe the end of the trend. The triangle pattern is a well-known in forex and the trading plan and strategy of many traders is based on it.
The Triangle Pattern Scanner Indicator It is usu

RSI Divergence Full +10 other divergence indicators
Contact me after payment to send you the User-Manual PDF File. Download the MT5 version here. Also you can download the >>> Hybrid Trading EA <<< that is designed and implemented based on RSI Divergence Indicator. RSI is a pretty useful indicator in itself but it's even more effective when you trade divergence patterns with that. Because the divergence signal of the RSI indicator is one of the most powerful signals among the indicators. Di

Introduction to Fractal Pattern Scanner Fractal Indicator refers to the technical indicator that makes use of the fractal geometry found in the financial market. Fractal Pattern Scanner is the advanced Fractal Indicator that brings the latest trading technology after the extensive research and development work in the fractal geometry in the financial market. The most important feature in Fractal Pattern Scanner is the ability to measure the turning point probability as well as the trend probabi

SMC Larry Williams Yapısı, ünlü yatırımcı Larry Williams'ın en çok satan kitabı "Kısa Vadeli İşlemlerin Uzun Vadeli Sırları"ndan yola çıkarak en önemli salınım noktalarını oluşturan ve birbirine bağlayan, piyasa yapısını uyarlamak ve Akıllı Para konseptini kullanarak büyük katılımcıların ilgi alanlarını analiz etmek için sağlam bir temel oluşturan fiyat grafiği yapılarını analiz etmek için bir göstergedir. Swinglerin oluşturulmasının temelinde basit ve net bir mantık vardır: ardışık üç barın ort

Fair Value Gap Finder detects fair value gaps and generates a signal when price returns to one. Set the minimum and maximum fvg size, customize the colors, style, and length, then let the indicator highlight them for you.
Key Features: Automatic FVG highlights - The indicator detects all fair value gaps that fit your criteria and marks them on the chart.
Entry Signal - A signal is created whenever price retests a fair value gap.
Notification - Alerts notify you when a fair value gap
FREE
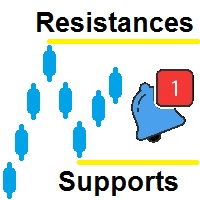
Destekler ve Dirençler, birkaç farklı zaman diliminde tepe ve dipleri otomatik olarak belirlemenize ve böylece mevcut tablo üzerinde bu tepe ve dipleri çizmenize yardımcı olmak için oluşturulmuştur. Dirençlerin oluşturulmasının açıklamasına geçelim. Üst ve alt kuralın ne olduğunu tanımlayabileceğiniz bir kural alanı vardır, üst kural varsayılan olarak şu şekilde ayarlanır: H[ 0 ]<=H[1] and H[ 1 ]=>H[ 2 ]
Nerede:
eleman Tanım H Yüksek anlamına gelir
[0] mevcut mum anlamına gelir [1] önce
FREE
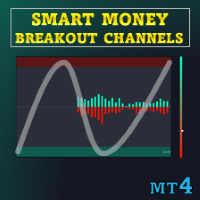
Özel teklif : ALL TOOLS , her biri yalnızca $35 ! Yeni araçlar ilk hafta boyunca veya ilk 3 satın alma için $30 olacaktır! MQL5’te Trading Tools Kanalı : En son haberlerim için MQL5 kanalıma katılın Bu gösterge, volatiliteye göre normalize edilmiş fiyat hareketine dayanan ve “Smart Breakout Channels” olarak adlandırılan kırılma tespit bölgelerini çizer. Bu bölgeler, hacim bindirmeleriyle birlikte dinamik kutular olarak gösterilir. Araç, özel bir normalize volatilite hesabı kullanarak

MACD indicator in MetaTrader 4/5 looks different than MACD does in most other charting software. That is because the MetaTrader 4/5 version of MACD displays the MACD line as a histogram when it is traditionally displayed as a line. Additionally, the MetaTrader 4/5 version computes the Signal line using an SMA, while according to MACD definition it is supposed to be an EMA. The MetaTrader 4/5 version also does not compute a true MACD Histogram (the difference between the MACD/Signal lines). This
FREE

Capture every opportunity: your go-to indicator for profitable trend trading Trend Trading is an indicator designed to profit as much as possible from trends taking place in the market, by timing pullbacks and breakouts. It finds trading opportunities by analyzing what the price is doing during established trends. [ Installation Guide | Update Guide | Troubleshooting | FAQ | All Products ]
Trade financial markets with confidence and efficiency Profit from established trends without getting whip
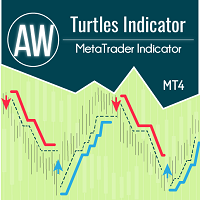
Gösterge Kaplumbağa sistemine göre çalışır ve klasik olarak 20 ila 55 mumluk bir zaman aralığını varsayar. Belirli bir zaman aralığında bir trend izlenir. Giriş, destek veya direnç seviyesinin kırıldığı anda yapılır. Çıkış sinyali, aynı zaman aralığındaki trendin tersi yönde bir fiyat kırılmasıdır. Avantajları:
Araçlar: Döviz çiftleri, hisse senetleri, emtialar, endeksler, kripto para birimleri Zaman Çerçevesi: Klasik olarak D1, ayrıca herhangi bir zaman diliminde çalışmaya uygundur İşlem saatl
FREE

MT5 versiyonu | Trend Monitor VZ göstergesi | Owl Smart Levels göstergesi | Owl Smart Levels stratejisi | FAQ Elliott'un dalga teorisi , finansal piyasalardaki süreçlerin, fiyat çizelgelerindeki dalgaların görsel modeline dayanan bir yorumudur. Valable ZigZag göstergesi , ticaret kararları için güvenebileceğiniz pazarın dalga yapısını görüntüler. Valable ZigZag göstergesi daha kararlıdır ve tüccarları yanıltarak klasik ZigZag göstergesi gibi yönünü sık sık değiştirmez. Bu, gösterge
FREE

Özel teklif : ALL TOOLS , her biri sadece $35 ! Yeni araçlar ilk hafta veya ilk 3 satın alma için $30 olacaktır! Trading Tools Channel on MQL5 : en son haberler için katılın RSI Shift Zone Scanner, RSI sinyallerini fiyat hareketi ile ilişkilendirerek piyasa duyarlılığının değişebileceği anları belirler. RSI, önceden ayarlanmış seviyeleri (varsayılan: aşırı alım 70, aşırı satım 30) aştığında veya altına indiğinde gösterge doğrudan grafikte bir kanal çizer. Bu kanallar, duyarlılığın
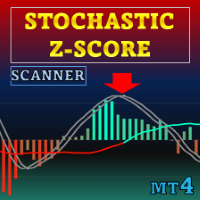
Özel teklif : TÜM ARAÇLAR , her biri sadece $35 ! Yeni araçlar ilk hafta veya ilk 3 satın alma için $30 olacaktır! MQL5’te Trading Tools Kanalı : Benden gelen en son haberler için MQL5 kanalıma katılın Stochastic Z-Score, fiyatı Z-Score ile normaleştirip stokastik mantıkla sınırlandıran ve HMA ile yumuşatan bir moment osilatörüdür; uzun vadeli bağlam için ALMA kullanır. İsteğe bağlı öğeler arasında histogram, dinamik bantlar ve dönüş etiketleri bulunur.
MT5 sürümü için bkz.: Stochast
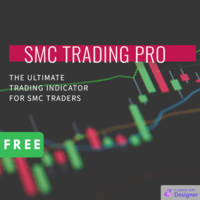
Welcome to the world of SMC (Smart Money Concepts) Trading, where we empower traders with the tools and knowledge to make smarter trading decisions. Our latest addition to our suite of trading tools is the SMC Trading Pro indicator, version 1.0. Key Features: Major Market Structure Identification with BODY break. Order Block must be in Major Swing ( not Small Swing ). Order Block with Fair Value Gap Detection. Order Block in Discount | Premium zone. Filter for only Bullish, Bearish or All Order
FREE

Support And Resistance Screener, MetaTrader için tek bir gösterge içinde birden fazla araç sağlayan tek bir Düzey göstergesindedir. Kullanılabilir araçlar şunlardır: 1. Piyasa Yapısı Eleme Aracı. 2. Geri Çekilme Bölgesi Boğa. 3. Geri Çekilme Bölgesi Ayı. 4. Günlük Pivot Noktaları 5. haftalık Pivot Noktaları 6. aylık Pivot Puanları 7. Harmonik Modele ve hacme dayalı Güçlü Destek ve Direnç. 8. Banka Seviyesi Bölgeleri. SINIRLI SÜRELİ TEKLİF : YG Destek ve Direnç Göstergesi sadece 50 $ ve ömür boy

Unlock hidden profits: accurate divergence trading for all markets Tricky to find and scarce in frequency, divergences are one of the most reliable trading scenarios. This indicator finds and scans for regular and hidden divergences automatically using your favourite oscillator. [ Installation Guide | Update Guide | Troubleshooting | FAQ | All Products ]
Easy to trade
Finds regular and hidden divergences Supports many well known oscillators Implements trading signals based on breakouts Display

Currency Strength Meter is the easiest way to identify strong and weak currencies. This indicator shows the relative strength of 8 major currencies + Gold: AUD, CAD, CHF, EUR, GBP, JPY, NZD, USD, XAU. Gold symbol can be changed to other symbols like XAG, XAU etc.
By default the strength value is normalised to the range from 0 to 100 for RSI algorithm: The value above 60 means strong currency; The value below 40 means weak currency;
This indicator needs the data of all 28 major currency pairs a
** All Symbols x All Timeframes scan just by pressing scanner button ** - Discount : it is not 50$, it is just 39$. *** Contact me to send you instruction and add you in "Head & Shoulders Scanner group" for sharing or seeing experiences with other users. Introduction: Head and Shoulders Pattern is a very repetitive common type of price reversal patterns. The pattern appears on all time frames and can be used by all types of traders and investors. The Head and Shoulders Scanner in

Altın Trend - bu iyi bir hisse senedi teknik göstergesidir. Gösterge algoritması, bir varlığın fiyat hareketini analiz eder ve oynaklığı ve potansiyel giriş bölgelerini yansıtır.
En iyi gösterge sinyalleri:
- SATIŞ için = kırmızı histogram + kırmızı KISA işaretçi + aynı yönde sarı sinyal oku + kırmızı trend yön oku. - AL için = mavi histogram + mavi UZUN işaretçi + aynı yönde aqua sinyal oku + mavi trend yön oku.
Göstergenin faydaları:
1. Gösterge yüksek doğrulukta sinyaller üretir. 2.

Tanıtımı Quantum Heiken Ashi PRO çizelgeleri Pazar eğilimleri hakkında net bilgiler sağlamak için tasarlanan Heiken Ashi mumları, gürültüyü filtreleme ve yanlış sinyalleri ortadan kaldırma yetenekleriyle ünlüdür. Kafa karıştırıcı fiyat dalgalanmalarına veda edin ve daha sorunsuz, daha güvenilir bir grafik sunumuna merhaba deyin. Quantum Heiken Ashi PRO'yu gerçekten benzersiz kılan şey, geleneksel şamdan verilerini okunması kolay renkli çubuklara dönüştüren yenilikçi formülüdür. Kırmızı v

The MA Bounce Strategy is a strategy that seeks to long FX pairs on a strong uptrend as they bounce off their MA support and shorting FX pairs on a strong downtrend as they bounce off MA resistance. The best suitable periods of moving averages for that strategy are 18, 30, 50. This indicator helps to identify and find place for potential market entry by MA bounce strategy. Read More information about MA Bounce Strategy . By default MA Bounce Strategy indicator is configured for trading of M15
SR PrevPeriods MT4 Genel Bakış
SR PrevPeriods, MetaTrader 4 grafiğinde önceki günün, önceki haftanın ve önceki ayın en yüksek ve en düşük seviyelerini gerçek zamanlı olarak çizer. Hafif bir indikatör olup, fiyat tepkisi bölgeleri, kırılma seviyeleri ve yeniden denge alanlarıyla sıkça örtüşen tarihi destek ve direnç bölgelerini vurgulamak için tasarlanmıştır. Ne Yapar
Önemli geçmiş seviyelere yatay çizgiler çizer ve istenirse tam fiyat bilgisini gösteren metin etiketleri ekler. Çizgiler her yen
FREE

BUY INDICATOR AND GET NEW EXCLUSIVE EA FOR FREE AS A BONUS! ITALO ARROWS INDICATOR is the best reversal indicator ever created, and why is that? Using extreme reversal zones on the market to show the arrows and Fibonacci numbers for the Take Profit, also with a panel showing all the information about the signals on the chart, the Indicator works on all time-frames and assets, indicator built after 8 years of experience on forex and many other markets. You know many reversal indicators around t
Smart Breakout Indicator determines support and resistance levels and also shows the breakout points of the levels in the form of a histogram.
The program contains two indicators in one: 1-support and resistance lines, 2-histogram indicator based on high price fluctuations. The indicator autonomously calculates the best support and resistance levels and also in the form of a histogram shows the best moments of the breakdown of the lines.
The histogram indicator is based on the action of pr

The Ultimate Trading Companion: Smart Trend Tracer Tired of getting lost in market noise? Ready to find the clearest trends with pinpoint accuracy? Introducing Smart Trend Tracer , the ultimate tool designed to cut through the clutter and reveal the most profitable market swings. This isn't just another indicator; it's your personal guide to spotting trends as they form, giving you the confidence to make smarter trading decisions. Smart Trend Tracer identifies significant highs and lows on your
FREE

Auto Optimized RSI: Profesyonel Piyasa Adaptasyonu Çoğu trader başarısız olur çünkü dinamik bir piyasada statik araçlar kullanırlar. Her grafikte 70/30 gibi sabit RSI seviyelerini kullanmak matematiksel bir hatadır. Mantıksal bir temeli olmayan "sihirli bir ok" arıyorsanız, bu gösterge size göre değildir. Bu araç, trading'de hayatta kalmanın tek anahtarının "Optimizasyon" olduğunu anlayan profesyoneller için tasarlanmıştır. Standart göstergeler işlem yaptığınız sembolü veya zaman dilimini dikkat

AMD Uyarlanabilir Hareketli Ortalama (AAMA)
AAMA, MetaTrader 4 için geliştirilmiş, piyasa koşullarına göre tepkisini otomatik olarak ayarlayan bir uyarlanabilir hareketli ortalama göstergesidir. Temel Özellikler: Kaufman Verimlilik Oranı’na dayalı uyarlanabilir hareketli ortalama – güçlü trendlerde hızlı tepki verir, yatay piyasalarda gürültüyü filtreler 4 AMD piyasa aşamasının otomatik tespiti: Birikim (Accumulation), Yükseliş (Markup), Dağıtım (Distribution), Düşüş (Markdown) ATR aracılığıyla

True Super Arrows is a powerful and versatile indicator that can help you identify and trade profitable trends. The indicator uses a combination of technical indicators to generate arrows that point to the direction of the trend. Features: Multiple trend identification methods: The indicator uses a combination of moving averages, trend lines, and other indicators to identify trends. Accurate trend direction: The indicator uses a variety of techniques to ensure that the arrows are pointing in

The indicator automatically identifies the 1-2-3 pattern on the chart. The indicator is able to monitor the formation of pattern in real time. It informs the trader when the pattern is completely formed (when the price breaks the line in point 2) and displays the completed patterns in history. The patterns are never redrawn. The indicator can identify patterns on any instruments (currency pairs, stock market, gold, etc.) without the need to adjust to each instrument. Simple and clear visualizati

Wave Reversal Indicator - denge çizgisi etrafındaki yön ve fiyat dönüşlerini belirler.
Gösterge dalga hareketlerini ve trend artışlarını gösterir. Tüccarın nerede takip edileceğine dair tavsiyeler verir, ticaret stratejisinin takip edilmesine yardımcı olur.
Gün içi veya orta vadeli bir stratejiye ektir.
Hemen hemen tüm parametreler her zaman dilimi için seçilir ve otomatik olarak değişir; manuel ayarlama için tek parametre dalga boyudur.
M5, M15, M30, H1, H4'ü kullanmak için en uygun zaman dili
FREE

Current event: https://c.mql5.com/1/326/A2SR2025_NoMusic.gif
A. A2SR nedir ? * Önde gelen bir teknik göstergedir (yeniden boyama yok, gecikme yok).
-- Rehberlik : -- https://www.mql5.com/en/blogs/post/734748/page4#comment_16532516 adresinde -- ve https://www.mql5.com/en/users/yohana/blog
A2SR, Destek (talep) ve Direnç (arz) seviyelerini belirlemede özel bir tekniğe sahiptir. İnternette gördüğümüz sıradan yoldan farklı olarak A2SR, gerçek SR seviyelerini belirlemede özgün bir konsepte sahi

Algo Trading Indicaor
With this indicator , you’ll have zones and trends that hight probability the price will reverse from it. so will gives you all the help that you need
Why should you join us !? 1-This indicator is logical since it’s working in previous days movement , to predict the future movements.
2-Algo trading indicator will help you to draw trends which is special and are too strong than the basics trend , trends will change with the frame time that you work on .
3-We can use

One of the most powerful and important ICT concepts is the Power of 3. It explains the IPDA (Interbank Price Delivery Algorithm) phases. PO3 simply means there are 3 things that the market maker's algorithm do with price:
Accumulation, Manipulation and Distribution
ICT tells us how its important to identify the weekly candle expansion and then try to enter above or below the daily open, in the direction of the weekly expansion.
This handy indicator here helps you keep track of the weekly and
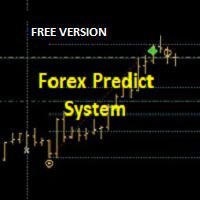
Hi Trader, ================================================================================ If you like my indicator, please do not hesitate to give a review and/or comment. Thank you! ================================================================================
This indicator draws trade entry zone and target levels based on the levels of the previous day.
A blue zone (BUY) or red zone (SELL) is drawn and two targets. The optimal trade entry value is also indicated.
A second gray zone is
FREE

The indicator analyzes the volume scale and splits it into two components - seller volumes and buyer volumes, and also calculates the delta and cumulative delta. The indicator does not flicker or redraw, its calculation and plotting are performed fairly quickly, while using the data from the smaller (relative to the current) periods. The indicator operation modes can be switched using the Mode input variable: Buy - display only the buyer volumes. Sell - display only the seller volumes. BuySell -
FREE
False Breakout MT4 , fiyatın kısa süreliğine yakın zamanda oluşmuş bir destek veya direnç seviyesini kırıp hızla önceki aralığa geri döndüğü durumları tespit etmek için tasarlanmış bir göstergedir. Bu sahte breakout’lar, tahmine dayalı olmayan, diskresyonel analizler veya karşıt stratejiler için görsel ipuçları sağlar. Ana Özellikler: Son yüksekler ve düşükler çevresinde otomatik sahte breakout tespiti (örneğin, iki gün boyunca genişletilmiş günlük seviyeler). Kaçırılmış kırılımları vurgulayan o
FREE
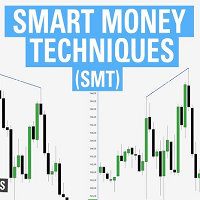
ICT SMT divergence represent a situation in the market where two correlated assets, being seen within the same timeframe, exhibit opposing structure. This can be seen in two positively correlated assets, as one asset forming a higher low, while the other forming a lower low instead of higher low. Version 1.03: Add Higher Timeframe support An ICT SMT divergence serves as the primary signal of reversal for correlated assets. If two positively correlated assets are moving higher and at a point one

RSI divergence indicator finds divergences between price chart and RSI indicator and informs you with alerts (popup, mobile notification or email). Its main use is to find trend reversals in the chart. Always use the divergence indicators with other technical assets like support resistance zones, candlestick patterns and price action to have a higher possibility to find trend reversals. Three confirmation type for RSI divergences: RSI line cross 50 level (doesn't repaint) Price returns to
FREE
MetaTrader mağazası, alım-satım robotları ve teknik göstergeler satmak için en iyi yerdir.
MetaTrader platformu için ilgi çekici bir tasarıma ve iyi bir açıklamaya sahip bir uygulama geliştirmeniz yeterlidir. Milyonlarca MetaTrader kullanıcısına sunmak için size ürününüzü Mağazada nasıl yayınlayacağınızı açıklayacağız.
Alım-satım fırsatlarını kaçırıyorsunuz:
- Ücretsiz alım-satım uygulamaları
- İşlem kopyalama için 8.000'den fazla sinyal
- Finansal piyasaları keşfetmek için ekonomik haberler
Kayıt
Giriş yap
Gizlilik ve Veri Koruma Politikasını ve MQL5.com Kullanım Şartlarını kabul edersiniz
Hesabınız yoksa, lütfen kaydolun
MQL5.com web sitesine giriş yapmak için çerezlerin kullanımına izin vermelisiniz.
Lütfen tarayıcınızda gerekli ayarı etkinleştirin, aksi takdirde giriş yapamazsınız.