Watch the Market tutorial videos on YouTube
How to buy а trading robot or an indicator
Run your EA on
virtual hosting
virtual hosting
Test аn indicator/trading robot before buying
Want to earn in the Market?
How to present a product for a sell-through
Technical Indicators for MetaTrader 4 - 25

Unlock your trading potential with Momentum Master , the smart indicator designed to help you navigate the markets with confidence. This powerful tool provides clear, actionable signals by combining the strengths of multiple proven indicators. Say goodbye to guesswork and hello to precision trading. Momentum Master is more than just a signal provider; it's your personal market analyst. It uses a unique combination of Moving Averages (EMA 34 & 55) to identify the trend, MACD for trade confirmatio
FREE
Volume Profile Pro Indicator This indicator is the Volume Profile Pro tool, designed to help analyze "at which price level the most trading activity occurred." It comes with these additional special capabilities: 1. Display Modes Volume Profile (Standard): Shows the Total Volume at each price range to visualize key support and resistance zones. Delta / Money Flow: Shows the "difference" between Buy and Sell pressure ( Buy vs Sell ) to indicate who controls the market at that price. You can choos

CPR Pivot Lines It Will Draw Pivot Point R1,R2,R3 S1,S2,S3 Tc Bc Best Part Is That You Can Even Add Values Of High,Low,Close Manually Also To Get Your All Levels On Chart. So If Your Broker Data Of High ,Low ,Close Is Incorrect Then You Don’t Have To Depend On Them Anymore. You Can Even Modify All Lines Style. It Will Show Line In Floating Style And Not Continues Mess.
FREE
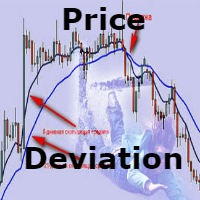
A very simple and intuitive indicator that shows the deviations from the moving average in percent. The default is a 50-day moving average. Just throw on the chart and the indicator build in a separate window under the graph.
This can be very convenient if your strategy implies a certain deviation in percentage of the moving average. It is not very convenient to calculate it manually. The method of averaging, the period of the moving average and at what prices to build all this is selected in t
FREE

1. Monthly, weekly and daily pivots are calculated with the beginning and ending data for each period. 2. This provides an easy line on the chart to identify where the pivots are and reduces error of calculation. 3. The indicator will help define very quickly the major pivots for the instrument even if you do not understand how to calculate the pivot. 4. You can also compare weekly and daily pivots so that you can better understand the position of price. 5 This indicator will help you trade more
FREE

Unleash Precision Trading with Fusion Multi-Trend Pro Are you tired of conflicting signals and missed opportunities? Introducing the Fusion Multi-Trend Pro , the indicator engineered to cut through market noise and deliver high-convection entry and exit points. This isn't just another indicator; it's a unified trading assistant that merges the power of momentum, trend, and volatility into a clear, decisive signal. Key Advantages: Why You Need Fusion Multi-Trend Pro Filter Out the Fakes: Our sys
FREE

Precision Trading with Advanced Market Analysis! Gain an edge in forex trading with a comprehensive analysis suite that helps you categorize volatility, estimate swing lengths, and make data-driven decisions based on historical market behavior. Key Features: Advanced Swing Detection
Customize sensitivity to price movements by defining minimum bars and price shifts required for a new swing.
Tailor it to your trading style for precise trend identification. Volatility Analysis
FREE
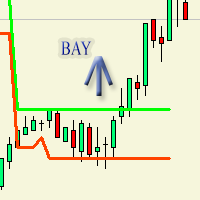
Индикатор изначально предназначался для торгового робота который в дальнейшем опубликуется. Рисует на графике флет. То-есть покой тренда. Очень отчетливо выражает флет по параметрам по умолчанию. flateWigth - допустимая ширина или разница между барами по которому индикатор будет засчитывать флет. Индикатор работает в реальном времени. Для наглядного просмотра работы можно запустить в тестере.
FREE

is a user-friendly MetaTrader 4 indicator that creates a centralized dashboard for traders to oversee several cryptocurrency pairs simultaneously across different timeframes, presenting price movements through simple dots or miniature candlestick charts, complemented by volume indicators to facilitate quick assessments of market trends and fluctuations. It automatically resizes grid cells according to the number of bars shown per timeframe for better use of screen space, features adjustable co
FREE

"IF YOU'RE LOOKING UNIQUE TRADING INDICATOR… AT AN AFFORDABLE PRICE… YOU'VE COME TO THE RIGHT PLACE!" Additional bonus: You get the Forex Trend Commander Indicator absolutely free! Successful traders can turn any not-so-good trading system into a profitable one by using proper money management! With two built-in systems DayTradingArrow v1 generates a high percentage of successful trades. The indicator gives an incredible advantage to stay on the safe side of the market by anyone who uses it.
B

RCI (Rank Correlation Index) Indicator Overview The RCI (Rank Correlation Index) indicator is an oscillator-based tool that analyzes market trends and possible turning points by measuring the rank correlation of price data.
It quantifies the correlation between price ranking and time ranking over a specified period, displaying values from -100 to +100 as a simple line.
RCI is widely used for gauging market momentum, timing entries and exits, and can support both trend-following and counter-tren
FREE

Rsi indicator and Stochastic Combined into one indicator , the Supreme StochRsi doesnt repaint / Back-paint / delay. can be used as overbought oversold strategy , or trend following on 50 level cross. if you like this indicator please check my Supreme Trendhisto: here , and my Supreme Diamond indicator : here ========================================================================= Parameters : Stochastic K and D value , Stochastic period Rsi Period Rsi price ====================================
FREE

This indicator identifies swing highs and swing lows in the price chart by comparing the Highs and lows of each candle to a specified number of candle before and after it. Once it has identified the swing highs and swing lows, it can use them to determine potential support and resistance levels. A support level is formed when the price drops and bounces back up from a swing low, indicating that there is buying pressure at that level. A resistance level is formed when the price rises and reve
FREE
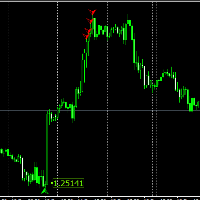
For those who have followed my FCK Quantum Scalping thread know about the FCK Quantum Scalping indicator and have taken the indicator to different levels (Mastermind) to suit his or her trading style. In this system, the Quantum indicator is only for showing us trading entries, and that’s it. Targets and stop levels are a little later. For those who don’t know what the FCK Quantum Scalping indicator is, I’ll tell you. The FCK Quantum Scalping indicator is basically a modified Wave indicator i
FREE

Informative & optimized Zigzag, Accumulated volume, Price change A rewrite of the traditional zigzag tool with new additions. Features:- Optimized code Displays accumulated volume between peaks Displays price change between peaks Usage:- Identify trend swings Identify high volume swings Compare price changes between swings Drawing Fibonacci tool on strong price change or high volume swings
FREE

Are you tired of having many open charts and watching many different currency pairs? MCTSI will monitor the strengths of 56 currency pairs and show you the best pairs to trade, no more guessing which currency is stronger/weaker, no more trading a pair that is not moving positively. This is the BASIC version. MCTSIP is the more advanced version and can be found here: https://www.mql5.com/en/market/product/20994 You may have many charts open trying to determine the best currency pair to trade on
FREE

Omega Support & Resistance
A unique indicator for buy low, sell high strategies Reversal type entries, as price rises to the full length line, expect price to turn/swing/reverse Can trade 1-5min charts with 4hr for interday setups or m15 and higher with daily, 1hr with weekly for long term setups
High precision future price predictor for high or low of any product for Weekly, Daily, 4hr and even 1hr charts Best to use SonicR color bar indictor or similar to avoid entry at certain levels, watc
FREE
Unleash Smarter Trading with the Smart Signal Generator Tired of guesswork in your trading? The Smart Signal Generator is your new essential tool, designed to simplify your strategy and give you a powerful edge. This isn't just another indicator—it's a system built to provide you with high-probability entry signals, saving you time and boosting your confidence. Key Advantages & Features Intelligent Signal Generation : Our system goes beyond basic crossovers. It uses a built-in EMA filter to conf
FREE

Indicator ini berdasarkan Gain ADX - Follow Trend - Disertai Pivot, Support & Resistant Daily
Dengan indicator ini semoga menjadikan indicator yang porofit able, selama mengikuti signal yang tampil, apabila berwarna Hijau siap2 untuk Buy, dan berwarna Merah siap2 untuk Sell.
Akan tampil signal Sell/Buy di saat gain mencukupi, baik TF Kecil maupun TF Besar TF Besar / High TF adalah Trend Kuat TF Kecil / Low TF adalah Trend Lemah
Open Posisi pada High TF, signal akan menunjukkan Sell/Buy.
FREE

The indicator displays crossing zero level by Moving Average of Oscillator (OsMA) in the form of arrows. The indicator notifies about a signal by means of a pop-up Alert window, or sending notification to e-mail.
Parameters Fast EMA Period - fast EMA. This is an exponential moving average from a price with a short period. Slow EMA Period - slow EMA. This is also an exponential moving average of a market price but with a longer period. Signal SMA Period - MACD SMA. This is a signal line which is
FREE

Commodity Channel Index and Moving Average [CCI MA] A combination of CCI and MA to create a crossover trading setup Input parameters: signal mode: set it to true if you want to plug it into STAT (Signal Tester and Trader) arrow shift: distance between fast EMA line to arrow on chart price line filter CCI period CCI price method Moving average period Averaging method upper level lower level You can find the best setting for 4 hour EURUSD on this video
FREE

BeST_ Classic Pivot Points is an MT4 Indicator that is based on the widely known and definitely classic Pivot Point of a market prices activity. A pivot point is calculated as an average of significant prices (high,low,close) from the performance of a market in the prior trading period. If the market in the following period trades above the pivot point it is usually evaluated as a bullish sentiment, whereas trading below the pivot point is seen as bearish. A pivot point and the associated suppo
FREE

Stochastic Plus is a visual indicator designed for both beginners and professionals. Developed using Stochastic and Laguerre and the principle of three screen. Stochastic Plus helps: correctly evaluate the current market movement; find optimal entry points; do not rush to close profitable orders and increase profit Stochastic Plus works very well with AmericanDream indicator (see screenshot). May be used with any currency and timeframe.
FREE
Unlock Smarter Trades with Candle Sync Pro! Are you tired of conflicting signals across different timeframes? Do you wish you had a clearer view of the market's true direction? "Candle Sync Pro" is your essential tool for making more confident and informed trading decisions! This powerful indicator cuts through the noise, allowing you to see the bigger picture by visualizing higher timeframe candles directly on your current chart. No more switching back and forth, no more guesswork – just pure,
FREE

Transform Your Trading with the Visual Trend Ribbon Tired of missing the big moves? Do you struggle to identify the market's true direction? The Visual Trend Ribbon is your solution. This powerful indicator cuts through the market noise, giving you a clear, visual understanding of the trend so you can trade with confidence. Instead of a single, lagging line, the Visual Trend Ribbon uses a dynamic band of multiple moving averages to show you the market's true momentum. When the ribbon expands, t
FREE
Find Your Trading Direction with Signal Compass Pro ! Tired of guessing your next move? Signal Compass Pro is your answer. This indicator isn't just a tool; it's your personal compass in the financial markets. By combining three powerful momentum indicators— CCI , WPR , and Force Index —we provide confirmed trading signals that are cleaner, more reliable, and less prone to "noise." Key Features & Advantages Confirmed Signals: No more guesswork. This indicator merges the power of three momentum i
FREE

RaysFX Stochastic L'indicatore RaysFX Stochastic è un indicatore personalizzato per la piattaforma MetaTrader 4.
Caratteristiche principali:
-Indicatori separati: L'indicatore viene visualizzato in una finestra separata sotto il grafico principale. -Livelli dell'indicatore: L'indicatore ha due livelli predefiniti, 20 e 80, che possono essere utilizzati come livelli di ipervenduto e ipercomprato. -Buffer dell'indicatore: L'indicatore utilizza quattro buffer per calcolare e memorizzare i suoi
FREE
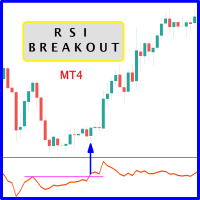
When prices breakout resistance levels are combined with Relative Strength Index "RSI" oscillator breaks out its historical resistance levels then probability emerges to record farther prices. It's strongly encouraged to confirm price breakout with oscillator breakout since they have comparable effects to price breaking support and resistance levels; surely, short trades will have the same perception. Concept is based on find swing levels which based on number of bars by each side to confi
FREE

This oscillator has become one of the main tools of most professional traders. The indicator includes a classical MACD ( Moving Average Convergence/Divergence ) line, a signal line, as well as a MACD histogram. Exponential moving averages are used in the calculation. The indicator also provides the ability to enable signals on identification of divergences between the price graph and the indicator. Divergences are identified using three patterns: classic, hidden and extended divergences.
Indica
FREE

Are you tired of plotting fibonacci retracements or extensions manually? This indicator displays fibonacci retracements or extensions automatically, calculated from two different price points, without human intervention or manual object anchoring. [ Installation Guide | Update Guide | Troubleshooting | FAQ | All Products ] Easy to use Manual anchoring is not needed Perfect for price confluence studies The indicator evaluates if retracements or extensions are needed Once drawn, you can manually
FREE
Highly configurable Elder's Force Index (EFI) Indicator. Features: Highly customizable alert functions (at levels, crosses, direction changes via email, push, sound, popup) Multi timeframe ability Color customization (at levels, crosses, direction changes) Linear interpolation and histogram mode options Works on strategy tester in multi timeframe mode (at weekend without ticks also) Adjustable Levels Parameters:
EFI Timeframe: You can set the lower/higher timeframes for EFI . EFI Bar Shift
FREE

Necessary for traders: tools and indicators Waves automatically calculate indicators, channel trend trading Perfect trend-wave automatic calculation channel calculation , MT4 Perfect trend-wave automatic calculation channel calculation , MT5 Local Trading copying Easy And Fast Copy , MT4 Easy And Fast Copy , MT5 Local Trading copying For DEMO Easy And Fast Copy , MT4 DEMO Easy And Fast Copy , MT5 DEMO MACD is called Convergence and Divergence Moving Average, which is developed from the double e
FREE

To the first 5 buyers for --> $45.99;
The Cat Trend VZ is a constantly improving indicator with accurate and profitable entry signals.
The Cat Trend VZ indicator line changes color depending on the trend direction, and the indicator draws arrows at the price reversal points.
In addition, The Cat Trend VZ indicator implements a sound and text alert about the appearance of an arrow.
IMPORTANT: THE INDICATOR DOES NOT REDRAW.
Main features of The Cat Trend VZ: Analytical functions It can b
FREE
Scalping indicator with alerts : EU Scalp indicator is a combination of two working sets , first one is preset to work against the direction of the price movement and the second one is working on the direction of the price movement , based on the probability of price swings or breakouts that occure at important trade levels . The default settings are optimized for the EurUsd pair M5 Timeframe , more settings can be found in the "Comments" section at first comment . Lot zise recommandation is
FREE

L'indicatore Go Trend è un indicatore personalizzato per MetaTrader 4 (MT4) basato su una logica di ZigZag con tre livelli di periodi diversi.
Questo indicatore è progettato per identificare i punti di inversione del prezzo (massimi e minimi) su diversi timeframe, aiutando i trader a individuare potenziali trend e punti di ingresso/uscita nel mercato.
Funzionalità Principali Identificazione dei Punti di Inversione (ZigZag) L'indicatore utilizza una logica di ZigZag per tracciare linee che coll
FREE

TickChartOscillator is an indicator that displays a symbol's tick chart in an oscillator subwindow. It offers flexible customization options, including: · The ability to hide the price line in the oscillator. · The option to specify a different symbol for tick chart display. If the "Symbol" parameter is left blank, the tick chart will be shown for the current symbol where the indicator is applied. This tool is perfect for traders who want to view tick dynamics in an oscillator format and u
FREE

The Multi-Timeframe High Low Points (MTF High Low Points) indicator is a powerful tool for traders using MetaTrader 4 (MT4) to analyze price movements across different timeframes. This versatile indicator helps traders identify significant support and resistance levels by displaying the highest and lowest price points within a specified number of bars on multiple timeframes simultaneously. Key Features: Multi-Timeframe Analysis: MTF High Low Points allows traders to monitor high and low price le
FREE
IceFX VelocityMeter is a very unique indicator on MetaTrader 4 platform which measures the speed of the forex market. It's not a normal volume or other measurement indicator because IceFX VelocityMeter is capable to understand market speed movements which are hidden in ticks and those valuable information cannot be read in an ordinary way from the candles. The software monitors the received ticks (frequency, magnitude of change) within a specified time range, analyzes these info and defines, dis
FREE

50% off. Original price: $60 Support and Resistance zones indicator for MT4 is a multi-timeframe panel and alert that finds support and resistance zones and pivot points for all timeframes of MetaTrader 4 and gives alert when price has interaction with them. Download demo version (works on GBPUSD, EURJPY and NZDUSD symbols) Read the full description of scanner parameters in the blog page . Many unique features in one indicator:
Integrating support and resistance zones and pivot points in one i

This indicator was modified according to the 'Way Of The Turtle'. It generates a channel based on the opening price and ATR values of the current bar. Turtle ATR Channel can be used to help identify overbought and oversold conditions in a market.
Calculation upper channel = Open + r1*ATR lower channel = Open - r2*ATR Among them: Open is the opening price of the current bar. ATR is the ATR value of the current bar. r1, r2 are the ATR ratios.
Input Parameters ATR Period - set the period of the A
FREE

NOTE!: The trend vote and the buy sell option shall match to the same direction before you put a trade!!
Indicator that uses Kalman filters (same as used on autonomous vehicles for data fusion between different sensors / technologies such as RADAR, LIDAR and Camera with Artificial Intelligence for object detection) by using the high and low price in order to identify buy and sell signals as indicated on the graph.
This indicator can be used on any timeframe with any currency or symbol.
This i
FREE
Cycle Signals Indicator. Gives signal on price range cycling and smoothed with algorithm. There are very small parameters: allow alerts (Pop Up or Email), colors for chart arrows, timeframe to use for calculation (but better to use current timeframe). And most important parameter is "period". For low timeframes high values are recommended. Current period is good for M5. Decrease it for higher timeframes. Close trade arrows will come soon. MT5 version comes soon (but with some small price).
FREE

The purpose of this new version of the MT4 standard indicator provided in your platform is to display in a sub-window multiple timeframes of the same indicator. See the example shown in the picture below. But the display isn’t like a simple MTF indicator. This is the real display of the indicator on its timeframe. Here's the options available in the FFx indicator: Select the timeframes to be displayed (M1 to Monthly) Define the width (number of bars) for each timeframe box Alert pop up/sound/ema
FREE
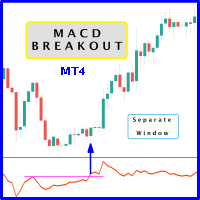
Probability emerges to record higher prices when MACD breaks out oscillator historical resistance level. It's encouraged to confirm price breakout with oscillator breakout since they have comparable effects to price breaking support and resistance levels; certainly, short trades will have the same perception. As advantage, many times oscillator breakout precedes price breakout as early alert to upcoming event as illustrated by second and third screenshot. Furthermore divergence is confirmed in c
FREE
The MACD 2 Line Indicator is a powerful, upgraded version of the classic Moving Average Convergence Divergence (MACD) indicator.
This tool is the embodiment of versatility and functionality, capable of delivering comprehensive market insights to both beginner and advanced traders. The MACD 2 Line Indicator for MQL4 offers a dynamic perspective of market momentum and direction, through clear, visually compelling charts and real-time analysis.
Metatrader5 Version | All Products | Contact
FREE

The Signal Premium Pro System SMART ANALYZER SYSTEM V3 (2025) – Next Generation Market Intelligence for Traders Smart Analyzer System V3 is a professional trading indicator for Forex, Gold (XAUUSD), and Indices. It provides real-time buy/sell signals, automatic levels, multi-timeframe analysis, and adaptive trading modes for scalping, intraday, and swing strategies. Trade smarter with precision, clarity, and confidence.
forex indicator, xauusd, gold trading, mt4 indicator, mt5 indicator,
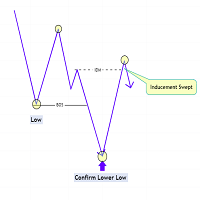
The Market Structure with Inducements & Sweeps indicator is a unique take on Smart Money Concepts related market structure labels that aims to give traders a more precise interpretation considering various factors.
Compared to traditional market structure scripts that include Change of Character (CHoCH) & Break of Structures (BOS) -- this script also includes the detection of Inducements (IDM) & Sweeps which are major components of determining other structures labeled on the chart.
SMC & pri
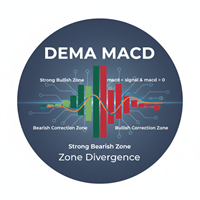
Indicator: The DEMA MACD Zone Divergence This is a powerful, multi-timeframe trend-following indicator based on the Moving Average Convergence Divergence (MACD) , but enhanced using Double Exponential Moving Averages (DEMA) for reduced lag. Its main function is to paint the background of the price chart with color-coded rectangular zones, clearly signaling the current momentum phase and potential shifts in market control (bullish or bearish). Core Purpose To visually map the strength and phas
FREE
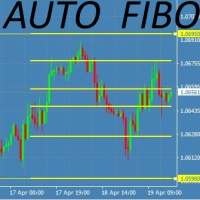
This Fibonacci Indicator is showing fibo retracement lines on chart for EA trading same as the default tool from Metatrader's menu, except this one is fully automatic and changes along with the chart (with modes B and C, then mode A is always fixed by set levels)
AND it also offers the line levels for the Expert Advisors to read (buffers) , so you can set your trades based on crossover\crossunder on those fibo lines.
You can choose from 3 modes for selecting the max HIGH and min LOW limit,
and
FREE

The Stochastic RSI indicator (StochRSI) is essentially an indicator of an indicator. It is used in technical analysis to provide a stochastic calculation to the RSI indicator. This means that it is a measure of RSI relative to its own high/low range over a user defined period of time. The Stochastic RSI is an oscillator that calculates a value between 0 and 1 which is then plotted as a line. This indicator is primarily used for identifying overbought and oversold conditions.
FREE

M1Arrows is a MT4 trend arrows Indicator
* Smart Scalper Setup (M1) :: Signal 5 Main 20 + Signal 20 Main 80 + Fibonacci ZigArcs 20
(Screenshot1) Add the indicator with first setting,
then add it again to the same graph with other settings.
You can add as many as you want, but 2 M1Arrows in just one graph is enought
Never open orders againt the slow setting trend
Do not open more than 3 orders per slow setting trend
It will work better in Europe/USA markets, * M15 Day Trade Setup: Signal 20 ma
FREE

Having to check constantly if your RSI has reached a specific level can be tedious and draining at times, especially if you have to monitor different asset classes at a time. The Alert RSI indicator will assist in this task, ensuring that you get the most with little effort. When the RSI values get to a specified level, the alerts will go off, on the chart, on the MT4 phone app or via email (You can receive text messages to your phone if you activate texts on your Gmail account). The indicator d
FREE

The Flag Streamer Pattern indicator is an indicator designed to find flag and pennant patterns. When the legend finds patterns, it draws lines on the graph screen. Magenta lines represent the streamer pattern. Aqua colored patterns represent the flag pattern. You can change the pattern colors according to your request. Our Popular Products Super Oscillator HC Cross Signal Super Cross Trend Strong Trend Super Signal Parameters fs- =======Channel Trend Setting===== Channel - Channel period setting
FREE

Enhance your price action strategy: inside bar breakouts at your fingertips
This indicator detects inside bars of several ranges, making it very easy for price action traders to spot and act on inside bar breakouts. [ Installation Guide | Update Guide | Troubleshooting | FAQ | All Products ] Easy to use and understand Customizable color selections The indicator implements visual/mail/push/sound alerts The indicator does not repaint or backpaint An inside bar is a bar or series of bars which is/a
FREE

The indicator marks the volatile areas of price movement on the chart according to the specified settings.
Settings TrendPips - filter value in points TrendBars - filter value in the amount of bars signal_shift - shift relative to the current bar by the specified number of periods back, for signals CountBars - the number of bars to display the indicator Color_1 - one of the rectangle alternation colors Color_2 - the second color of the rectangles Alerts - show a dialog box containing custom dat
FREE
Trend indicator A unique system for determining the trend for each timeframe,
Allows you to have a real picture of the trend for any currency pair on all standard timeframes! Green squares are BUY trend and red squares are SELL.
Trading technique: if small time frames are opposite to the trend of the older ones, then due to the inertia of the market movement, enter in the older times as on the screenshots.
FREE
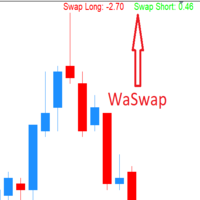
WaSwap MT4 Indicator shows the current Swap Long and current Swap Short with color.
* Set the Swap Threshold and the color to identify when the current swap is below or above the Spread Threshold.
* Set X axis and Y axis and chose the Corner and the Anchor to position the Swap Label on the chart.
* Write the font and the font size for more confort.
* Activate alert if the current Swap Long or the current Swap Short is below the swap threshold.
* The user will never swing with a negative sw
FREE

O Touch VWAP é um indicador que permite calcular uma Média Ponderada por Volume (VWAP) apenas apertando a tecla 'w' no seu teclado e após clicando no candle do qual deseja realizar o calculo, clicando abaixo do candle é calculada a VWAP baseado na minima dos preços com o volume, clicando sobre o corpo do candle é calculado uma VWAP sobre o preço medio com o volume e clicando acima do candle é calculado uma VWAP baseado na máxima dos preços com o volume, voce tambem tem a opção de remover a VWAP
FREE
Seamlessly switch between different pairs from one window, while maintaining your current chart template across all pairs. This tools simply obtain all pairs in your market watch window and grant you the ease of switching between them from one window while maintaining your current chart setup and all loaded indicators and chart objects across all the pairs available in your market watch window.
FREE

Questo indicatore avanzato è un potente strumento progettato per aiutare i trader a identificare i livelli chiave di supporto e resistenza nel mercato. Questo indicatore è versatile e offre un'interfaccia personalizzabile e intuitiva, consentendo ai trader di scegliere tra sei diversi metodi di calcolo del punto pivot: Classic, Camarilla, Woodie, Floor, Fibonacci, Fibonacci Retracement.
FREE

This indicator is stand alone version from MP Pivot Levels (All in one) containing Woodie Pivots. Woodie’s pivot points are made up of multiple key levels, calculated from past price points, in order to frame trades in a simplistic manner. The key levels include the ‘pivot’ itself, and multiple support and resistance levels (usually up to three each). Traders use these levels as a guide for future price movements when setting up trades.
The pivot : (Previous high + previous low + 2 x previous
FREE

Hello, I need reviews from you guys. Thank you Fractal Swing Detector Pro Indicator is designed to help traders identify key swing points in the market . By combining fractal an d pivot analysis, this indicator provides deeper insights into price movements an d potential reversals. Key Features: Fractal Analysis: Identify high and low fractals with the option to use either 3 or 5 bar fractals . Fractals help detect minor reversal points within trends. Pivot Points: Advance d pivot
FREE
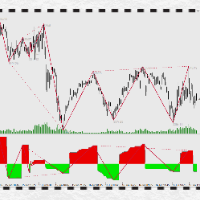
万能背驰指标简介(DivergenceLines) 注意注意,这个指标不能单独运作,对以下两个指标有依赖,请确保先获得以下两个指标后才购买本指标! 1) 动力之梯(PowerTrapezoid) (力度评估副图指标,本指标) 2) 万能分段(LinesSegment) (线段划分主图指标) 。 3)万能背驰(DivergenceLines,本指标) (比较力度背离主图指标)。 指标原理: 通过获取动力之梯指标的筹码堆积值,依照万能分段指标为依据,对同向线段向前回朔,进行一一对比,当后面线段力度比前面力度小时,定义为背驰(背离),背驰的两个高点(或两个低点)之间可以连接一条背驰线,当某个高点(或低点)连接的背驰线越多,这个点就构成了多个单级别背驰区间套。
FREE

This semaphore indicator is based in the standard RSI, which is applied over the Envelopes indicator that shows an envelope or envelope fluctuation borders. This is a version of RSI vs Envelopes drawn in the symbol window . A sell signal emerges when the upper envelope/border is broken by the RSI indicator from top to bottom. A buy signal emerges when the lower envelope/border is broken by the RSI indicator from bottom upwards. The indicator can draw arrows on the indicator, draw vertical lines
FREE

YOU CAN NOW DOWNLOAD FREE VERSIONS OF OUR PAID INDICATORS . IT'S OUR WAY OF GIVING BACK TO THE COMMUNITY ! >>> GO HERE TO DOWNLOAD
Camarilla Pivots Historical plots the historical data of the camarilla pivot point levels on the chart. The Camarilla Pivot levels was originated in 1989 by Nick Scott. The levels are used as primary support and resistance levels by Intraday traders. The levels are calculated with the following formula: R4 = C + RANGE * 1.1/2 R3 = C + RANGE * 1.1/4 R2 = C + RANG
FREE
Multi-Timeframe EMA Momentum Filter — Version 1.0 This indicator is designed to help traders evaluate short-term EMA crossovers in the context of higher timeframe momentum. Its purpose is to reduce noise and highlight setups that align with the broader market trend. How it works: On the main chart, arrows appear when a fast EMA crosses a slow EMA on the current timeframe, provided that higher timeframe momentum confirms the direction. In the subwindow, a histogram displays the difference betwee
FREE

Indicator overview Trend indicator usage Moving averages. Highest quality alerts that need no introduction. It is completely loyal to the original algorithm and uses other useful features.
Easy to trade Carry out all kinds of notifications It's not a new paint and it's not a back paint. Setting Indicator SMA50 in Time frame H1 for any pair currency and Gold Spot. EMA200 in Time frame H1 for any pair currency and more than EMA250 for Gold spot. Using it for maximum benefit Set up notification
FREE

The indicator is a 15-minute signal indicator for all types of traders. Meaning, you could make lots of profits trading two different signals in one indicator.
NOTE: Both indicators are channels for achieving the same result. RED ARROW -- Sell Signal BLUE ARROW -- Buy Signal
Purchase now to be part of our community. We offer standard chart setups for both novice and intermediate traders. Trade with ease!
FREE

4 trendlines are given by 2 timeframes, defined by the zigzag indicator. It leverages the Zig Zag indicator to identify significant highs and lows across two configurable timeframes (default: M15 for short-term and H1 for medium-term), automatically plotting upward and downward trendlines for each. This helps visualize trend structures, reversals, and alignments between timeframes without switching charts, while adhering to trendline rules that contain the high and low points of the previous two
FREE
Ultimate Volatility Insight is a highly professional tool for analyzing and fully understanding market activity based on an advanced ATR with improved algorithms and calculation formulas. The indicator helps traders accurately assess market dynamics, identify key support and resistance levels, and effectively manage risks. Ultimate Volatility Insight works only with real data using live statistics. The indicator has been developed for over two years, and its effectiveness has been proven through
Learn how to purchase a trading robot from the MetaTrader Market, the store of application for the MetaTrader platform.
The MQL5.community Payment System supports transactions via PayPal, bank cards and popular payment systems. We strongly recommend that you test the trading robot before buying, for a better customer experience.
You are missing trading opportunities:
- Free trading apps
- Over 8,000 signals for copying
- Economic news for exploring financial markets
Registration
Log in
If you do not have an account, please register
Allow the use of cookies to log in to the MQL5.com website.
Please enable the necessary setting in your browser, otherwise you will not be able to log in.