Watch the Market tutorial videos on YouTube
How to buy а trading robot or an indicator
Run your EA on
virtual hosting
virtual hosting
Test аn indicator/trading robot before buying
Want to earn in the Market?
How to present a product for a sell-through
Technical Indicators for MetaTrader 4 - 26
The Stretch is a Toby Crabel price pattern which represents the minimum average price movement/deviation from the open price during a period of time, and is used to calculate two breakout levels for every single trading day. It is calculated by taking the 10 period SMA of the absolute difference between the open and either the high or low, whichever difference is smaller. This value is used to calculate breakout thresholds for the current trading session, which are displayed in the indicator as
FREE

MASi Three Screens is based on the trading strategy by Dr. Alexander Elder. This indicator is a collection of algorithms. Algorithms are based on the analysis of charts of several timeframes. You can apply any of the provided algorithms.
List of versions of algorithms:
ThreeScreens v1.0 - A simple implementation, with analysis of the MACD line; ThreeScreens v1.1 - A simple implementation, with analysis of the MACD histogram; ThreeScreens v1.2 - Combines the first two algorithms in
FREE

Slope Channel Indicator for MetaTrader
Looking for a tool to analyze market trends suitable for any trading style? Slope Channel – your reliable assistant in identifying directional price movement and key market levels! What is Slope Channel? The Slope Channel is an innovative indicator that constructs a sloped channel on the chart, automatically calculating its parameters based on local extremes. This tool highlights the optimal channel option, allowing you to quickly adapt to changing
FREE
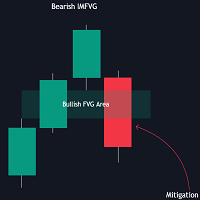
The FVG Instantaneous Mitigation Signals indicator detects and highlights "instantaneously" mitigated fair value gaps (FVG), that is FVGs that get mitigated one bar after their creation, returning signals upon mitigation.
Take profit/stop loss areas, as well as a trailing stop loss are also included to complement the signals.
USAGE Figure 1 Instantaneous Fair Value Gap mitigation is a new concept introduced in this script and refers to the event of price mitigating a fair value gap one

MT5 Version OVERVIEW
This indicator integrates a refined trend-following model with dynamic price rejection detection, dynamic candle coloring, and ATR-based target projection, offering traders a complete visual system for identifying and managing trend continuation setups. It overlays directly on the chart, automatically spots potential trend changes, confirms rejections near adaptive support/resistance, and shows calculated stop-loss and take-profit levels to support structured risk-reward d
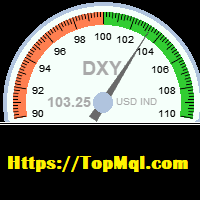
This indicator is used to calculate the dollar index according to the formula of currency pairs(EURUSD ,GBPUSD,USDJPY,USDSEK,USDCHF,USDCAD)Even if the broker does not have the dollar symbol. this Indicator displays the dollar index chart in a separate window at the bottom of the chart. It also displays the current dollar index graphically. In this indicator, it is possible to set the minimum and maximum value of the indicator as well as its size scale on the chart as an input parameter, and it
FREE

BB & RSI Candle Color: Technical Analysis Indicator on MetaTrader 4 The "BB & RSI Candle Color" indicator is a powerful technical analysis tool designed for MetaTrader 4 traders looking for an effective visual representation of market conditions. Created by 13 Crow Trading Club, this indicator combines the popular Bollinger Bands and the Relative Strength Indicator (RSI) to provide clear and accurate visual signals. This indicator offers three key aspects: Candle Color: Normal candles are displa
FREE

Daily pivot are relatively important in trading. This indicator have options to select 5 commonly use pivot point calculations. User input Choose Pivot Point Calculation ( Method Classic, Method Camarilla, Method TomDeMark, Method Fibonacci or Method Woodies. ) Choose Applied Timeframe for the calculation (M5, M15, H1, H4, D1, W1 etc) Can be attached to any timeframe Choose color of Pivot point For MT5 version, please refer here: https://www.mql5.com/en/market/product/38816
FREE

Enhance your trading experience with the Your Chart indicator! This free and highly customizable tool allows traders to merge multiple timeframes into a single, clean candlestick display without altering the original chart. With Your Chart , you can set the number of bars per custom candle – for example, combine every 18 M1 candles into one for a broader view of market trends. Key Features: Custom Candlestick Formation : Choose how many bars to merge into one candle, offering a flexible view of
FREE

BB-Sub – Bollinger Bands in Subwindow BB-Sub is a simple yet powerful indicator that displays Bollinger Bands independently in the subwindow of your chart. Unlike standard Bollinger Bands, which are shown on the main chart, BB-Sub operates in a separate subwindow. This prevents overlapping with candlesticks or other indicators, making it ideal for traders who want to focus purely on the movement and shape changes of the bands. Main Features Simultaneously displays the upper band, lower band, and
FREE

This indicator provides common shapes as drawing object options. The shapes are rotatable, resizable, draggable, and will keep their proportions (according to their handle trendline) across different chart scales. Multiple drawings are supported.
Shapes: Square Rhombus
Triangle (quadrilateral & isosceles) Circle (grid, overlapped grid, flexi grid, rotatable grid, concentric circles) Features: rays (all object edges will be rays) show/hide each individual drawing type, or all delete last drawn ob
FREE

Arrow Indicator (Buy/Sell Alerts) – Simple Yet Powerful Tool! Product Version: 1.01 Indicator Type: Trend Reversal Signals Timeframes Supported: All (Recommended: H1, H4, D1) Key Features: Buy Signal: Green upward arrow () appears below the candle Sell Signal : Red downward arrow () appears above the candle Accurate Trend Reversal Detection – Based on tried and tested SMA strategy. ️ Clean Chart View – Minimalist, non-i
FREE

The LexusBO indicator is recommended for trading binary options . Signals are generated when the RSI, ADX, CCI indicators cross the customizable levels. The indicator displays signals using "up/down" arrows on the chart. Their values are available in the buffer arrays (buffer with index 0 - "up" arrow, with index 1 - "down" arrow). This makes the indicator easy to use for automated trading through specialized Expert Advisors. The recommended timeframe is M5. The indicator has a built-in counter
FREE

The R Wolfe Wave indicator analyses price action and transforms the accumulated data into a powerful Wolfe Wave chart pattern technical tool.
In essence, the R Wolfe Wave chart pattern can be either bullish or bearish and might help traders to open buy and sell trades without any lagging indicators. Key Points
Identifies powerful Wolfe Wave patterns For advanced traders Works for any currency pair Well worth adding to your indicator collection This indicator can work together with any existing
FREE

This indicator applies the biquad high pass filter to the price-chart data, and displays the filter output for the OHLC as candlesticks. The candlesticks corresponds to the actual calculations of the filter value during the formation of each price bar (not from all historical highs lows or closes). The shape of the bars therefore corresponds directly to the shape of each price bar. High pass filters are an underappreciated type of oscillator that are seldom used in technical analysis in the st
FREE

FALCON ZONES , OPORTUNIDADES EN EL MERCADO PARA COMPORAR O VENDER
Características Destacadas: Identificación de Patrones de Velas: Reconoce una amplia gama de patrones de velas, desde patrones simples hasta formaciones más complejas. Proporciona una visión completa de la psicología del mercado encapsulada en las velas. Alertas Personalizadas: Configura alertas a medida para los patrones de velas que más te interesan o que se alinean con tu estrategia. Recibe notificaciones instantáneas cuando s
FREE

This indicator is suitable for trading Forex and Binary Options, depending on its settings. The indicator is designed for trend trading. A buy signal: An up arrow appears on the chart. A sell signal: A down arrow appears on the chart.
Input parameters === Setup CCI === Period CCI 1 - Period of the CCI Period CCI 2 - Period of the CCI Level BUY - Level of the CCI for buying Level SELL - Level of the CCI for selling === Setup RSI === Level SELL - Level of the RSI for selling Period SELL - Period
FREE

This indicator will show week and monthhigh low, very useful to understand the market sentiment. To trade within the range/ break out. Low- can act as support- can used for pull back or break out High- can act as resistance- can used for pull back or break out Breakout strategy refers to the day trading technique that provides traders with multiple opportunities to go either long or short . The main idea is to identify the trend in its most juicy state followed by a trending move.
FREE
Highly configurable Macd indicator.
Features: Highly customizable alert functions (at levels, crosses, direction changes via email, push, sound, popup) Multi timeframe ability Color customization (at levels, crosses, direction changes) Linear interpolation and histogram mode options Works on strategy tester in multi timeframe mode (at weekend without ticks also) Adjustable Levels Parameters:
Macd Timeframe: You can set the lower/higher timeframes for Macd. Macd Bar Shift: you can set the o
FREE

The indicator marks the points on the chart where the standard ZigZag indicator has drawn its top or bottom. With this indicator, you can easily understand where the top or bottom was formed, and where it was redrawn. The indicator gives an alert when a new point appears. Warning! Parameter Applied Price - expands the possibilities of building the indicator. It is possible to build at OPEN, CLOSE and standard HIGH/LOW prices. Input parameters ----------- Depth - period of the ZigZag ind
FREE
Wave Entry Alerts Oil is a custom indicator developed by Azad Gorgis for MetaTrader 4. This indicator is designed to provide alerts based on ZigZag patterns, specifically tailored for trading on the Oil (XIT/USD) symbol.
Key Features: - Chart Window Indicator: The indicator is designed to be displayed on the main chart window. - Arrow Signals: The indicator generates arrow signals on the chart, indicating potential reversal points based on ZigZag patterns. - Customizable Parameters: Traders ca
FREE

Rate of Change Base on the formula, ROC = (Close[n] - Close[n-lookback]) / Close[n-lookback] * 100 to plot the rate of change of a currency pair price action over a lookback period, and provides two global variables, SYMBOL_ROC and SYMBOL_ROC_LOOKBACK, which represent the latest Rate of Change value and the Rate of Change at the previous lookback period. Invoking the indicator using the iCustom function, iCustom ( "Market/RedeeCash_Rate_of_Change.ex4" , Symbol (),5 , 0 ,0); and then retrieving t
FREE

Use GANN 369 to use a combination of 30's,60's,90's time to cross 3's,6's,9's. Any larger combination of these cross smaller combinations of these
Using GANN 369 Method for Trading Reversals The GANN 369 method, inspired by the works of W.D. Gann and Nikola Tesla's 3, 6, 9 numerical patterns, can be employed to identify potential reversals in financial markets. By combining specific periods (30, 60, and 90) with the numbers 3, 6, and 9, traders can seek opportunities for trend changes.
FREE
As we know, МТ4 and МТ5 do not store tick history, which may be necessary to develop trading strategies and market analysis. I have developed a method allowing you to receive tick history very easily. The indicator gathers tick history in real time and writes it to XXXXXX2.hst file, where XXXXXX is a symbol name. This file can be used to create an offline chart or something else. If you use a trading robot, then launch the indicator and control your broker by examining the spread and quotes. All
FREE
Unveiling Quantum Signal Pro: Your Edge in the Market! Are you tired of second-guessing your trading decisions? Do you wish you had a clearer, more precise way to spot market trends and potential reversals? Look no further! Quantum Signal Pro is here to transform your trading experience, offering a sophisticated yet easy-to-understand system that cuts through the market noise to deliver actionable insights. Imagine having a reliable partner that guides you to high-probability trade setups, confi
FREE
FlatBreakout (Free Version) Flat Range Detector and Breakout Panel for MT4 — GBPUSD Only FlatBreakout is the free version of the professional FlatBreakoutPro indicator, specially designed for flat (range) detection and breakout signals on the GBPUSD pair only.
Perfect for traders who want to experience the unique fractal logic of FlatBreakout and test breakout signals on a live market without limitations. Who Is This Product For? For traders who prefer to trade breakout of flat ranges (breakout,
FREE

Multi timeframe fractal indicator which shows the higher timeframe's fractal point on lower timeframes.
Parameters Fractal_Timeframe : You can set the higher timeframes for fractals. Maxbar : You can set the maximum number of candles for the calculations. Up_Fractal_Color, Up_Fractal_Symbol, Down_Fractal_Color, Down_Fractal_Symbol : Color and style settings of the fractal points. Extend_Line : Draws a horizontal line from the previous fractal point until a candle closes it over or a user-specif
FREE

This indicator shows us the trend or direction of the market and a possible stop loss
This indicator works with two parameters, period and multiplier. Buy and sell signals are generated when the indicator crosses the closing price and it changes color.
This indicator is used in all types of markets such as stocks, futures, forex, cryptos, additionally it can be used in different time periods: hours, daily, weekly, etc.
It is recommended not to use it while the market is sideways, this can be
FREE

The indicator displays crossing zero level by Moving Average of Oscillator (OsMA) in the form of arrows. The this is a multi-timeframe indicator, and it displays signals from other timeframes. The indicator notifies about a signal by means of a pop-up Alert window, or sending notification to e-mail.
Parameters Time-frame - select timeframe to show indicator signals. Fast EMA Period - fast EMA. This is an exponential moving average from a price with a short period. Slow EMA Period - slow EMA. Th
FREE
This indicator was developed to support multiple timeframe analysis. In the indicator settings, the user can set the color, width, and style of the horizontal lines for each timeframe. This way, when the horizontal lines are inserted into the chart, they will be plotted with the timeframe settings.
MTF Lines also allows visibility control of another objets like rectangles, trend lines and texts.
This is a product developed by Renato Fiche Junior and available to all MetaTrader 4 and 5 users!
FREE

MT5 Version Most indicators draw lines.
This one draws the battlefield. If you ever bought an EA or indicator based on a perfect equity curve — and then watched it bleed out live — you’re not alone.
The problem? Static logic in a dynamic market. Fibonacci Bollinger Bands adapts.
It combines Bollinger structure with customizable Fibonacci levels to mark zones of control — where price reacts, pauses, or reverses. No magic. Just logic that follows volatility. Why this tool matters It shows yo
FREE
Highly configurable Bollinger Bands indicator. Features: Highly customizable alert functions (at levels, crosses, direction changes via email, push, sound, popup) Multi timeframe ability Color customization (at levels, crosses, direction changes) Linear interpolation option Works on strategy tester in multi timeframe mode (at weekend without ticks also) Parameters:
Bollinger Bands Timeframe: You can set the lower/higher timeframes for Bollinger Bands. Bollinger Bands Bar Shift: Y ou can set
FREE

The indicator is specially designed for the trading utility Trade Shell (included Trade Shell SMC ) to get it working on visual strategy tester.
Backtest your trading ideas and indicators. Run Trade Shell on visual tester and then put this indicator on the chart. After that you will be able to control all functions of the Trade Shell as well as with live using! It does not work live! Use it with visual tester only. It does not require to set any setting on input parameters.
Have a good luck
FREE

The indicator shows the maximum and minimum number of lots, as well as the size of the symbol spread. This information is needed to make a quick market entry decision based on the deposit maximum. The calculation considers free funds and funds sufficient for opening one lot. Such situations are common when you participate in various forex contests or trade in the market using your funds to the maximum, as well as during periods of increased or decreased volatility. The indicator provides the nec
FREE

The TMA Centered Bands indicator for MT4 draws bands on the chart and reports the overall price trend, as well as gives arrows signals to buy and sell when the bar closes outside the channel.
Unlike many TMAs, our version uses the calculation part of the algorithm without redrawing, and also adds the ability to select a symbol. The bands are made up of moving averages, and each of them has an MA period. The name TMA comes from triangular moving averages, as the indicator draws triangular bands
FREE

The " Multi Kernel Regression " is a versatile trading indicator that provides graphical interpretations of market trends by using different kernel regression methods. It's beneficial because it smoothes out price data, creating a clearer picture of price movements, and can be tailored according to the user's preference with various options.
What makes this indicator uniquely versatile is the 'Kernel Select' feature, which allows you to choose from a variety of regression kernel types, such as
FREE

How to Create an Automated Trading Robot Have you ever wondered how powerful it would be to automate your trading strategies with just a few clicks of the mouse? Imagine having the freedom to create and test different trading strategies without the need to dive into complicated code. With Rule Plotter, this vision becomes a reality. Here we will explore how you can create your own custom trading robot using Rule Plotter, a trade-system creation tool that simplifies the entire process. What is Ru
FREE

Because style matters I know how annoying it is to click properties every time to change the candle’s color, the background to light or dark, and put or remove the grid. Here is the solution with one click: Three customizable buttons to choose the candle style that traders want. One button to switch between Day and Night mode. One button to show or hide the Grid on the charts. *****On the settings, you can choose where the buttons should be displayed on the screen***** Please consider checking
FREE
Drawdown Alerts Free ! Meta Trader 4 Indicator. Please leave a review about this product to help other users benefit from it. This Drawdown Alerts indicator shows the drawdown percentage in real time and alerts you when the limit you specify is reached. Calculation of drawdown depends on the amount of the trade balance. You can customize Drawdown Alerts for Corner - Left , Right , Up , Down X Y Color Number of decimal digits Popup messages and sound - Turn on / off notifications Notification
FREE

Всем привет. Предлагаю на обозрения очень достойный индикатор входы очень четкие можно по мартину отрабатывать 30 мин до и после новостей не торгуем можно накинуть индикатор новостей больше вам не чего не надо есть сигнал стрелка за крепилась на следующую входим Экспирация любая валюта тоже любая. осцилляторы и авторский алгоритм.И еще можно через бот авто торговля на скрине.И еще друзья после приобретения или аренды пишем мне свои контакты я вам помогу все настроить что бы работало на авто то
FREE

Future prediction is something any trader would love to know, through this simple prediction algorithm can give a picture of the future. This algorithm is based on past data and the average prices of the data to simulate future candles. This is an indicator that will be redrawn. This indicator is completely free, can be used as a trend reference but absolutely do not use for trading.
FREE

Session Killzone Indicator
Indicator that helps you to identify the killzone times of both London and NewYork sessions which usually is the most times for high volatility and taking liquidity from the market. Killzone times are configurable through indicator parameters. The indicator adjusts the range of the killzones based on the daily trading range.
FREE

This indicator is designed for scalping in the Forex market and trading binary options. A signal appears at the opening of a new candle. Usage Recommendations: For Binary Options: It is recommended to open trades when a signal appears on the first candle. A buy signal appears when the blue X replaces the red one, while a sell signal occurs when the red X replaces the blue one, as shown in the screenshots. For the Forex Market: Enter a trade when a signal appears as described above. It is advisa
FREE

Investment Castle Indicator has the following features: 1. Dictates the direction of the trend in different Timeframes . 2. Shows the hit rate and winning rate on the chart. 3. This indicator does not repaint the chart. 4. This indicator is built-in the Support & Resistance based Investment Castle EA which works with Psychological Key Levels "Support & Resistance" Indicator.
FREE

+ 2 bonus strategies! Alerts! I recommend watching my advisor - Night Zen EA The indicator combines the most popular moving average strategies: Simple moving average crossover. Moving average crossover relative to the position of the slower moving average. 2 bonus strategies : The crossing of the fast moving average with the calculation of the opening prices of the slow moving average with the calculation of the closing prices taking into account the slower moving average. (The settings for th
FREE

As you know, the price always moves in a certain channel and when the price goes out of the channel, it always tends to return back to the trading channel The Ind Channel Exit indicator will help you not to miss the price going out of the channel It can show an alert or send a message to the terminal on your smartphone that the next bar has closed above or below the channel levels It has a minimum number of settings and the main parameter is the Channel Multiplier , which determines the width o
FREE

If you like this project, leave a 5 star review. Often times we are using brokers that are outside of the GMT-0 timezone, this
not only complicates things, but, it can make seeing when a trading session starts
a bit more difficult than it should. This indicator allows you to set a timezone offset it will draw a vertical line for the: Day. Week. Month. Quarter. year.
FREE

Indicator draws Round Number lines by distance of pips. 1. You can enable / disable indicator to show / hide the lines. 2. You can set distance of pips between the lines. 3. You can edit the number of lines. 4. You can edit properties of lines by inputs (style (DASH, DOT, SOLID, ...) , width (1 for DASH, DOT, 2 is not for DASH, DOT, it only SOLID), color). When indicator is deleted from the chart, the lines will be removed.
FREE
Highly configurable Balance of Power (BOP) indicator.
Features: Highly customizable alert functions (at levels, crosses, direction changes via email, push, sound, popup) Multi timeframe ability Color customization (at levels, crosses, direction changes) Linear interpolation and histogram mode options Works on strategy tester in multi timeframe mode (at weekend without ticks also) Adjustable Levels Parameters:
BOP Timeframe: You can set the lower/higher timeframes for Balance of Power . BOP
FREE

MA Crossover Arrows is a simple indicator that draws arrows and alerts when two moving averages crossover.
Supported types of moving averages Simple Exponential Smoothed Linear Weighted
Supported Price types Close Open High Low Median Price (HL/2) Typical (HLC/3) Weighted Close (HLCC/4) When the fast moving average crosses above the slow moving average, a green up arrow will appear on the chart. When the fast moving average crosses below the slow moving average, a red down arrow will appear on
FREE

The Average Entry Positions Indicator provides traders with a clear visual representation of their average buy and sell entry prices on the chart. This powerful tool now calculates and displays crucial trade management information, aiding in better decision-making and efficient position tracking. By using this tool, traders can quickly assess their overall entry positions at a glance. -------------------------------------------------------------- ------------------------------------------------

Highly configurable Fisher Transform indicator.
Features: Highly customizable alert functions (at levels, crosses, direction changes via email, push, sound, popup) Multi timeframe ability Color customization (at levels, crosses, direction changes) Linear interpolation and histogram mode options Works on strategy tester in multi timeframe mode (at weekend without ticks also) Adjustable Levels Parameters:
Fisher Transform Timeframe: You can set the lower/higher timeframes for Stochastic. Fisher
FREE
Dominate the Market with the Laguerre Edge Signal Indicator! Stop guessing and start trading with confidence! Our Laguerre Edge Indicator is your ultimate tool for spotting high-probability entry points. This indicator combines the power of two classic analysis methods— moving averages for trend direction and the Laguerre RSI for pinpointing reversals —all filtered by the solid EMA 200 trend line . It's designed to give you clear, objective signals directly on your chart. Key Features and Adva
FREE

Introducing the Pivot Point Selector Indicator: Your Ultimate Tool for Custom Pivot Levels Are you ready to take your trading to the next level? Say hello to the Pivot Point Selector Indicator, a game-changing tool that puts you in control of your pivot levels. This innovative indicator empowers you to choose three specific points that will determine the pivot level calculations, giving you unparalleled customization and precision in your trading strategy. Key Features and Benefits: Custom Pivo
FREE

The indicator is based on the concept of price channels, which are formed by plotting the highest high and lowest low prices over a specified period of time. The Donchian Channel Indicator consists of three lines: an upper channel line, a lower channel line, and a middle channel line. The upper channel line represents the highest high over a specified period, while the lower channel line represents the lowest low. The middle channel line is the average of the two and can be used as a reference f
FREE

How would you like to instantly know what the current trend is? How about the quality of that trend? Finding the trend on a chart can be subjective. The Fractal Trend Finder indicator examines the chart for you and reveals what the current trend is based on objective criteria. Using the Fractal Trend Finder you can easily tell if you are trading with the trend or against it. It also identifies those times when the market is not trending. Theoretically, you could trade with the trend when the tre
FREE
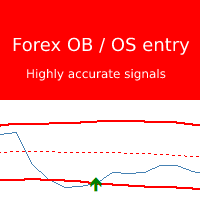
Forex overbought / oversold entry indicator is based on a very powerfull strategy which give very accurate entry arrows. The indicator place arrows on "new candle" and does NOT repaint! This indicator is a MUST HAVE if you trade with a reversal strategy. This indicator can easely be combined with your other trading indicators to confirm reversals or bottoms. If you have ever had any trouble finding correct entries this indicator is the best available for you! Standard overbought and oversold str
FREE

MT5 version Overview
The Lowess Channel indicator is a smoothed trend-following tool designed to help traders identify the direction of the trend , detect flat or ranging markets , and spot breakouts from consolidation zones. It creates a central smoothed line with upper and lower channel boundaries, adapting to market noise while maintaining clarity. How It Works The indicator builds a channel around a smoothed price line. The central line reflects the current trend. The upper and lower bound
FREE

A simple and highly effective Strength and Weakness currency indicator that can be used to aid your fundamental and technical analysis for winning trade decisions.
The indicator is very easy to use and can be applied to all time frames.
FX Tiger uses an advanced algorithm to calculate a score table for all major currencies. Each major currency will have a score from 7 to -7. A score of 5 and above indicates currency strength and a score of -5 and below indicates currency weakness. Once you ha
FREE
Forex and Gold OBI is an innovative indicator based on a study of price and market dynamics, utilizing the RSI indicator. This indicator helps you find the best moment to enter the forex market by signaling when the market is in overbought or oversold conditions. Moreover, The indicator calculates two possible targets and the stop loss for each trade, allowing you to optimize your risk/reward ratio. Price This indicator is easy to use and set up, working with any currency pair and timeframe. If
FREE

RSI Table: Your Ultimate Multi-Timeframe RSI Command Center!
Are you tired of constantly switching between charts and timeframes just to get a comprehensive view of the Relative Strength Index (RSI) across your favorite assets? Do you miss crucial overbought or oversold signals because they're hidden on another chart?
Introducing the RSI Table – the indicator designed to give you an instant, panoramic view of RSI values across multiple instruments and timeframes, all on a single, intuitive dash
FREE

BinaryWizardMT4 is a powerful indicator for trading short-term binary options. In fact, this is a ready-made trading system. The indicator calculates the reference point and a short-term support and resistance levels. After the current price crosses the resistance level, a sell signal is formed (SIGNAL: SELL). Similarly, after the price crosses the support line, a buy signal is activated (SIGNAL: BUY).
Parameters x1, y1 - binding coordinates of the indicator window to the upper left chart corne
FREE
How To Trade
Execute your trades in 3 Easy Steps!
Step 1: Trade Setup Entry Buy = If daily open market Above Line PIVOT or can Price has touched and closed the candle above Resistance1. Entry Sell = If daily open market Under Line PIVOT or can Price has touched and closed the candle above Support1. Step 2: Set Stop Loss Stop loss BUY ----> You can set stop loss on Line Pivot or Support1. Stop loss SELL ----> You can set stop loss on Line Pivot or Resistance1. Step 3: Set Take Profit Take profi
FREE

Master the market: harness the power of statistical arbitrage
This indicator showcases the price action of multiple instruments on a single chart, enabling you to compare the fluctuations of different assets and seamlessly implement statistical arbitrage strategies. Its main usage is to find correlated symbols which are temporarily out of whack.
[ Installation Guide | Update Guide | Troubleshooting | FAQ | All Products ]
Find overbought or oversold currency pairs easily Plot up to six currency
FREE

The Magic LWMA indicator is of great help in determining trend direction. It can be an excellent addition to your existing strategy or the basis of a new one. We humans can make better decisions when we see better visually. So we designed it to show a different color for rising and falling trends. Everyone can customize this in the way that suits them best. By setting the Trend Period, we can optimize it for longer or shorter trends for our strategy. It is great for all time frames.
IF YOU NEE
FREE

The tool that will help you calculate the lot accurately for the risk you need, if you want to risk 1% of your account, just enter the entry, target and stop values and you will have the lot size to use and only lose the chosen percentage. You can also choose a fixed value. This tool will help you with consistency, because you can only be consistent if you operate consistently and enter with fixed loss values, it is an INFALLIBLE way to be consistent!!!!
FREE
RaysFX Trade Info Ciao a tutti, sono entusiasta di presentarvi il nostro ultimo indicatore, RaysFX Trade Info . Questo strumento è stato progettato per fornire informazioni dettagliate sulle vostre operazioni di trading direttamente sul vostro grafico MT4. Caratteristiche principali Informazioni in tempo reale : RaysFX Trade Info fornisce informazioni in tempo reale sulle vostre operazioni aperte e chiuse. Potete vedere il profitto in punti, in valuta e in percentuale. Personalizzabile : L’in
FREE

Indicator measures strength of each currency in your list.
Main idea: It simply iterates through all combinations of pairs and adds difference between open and close in percent. Parameters: List of currencies - what currencies will be calculated (maximum is 8) Calculation type - from which data will be strength calculated Calculation data input - used as input related to calculation type Symbol suffix - used in case of suffix on symbols, e.g: when your symbols look like EURUSDm, EURUSDmicro etc
FREE

The BB Arrows MTF indicator is based on the Bollinger Bands indicator. Represents input signals in the form of arrows. All signals are generated on the current bar. In 2 modes, Signals are not redrawn (Exception of very sharp jumps)! All signals in MTF mode correspond to signals of the period specified in MTF. It is maximally simplified to use both for trading with only one indicator and for using the indicator as part of your trading systems. A feature of the indicator is that the indicator ti
FREE

A multi-currency, Multi-time frame indicator that allows you to see the trend based on the intersection of 2 EMA without additional clicks, it searches for the last intersection on all timeframes at once and writes in the upper left corner in which direction the trend of the open currency pair is directed, as well as how long ago the last intersection was.
Based on this indicator, you can open orders if most of the trends are directed in the 1 direction and exit trades when the situation chang
FREE
Learn how to purchase a trading robot from the MetaTrader Market, the store of application for the MetaTrader platform.
The MQL5.community Payment System supports transactions via PayPal, bank cards and popular payment systems. We strongly recommend that you test the trading robot before buying, for a better customer experience.
You are missing trading opportunities:
- Free trading apps
- Over 8,000 signals for copying
- Economic news for exploring financial markets
Registration
Log in
If you do not have an account, please register
Allow the use of cookies to log in to the MQL5.com website.
Please enable the necessary setting in your browser, otherwise you will not be able to log in.