Watch the Market tutorial videos on YouTube
How to buy а trading robot or an indicator
Run your EA on
virtual hosting
virtual hosting
Test аn indicator/trading robot before buying
Want to earn in the Market?
How to present a product for a sell-through
Technical Indicators for MetaTrader 4 - 29

The tool that will help you calculate the lot accurately for the risk you need, if you want to risk 1% of your account, just enter the entry, target and stop values and you will have the lot size to use and only lose the chosen percentage. You can also choose a fixed value. This tool will help you with consistency, because you can only be consistent if you operate consistently and enter with fixed loss values, it is an INFALLIBLE way to be consistent!!!!
FREE

This indicator is a useful tool for visualising cyclic components in price. It calculates the Discrete Fourier Transform (DFT) of a price chart data segment selected by the user. It displays the cycles, the spectrum and the synthesised signal in a separate window. The indicator is intended as a learning tool only, being unsuitable for providing actual trade signals. Download the file - it is a free toy. Play with it to understand how signals can be transformed by controlling their cyclic comp
FREE
The purpose of this new version of the MT4 standard indicator provided in your platform is to display in a sub-window multiple timeframes of the same indicator. See the example shown in the picture below. But the display isn’t like a simple MTF indicator. This is the real display of the indicator on its timeframe. Here's the options available in the FFx indicator: Select the timeframes to be displayed (M1 to Monthly) Define the width (number of bars) for each timeframe box Alert pop up/sound/ema
FREE

Do you use dynamic ranges (like Bollinger Bands or Envelopes) in your trading? A fixed period is usually used for such calculations. But is such approach relevant to the very nature of the market? In fact, the price chart consists of a series of successive processes - trends and flats. In this case, we can talk about the internal development logic inside a single process only. Therefore, the nature of the market is better described by dynamic ranges designed for the processes occurring "here and
FREE

The indicator is a multifunctional tool for automating the analysis and visualization of the trading process. Main features:
News display — the indicator automatically loads and displays economic news on the chart, allowing you to take into account important events when trading. Dynamic timeframe change — during the news release, the chart switches to a preset period for more detailed analysis. Adapting to the number of orders — the timeframe can change automatically depending on the number of
FREE

BinaryWizardMT4 is a powerful indicator for trading short-term binary options. In fact, this is a ready-made trading system. The indicator calculates the reference point and a short-term support and resistance levels. After the current price crosses the resistance level, a sell signal is formed (SIGNAL: SELL). Similarly, after the price crosses the support line, a buy signal is activated (SIGNAL: BUY).
Parameters x1, y1 - binding coordinates of the indicator window to the upper left chart corne
FREE

This powerful tool helps you to easily access Fibonacci tools at different times and in different markets. This tool has the ability to send signals based on Fibonacci as well as setting alarms to be aware of broken Fibonacci levels. Among the capabilities of this tool are the following:
Identifies market trends Fibonacci auto design If Fibonacci levels are broken, it sends a message Send Fibonacci signal
Manuals: After selecting the target market, run the tool In the input settings according
FREE

Smart Scalper's Edge: The Triple-Filter Signal Tired of chasing false signals? The "Smart Scalper's Edge" is your unfair advantage in the market, designed for traders who demand precision and confirmation. This indicator doesn't just rely on a simple crossover; it uses a powerful triple-confirmation system to filter out the noise and pinpoint high-probability trading opportunities. Get the clarity you need to enter the market with confidence! Key Advantages: Trade Smarter, Not Harder Filter Out
FREE

This is the Indicator is free to use and based on my "TheTurtleTrader" EA. Introducing the Turtle Traders Donchian Channel Indicator – inspired by an advanced trading system by the legendary Turtle Traders of the early 1980s, designed to bring authentic and diverse strategies to your trading portfolio.
Core Strategy:
This Indicator leverages a proven breakout strategy by displaying the highest high or lowest low over a defined period. Whether you prefer quick scalping trades or long holdin
FREE

Product Title Smart Moving Averages (MT4) – part of the SmartView series Short Description A Moving Averages indicator with a unique user experience on MetaTrader platform. Features advanced capabilities not previously available, such as opening settings with double-click, hiding and showing indicators without deleting them, and displaying indicator windows at full chart size. Designed to work seamlessly with the rest of the SmartView Indicators series. Overview The SmartView series offers a uni
FREE

This simple indicator takes information from Ichimoku Kinko Hyo to establish strong and weak currencies to pair together for ideal trending situations. It also generates buy or sell signals based on the standard deviation of returns together with currency strength. A currency is said to be strong or weak depending on where the price is in relation to two factors: if the price is above the daily kumo and above the 26 day Kijun-sen, it is said to be strong. Likewise, when trading below the daily k
FREE
Altopium Trend is an indicator that identifies short-term trends. The signals it generates can be used to open long or short positions or can be integrated with other indicators/strategies. This is a trend indicator, be careful during narrow sideways phases. I recommend using it as a short-term trend indicator, complemented by other indicators that show the best times to enter the market.
Wait for the bar to close to confirm the signal.
FREE

Индикатор "Trend zone" Помощник трейдеру, показывает на графике текущую тенденцию. Он надеюсь станет незаменимым индикатором в ваше трейдинге. Индикатор не перерисовывается и не меняет свои значения про переключение временных периодов The "Trend zone" indicator is a trader's assistant, shows the current trend on the chart. I hope it will become an indispensable indicator in your trading. The indicator does not redraw and does not change its values about switching time periods
FREE

Do you like scalping? Th is indicator displays information about the latest price quotes received from the broker. [ Installation Guide | Update Guide | Troubleshooting | FAQ | All Products ]
Identify tick trends easily A blue row means the price has increased A red row means the price has decreased Customizable colors and font sizes Display your desired amount of rows The indicator is non-repainting
Parameters Rows: amount of rows with data to display in the chart Font size: font size of the t
FREE

The Multi-Timeframe High Low Points (MTF High Low Points) indicator is a powerful tool for traders using MetaTrader 4 (MT4) to analyze price movements across different timeframes. This versatile indicator helps traders identify significant support and resistance levels by displaying the highest and lowest price points within a specified number of bars on multiple timeframes simultaneously. Key Features: Multi-Timeframe Analysis: MTF High Low Points allows traders to monitor high and low price le
FREE

The Commitments of Traders Ratio Indicator is one of these things you never thought about it before you really see the magic behind it. The indicator shows the Ratio of long/short positions released by the CFTC once a week.
If you have a look on the Sreenshot you can see two (three) zones of interest. Zone 1: The Switches (Red -> Green, Green -> Red) Zone 2: MA cross Zone 3: If you combine this with the COX indicator an additional zone will appear. You also can experiment with Ratio crossing MA
FREE

A signal indicator consisting of several well-known indicators that process data sequentially. 2 options - for schedule and basement. In the settings it is possible to enable alerts about the change of trend (alerts) sound, by e-mail and push. It is possible to change the colors and thickness of the lines, the colors and codes of the arrows, the number of calculation bars and separately configure the parameters included in the indicators.
FREE

Note : New in 1.6: the indicator now exports the trade signal (but not displayed). Go long with light blue. Go short with red. Exit otherwise. Signal to be imported to your EA using iCustom. This indicator provides Best of the Best linear filter momentum oscillators that I am aware of (Low Pass Differentiators, LPD's) . All of them are recent developments by this developer, or other researchers. The oscillator line is the first buffer of the indicator, and can be called in other indicators or
FREE
Introduction and Description The commodity channel index (CCI) is an oscillator originally introduced by Donald Lambert in 1980. Since its introduction, the indicator has grown in popularity and is now a very common tool for traders in identifying cyclical trends not only in commodities but also equities and currencies. The CCI can be adjusted to the timeframe of the market traded on by changing the averaging period. CCI indicator with different colors at levels 0, 100 and -100. The cross is a
FREE

Slope Channel Indicator for MetaTrader
Looking for a tool to analyze market trends suitable for any trading style? Slope Channel – your reliable assistant in identifying directional price movement and key market levels! What is Slope Channel? The Slope Channel is an innovative indicator that constructs a sloped channel on the chart, automatically calculating its parameters based on local extremes. This tool highlights the optimal channel option, allowing you to quickly adapt to changing
FREE
BinaryPin is an indicator developed and adapted specifically for trading short-term binary options. The indicator's algorithm, before issuing the signal, analyzes many factors, such as market volatility, searches for the PinBar pattern, calculates the probability of success when making a deal. The indicator is set in the usual way. The indicator itself consists of an information window where the name of the trading instrument is displayed, the probability of making a successful transaction, the
FREE

Arrow Indicator (Buy/Sell Alerts) – Simple Yet Powerful Tool! Product Version: 1.01 Indicator Type: Trend Reversal Signals Timeframes Supported: All (Recommended: H1, H4, D1) Key Features: Buy Signal: Green upward arrow () appears below the candle Sell Signal : Red downward arrow () appears above the candle Accurate Trend Reversal Detection – Based on tried and tested SMA strategy. ️ Clean Chart View – Minimalist, non-i
FREE

Free Scalping is a comprehensive manual system developed for the most efficient trading at any market conditions and time scale.
The system is based on two main blocks:
1. The block of trend determination that calculates dynamic support and resistance. The function of auto-optimization is available for this block.
2. The block of price deviation from its median based on the big set of regressions to get the statistically-valid result. Entry rules For buys:
1. The trend goes up
2. The price i
FREE

Supply and Demand indicator does not repaint as it counts the number of tests/retests occurred in the past x number of times. As a trader you need a path to be able to place your buy and sell trades such as: Supply and Demand, Falling & raising channels . Experienced trades will draw the key levels and channels around the timeframes. But, they will not be able to draw them on the small time frames as the price changes too frequent. This indicator is based on Shved supply and demand indicator, b
FREE

Please refer to full version: https://www.mql5.com/en/market/product/140908
Key Zone Detector Key Level Supply & Demand Zone Detector Overview A sophisticated supply and demand zone detection indicator that identifies and rates key price levels where significant market activity occurs. The indicator uses fractal analysis and multiple validation methods to detect and classify trading zones. Key Features Zone Detection Auto-detects support and resistance zones Uses dual fractal system (fast and
FREE
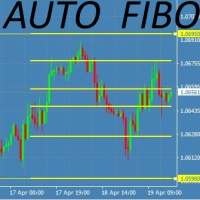
This Fibonacci Indicator is showing fibo retracement lines on chart for EA trading same as the default tool from Metatrader's menu, except this one is fully automatic and changes along with the chart (with modes B and C, then mode A is always fixed by set levels)
AND it also offers the line levels for the Expert Advisors to read (buffers) , so you can set your trades based on crossover\crossunder on those fibo lines.
You can choose from 3 modes for selecting the max HIGH and min LOW limit,
and
FREE
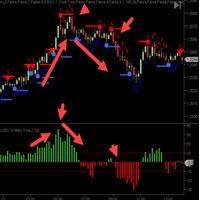
The C ycleTraderPro Close Strength Value Indicator measures the distance from the OPEN of a new bar to the CLOSE of that bar. Input - length = 10 default We add these values together going back the the length setting. If the 1st bar was plus 10 ticks and then the next bar was minus 7 ticks, then this would register +3
There are 2 ways to trade Close Strength Value: 1. Trading in the direction of lower highs and lower lows and vice versa for buys, higher highs, and higher lows. 2. Trade when the
FREE
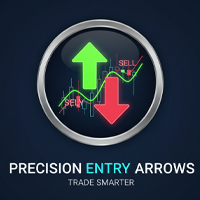
Precision Entry Arrows: Never Miss a High-Probability Trade Again! Stop guessing and start trading with confidence. The Precision Entry Arrows indicator is a sophisticated, all-in-one tool designed to deliver high-quality, non-repainting Buy and Sell signals directly on your chart. It expertly combines the power of MACD , Stochastic , and a unique EMA 5 Cross to pinpoint exact entry moments , then filters everything through a long-term EMA 200 to ensure you are always trading with the major tre
FREE

This indicator is very useful for day traders or short term traders. No need to calculate the number of pips manually, just look at the chart and you will see the Virtual Take Profit / Virtual Stop Loss target line and evaluate whether the entry point is feasible to reach the intended target or not.
Enter the intended Take Profit / Stop Loss pips for your trade. The indicator will display Virtual Take Profit / Virtual Stop Loss lines for you to easily see if the target is feasible or not.
FREE

This indicator smoothes the value of CCI (Commodity Channel Index) and reduces its volatility. By using this indicator, the fluctuations created by the CCI indicator are reduced. The smoothed CCI value is placed in a buffer that you can use in your EA and strategy. Leave me a comment if you want By using this indicator, you no longer need to use the Moving Average indicator on the CCI indicator.
FREE
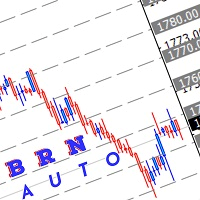
Use this indicator to draw multiple horizontal line to nearest round number Range for round number can be adjust manually depend how user want to use it Selection of colour also can be adjust manually Hope this indicator can help somebody in their trading.
How to use this: Mostly I use this indicator for break, retest and entry. example:- current price XAUUSD :1740.00 which mean the closest level are 1750.00 and 1730.00 Wait for price to break this level. then wait for retracement if price maki
FREE

The Channel Builder (CB) or Ivanov Bands indicator is a broad generalization of the Bollinger Bands indicator. First, in CB, the mean line <X> is calculated using various averaging algorithms. Secondly, the mean deviations calculated by Kolmogorov averaging are plotted on both sides of the middle line <X>. The middle line <X>, besides the standard SMA, EMA, SMMA and LWMA averaging algorithms, can be Median = (Max + Min) / 2 sliding median (which is the default). In
FREE

The TLR indicator is a market trend identification indicator. The idea behind this indicator is to use 3 linear regression lines, one short-term, one medium-term, and one long-term. The UPTREND will be determined when: The long-term linear regression line and the medium-term linear regression line have an uptrend. The long-term linear regression line has an uptrend, the medium-term linear regression line has a sideway, and the short-term linear regression line has an uptrend. The DOWNTREND will
FREE

Heiken Aish indicator that generates alerts when the market changes direction. It eases the visualization of market volatility, providing greater calm when making decisions. Blue means buying and yellow means selling. A candle without a wick indicates a strong trend, i.e., blue candles without wicks at the bottom indicate a strong buying trend and vice versa, yellow candles without a wick at the top indicate a strong downtrend.
FREE
FastTMALine_mth_PRT is non-redrawn channel indicator and can be used to identify trend and support and resistance levels.
Indicator settings allow you to assign a specific coefficient to each price channel, which makes it possible to narrow or expand each channel separately. The FastTMALine_mth_PRT indicator is a multicurrency instrument, so the choice of a timeframe depends solely on the trader’s preference. FastTMALine_mth_PRT indicator can be used on any time frame, so you can eas
FREE

This indicator is based on Mr. Mark Fisher's ACD strategy, based on the book "The Logical Trader."
- OR lines - A lines - C lines - Daily pivot range - N days pivot range - Customizable trading session - Drawing OR with the desired time Drawing levels A and C based on daily ATR or constant number - Possibility to display daily and last day pivots in color zone - Displaying the status of daily PMAs (layer 4) in the corner of the chart - Show the order of daily pivot placement with multi-day pi
FREE

The indicator is based on the concept of price channels, which are formed by plotting the highest high and lowest low prices over a specified period of time. The Donchian Channel Indicator consists of three lines: an upper channel line, a lower channel line, and a middle channel line. The upper channel line represents the highest high over a specified period, while the lower channel line represents the lowest low. The middle channel line is the average of the two and can be used as a reference f
FREE

Trend is Friends is an line Indicator used as an assistant tool for your trading strategy. The indicator analyzes the standard deviation of bar close for a given period and generates a buy or sell trend if the deviation increases. It good to combo with Martingale EA to follow Trend and Sellect Buy Only/Sell Only for EA work Semi-Automatic. You can use this Indicator with any EAs in my Products.
FREE

Полная версия индикатора находится здесь .
Индикатор предназначен для торговли внутри дня. Строит канал по пробою крайних уровней которого вы можете открывать ордер на покупку или продажу. Во флетовом рынке работа ведётся на отбой от этих уровней. Для фильтрации входов используется цветная гибридная скользящая средняя. Настройки по умолчанию предназначены для терминального времени GMT +3 (подходит для большинства брокеров) и для терминалов с пятизначными котировками. Индикация канала и уровней A
FREE

The purpose of this new version of the MT4 standard indicator provided in your platform is to display in a sub-window multiple timeframes of the same indicator. See the example shown in the picture below. But the display isn’t like a simple MTF indicator. This is the real display of the indicator on its timeframe. Here's the options available in the FFx indicator: Select the timeframes to be displayed (M1 to Monthly) Define the width (number of bars) for each timeframe box Alert pop up/sound/ema
FREE

Indicador "Trade Zones: Supply and Demand Opportunities" para MetaTrader: Eleva tu Trading con Precisión Estratégica El indicador "Trade Zones: Supply and Demand Opportunities" es una herramienta revolucionaria diseñada para potenciar la toma de decisiones de los traders al identificar claramente las zonas de oportunidad basadas en los principios fundamentales de oferta y demanda. Este indicador, compatible con MetaTrader, proporciona una visión intuitiva de las áreas críticas del mercado donde
FREE
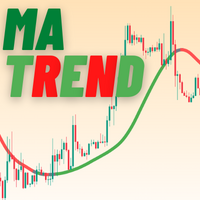
MATrend indicator makes the directional trend of the current market easily recognizable. Settings: MA Period : The amount of candles taken into consideration for the calculation of the moving average; MA Method : The method used for the calculation of the moving average. Selectable methods are: Simple averaging;
Exponential averaging;
Smoothed averaging;
Linear-weighed averaging; Usage: The color of the indcator will change based on the slope of the MA. Green : The indicator has a bullish sl
FREE
倒计时指标功能介绍 类别
解释
备注
预计结束倒计时 计算当前周期蜡烛图的结束时间(可应用于所有周期),其考虑了蜡烛图可能会因为日常休市而提前结束的情况; 如果该蜡烛图包含多个休市和开市的情况下,以最后的休市或者蜡烛图收盘时间为准。 值得特别注意的是:本指标并没有将平台额外公布的节假日休市、修改休市或者开市时间等因素纳入考虑范围,它仅仅是基于MT4所公开的交易时间做计算,无法100%确保本品种的收盘或者开盘时间无误 ,故使用者需提前明确该品种交易时间情况。
预计开盘倒计时 仅限于状态为"休市中"的提示,根据MT4上公开显示开市时间进行预估大约还有多久时间开盘; 和预计结束倒计时类似,并没有将额外公布的时间纳入考量。由于W1和MN1周期中包含多次的开盘和收盘,所以该两周期无休市提示。
【状态】 颜色 状态 备注 绿色 正常 一切正常 黄色 服务器无报价 服务器实际上传送到MT4并非是毫无中断的,可能是1分钟之内出现多次,甚至是连续较长的时间无报价,取决于您所处的网络延迟、服务器的情况等等。
本品种已有X秒无报价 MT4上并不是所有的品种的报价都是最新的,有可能某个品种长期无
FREE

Leonardo Breakout SMC – Advanced Trading Indicator
Overview The Leonardo Breakout SMC is a masterpiece of precision and innovation, crafted for those who seek to understand and harness the unseen forces within the market. Just as Da Vinci observed the natural world with meticulous detail, this MetaTrader 4 (MT4) indicator reveals the hidden structures of price movement, enabling traders to capture the essence of smart money concepts (SMC) and execute flawless breakout strategies. Every eleme
FREE
Highly configurable Osma indicator.
Features: Highly customizable alert functions (at levels, crosses, direction changes via email, push, sound, popup) Multi timeframe ability Color customization (at levels, crosses, direction changes) Linear interpolation and histogram mode options Works on strategy tester in multi timeframe mode (at weekend without ticks also) Adjustable Levels Parameters:
Osma Timeframe: You can set the lower/higher timeframes for Osma. Osma Bar Shift: Y ou can set th
FREE

Download directly the indicator file here. (if you can't open on MT4) MACD Indicator is one of the most popular momentum indicators among users. Searching and detecting MACD signals by the eye may not be easy. Scan Full Charts Dashboard Indicator with simple user interface and search customization panel saves time and scans all charts for MACD signals search and notifies the user with high accuracy. After finding the signal, the user was aware of the result by alerts and notifications. This ind
FREE

When prices breakout resistance levels are combined with Larry Williams' Percent Range oscillator "WPR" breaks out its historical resistance levels then higher chances emerges to record farther prices. It's strongly encouraged to confirm price breakout with oscillator breakout since they have comparable effects to price breaking support and resistance levels; certainly short trades will have the same perception. Concept is based on find swing levels which based on number of bars by each side to
FREE

Enhance your trading and add more excitement with the new version of the RSI Scanner! Automatic Instrument Grouping: The scanner automatically collects all instruments from your Market Watch and organizes them into four categories: Majors, Minors, Exotics, and Others. Customizable Signal Selection: On the settings page, you can choose which instruments you want to scan for signals. Flexible Timeframe Selection: You can also specify the timeframes you wish to monitor for signals. RSI Parameter
FREE

RQL Trend Board – Description RQL Trend Board is a simple but powerful multi-timeframe trend dashboard.
It shows the current market bias across several timeframes at the same time, using an internal trend-classification method. Each timeframe is displayed as a colored box: Green – bullish bias → look for long setups
Yellow – ranging / unclear → no trade zone
Red – bearish bias → look for short setups The indicator gives a clear overall picture of where the
FREE

The indicator is specially designed for the trading utility Trade Shell (included Trade Shell SMC ) to get it working on visual strategy tester.
Backtest your trading ideas and indicators. Run Trade Shell on visual tester and then put this indicator on the chart. After that you will be able to control all functions of the Trade Shell as well as with live using! It does not work live! Use it with visual tester only. It does not require to set any setting on input parameters.
Have a good luck
FREE

This indicator idea comes from Tushar Chande called Qstick.
Technical indicators quantify trend direction and strength in different ways.
One way is to use the difference between close and open for each bar and to sum it up over a period of time.
The formual is:
Qstick (period ) = Average ((close-open ), period )
In this indicator, we can choose how to calculate body by two famous chart types. The first and default indicator settings are based on Heiken Ashi chart, and the second is based
FREE

Traders Dynamic Index (TDI) Signal Input parameters: signal mode: set it to true if you want to plug it into STAT (Signal Tester and Trader) arrow shift: distance between fast EMA line to arrow on chart middle band filter price line filter RSI period RSI price method Volatility period MA period 1 MA period 2 Averaging method You can find the best setting for 4 hour EURUSD on this video
FREE

Trading with the help of the MACD indicator has become even more convenient. Flexible settings will help you choose what you really need in your trading. Use the strategy that you need - the indicator uses 3 strategies. Download the demo right now! I recommend watching my advisor - Night Zen EA Subscribe to my telegram channel, link in my profile contacts - my profile See also my other products on mql5.com - my products Advantages of the indicator: In this indicator, the interpretation of th
FREE

DATE VERSION DESCRIPTION OF CHANGES 1.00 2022-09-06 Initial release The RedeeCash Triangular Arbitrage Opportunities shows the available currency triads and each currency trade position setup as a global variable, in the fomat of AAA/BBB, CCC/AAA, CCC/BBB: AAA/BBB -1|0|1 AAA/BBB, CCC/AAA, CCC/BBB: CCC/AAA -1|0|1 AAA/BBB, CCC/AAA, CCC/BBB: CCC/BBB -1|0|1 where the value is the trade direction of either OP_BUY or OP_SELL. If the trade direction indicates -1, then no trade should occur for that
FREE
The indicator shows the time of formation of the current bar in a percentage ratio.
Indicator Properties color_back1 - background color 1 color_flat1 - color of borders for background 11 color_back2 - background color 2 Alert_Percent - percent value for a sound alert Sound_file - the name of the sound file, the file must be located in the terminal_directory/Sounds and have the .wav extension
FREE

After 7 years I decided to release some of my own indicators and EAs for free.
If you find them useful please Show support with a 5-star rating! Your feedback keeps the free tools coming! See other my free tools as well here
_________________________________ Volume Moving Average (Volume MA) Indicator for Advanced Forex Market Analysis Introducing the Volume Moving Average (Volume MA) Indicator, meticulously developed in MQL4, a pivotal tool for enhancing your forex trading strat
FREE

The indicator is a 15-minute signal indicator for all types of traders. Meaning, you could make lots of profits trading two different signals in one indicator.
NOTE: Both indicators are channels for achieving the same result. RED ARROW -- Sell Signal BLUE ARROW -- Buy Signal
Purchase now to be part of our community. We offer standard chart setups for both novice and intermediate traders. Trade with ease!
FREE

O indicador com alertas do Setup de Larry Williams que conseguiu fazer U$ 10.000 virar U$ 1.100,00 em um campeonato de Trade em 1987 e comprovou fazendo a filha, que é atriz, fazer o mesmo estrago no mercado! A média de 9 para cima é compra, para baixo é venda, simples assim! Com alertas de sons e visual de compra, venda e flat, você se mantendo posicionado até a o alerta inverso a sua posição. Aconselhável usar de H1 para cima.
FREE
The LWO is a tool that effectively indicates the end of trends. Being an oscillator, it has values between 0 and 100, defining the areas of hyper-sold and those of hyper-bought. Its effectiveness is due to the weighing of prices at the end of individual periods on a logarithmic scale; this allows you to have a perception of the will of the market.
The parameters
The indicator has only 2 settable values, period and smooth factor.
The period indicates how many bars the weighing is performed, whi
FREE

The StrikePin indicator is a technical, analytical tool designed to identify trend reversals and find optimal market entries. The StrikePin indicator is based on the pin bar pattern, which is the Price Action reversal pattern.
An entry signal, in a trending market, can offer a very high-probability entry and a good risk to reward scenario.
Be careful: the indicator is repainting since it is looking for highest high and lowest lows. You should avoid to use it in experts but you can use it in
FREE

This indicator helps you to find overbought and oversold prices based on William %R. Input Description: Wperiod: Period for %R indicator. OverBoughtLevel: Define the overbought level for %R. Must in between 0 and -50. OverSoldLevel: Define the oversold level for %R. Must in between -50 and -100. middle_value: When true, indicator also draw the middle points between upper and lower line. shift: Set an additional offset to the indicator.
Several Notes: Set 0 and -100 as Overbought and Oversold lev
FREE

Indicator Description This is a one-of-a-kind indicator. It predicts future bars using the theory of cyclical behavior of prices and certain market stationarity. This indicator will help you predict 1 or more future bars, thus providing a picture of the possible development of the market situation. It is based on 5 prediction methods. The first method is the Fourier transform, while the other ones are represented by different variations of linear prediction methods. You can select which method w
FREE

Having trouble marking where the various forex sessions start and end? Or perhaps your strategy requires you trade only in a specific session, then this is for you.
The session indicator shades the session you require in a certain color so that you can identify it easily. The sessions shown include: London session, New York session, Asian Session, Asian - London overlap and London - New York Overlap.
Difference source give varying time ranges for the various session, mostly differing by not mo
FREE

This indicator is designed for calculating the value of points for the specified lot sizes. The MT5 version is here https://www.mql5.com/en/market/product/29230 Description by lines Line 1 - deposit currency. Line 2 - lot size (10 input parameters) . All further values are calculated into columns below each lot size. Line 3 - calculation of value for one point. Line 4 - calculation of value for spread. All subsequent lines - calculation of value for points (20 input parameters) . All you need t
FREE
The ATR Strategy Multiplier is designed to help traders assess market volatility using the Average True Range (ATR) across multiple timeframes. It calculates and displays ATR values along with recommended Stop Loss (SL) and Take Profit (TP) levels based on the ATR. These levels are essential for setting risk management parameters and optimizing trading strategies.
Parameters: Indicator Parameters : ATR Period : Determines the period over which the ATR is calculated. Timeframe : Select the time
FREE

Necessary for traders: tools and indicators Waves automatically calculate indicators, channel trend trading Perfect trend-wave automatic calculation channel calculation , MT4 Perfect trend-wave automatic calculation channel calculation , MT5 Local Trading copying Easy And Fast Copy , MT4 Easy And Fast Copy , MT5 Local Trading copying For DEMO Easy And Fast Copy , MT4 DEMO Easy And Fast Copy , MT5 DEMO
Strongly recommend trend indicators, automatic calculation of wave standard and MT5 ver
FREE
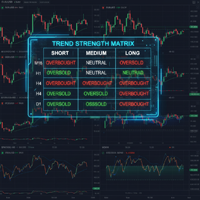
Powered by SVX Strategies Quant Team Tired of switching between charts? Trend Strength Matrix gives you an eagle-eye view of the market. This professional dashboard monitors the Adaptive RSI state across 4 key timeframes (M15, H1, H4, D1) simultaneously. Stop Monitoring, Start Automating
Watching a dashboard all day is exhausting. If you want the execution to be handled automatically by our systems, copy our official algorithms: Copy "Friday Pulse" (Conservative/Stable) Copy "SVX AI Systems" (H
FREE
How To Trade
Execute your trades in 3 Easy Steps!
Step 1: Trade Setup Entry Buy in Signal Arrow color DodgerBlue. Entry Sell in Signal Arrow color RED. Success Rate ≥ 75% 100:25 Step 2: Set Stop Loss Stop loss BUY ----> You can set stop loss on Line RECTANGEL color DodgerBlue. Stop loss SELL ----> You can set stop loss on Line RECTANGEL color RED. Step 3: Set Take Profit Take profit BUY on RECTANGEL color RED. Take profit SELL on RECTANGEL color DodgerBlue. Strategy SIMPLE Day trading / Swing
FREE

This is a powerful indicator that groups multiple Expert Advisors (EAs) by strategy and displays aggregated performance results directly on the chart. Grouping is optional — you can use it even without organizing EAs into groups. It automatically calculates and visualizes performance within a specified aggregation period. You can exclude specific magic numbers or aggregate results across multiple magic numbers as a group. Additionally, by using partial string matching based on EA names, you can

Liquidity Buy Sell Signal Indicator is a no-nonsense, no delay, no repaint indicator ! Liquidity pools together with a trend filter is the most powerful and reliable signal according to me (with the correct parameters depending on the timeframe used) It selects buy/sell entry signals based on liquidity in the market. The time range to scan for liquidity can be set in the parameters. Liquidity is an important aspect in the market, especially for institutional investors, as they need lots of liqu
The MetaTrader Market is a simple and convenient site where developers can sell their trading applications.
We will help you post your product and explain you how to prepare your product description for the Market. All applications on the Market are encryption-protected and can only be run on a buyer's computer. Illegal copying is impossible.
You are missing trading opportunities:
- Free trading apps
- Over 8,000 signals for copying
- Economic news for exploring financial markets
Registration
Log in
If you do not have an account, please register
Allow the use of cookies to log in to the MQL5.com website.
Please enable the necessary setting in your browser, otherwise you will not be able to log in.