适用于MetaTrader 4的技术指标 - 25
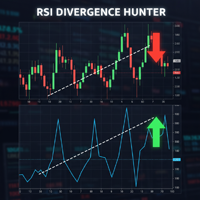
Powered by SVX Strategies Quant Team Divergences are among the most powerful signals in technical analysis, but spotting them in real-time is difficult and subjective. RSI Divergence Hunter automatically scans the market for these discrepancies between price and momentum. Eliminate Subjectivity, Automate Profit
Drawing lines manually leads to errors. If you prefer a fully automated, mathematical approach to trading, copy our official institutional algorithms: Copy "Friday Pulse" (Conservative/S
FREE
Seamlessly switch between 13 (9 mt4 default and 4 popular custom) time frame with this tool. Real ease of switching between default and custom time frames. Note indicator does not create custom time frame chart data, it only enables you to switch to and from them. Creating a custom time frame can be done using the default mt4 period converter script attached to a lesser default mt4 time frame. Example attach period converter on M1 and set period multiplier to 10 to have a custom M10 chart.
FREE

Identification of support and resistance areas
A useful indicator for traders
completely free
Can be used in all symbols
Can be used in all time frames
It has three different trends: short term, medium term, long term
Settings:
Clr1,2: You can change the color of the lines
Type Trend: You can determine the trend
Message me for questions, criticism and suggestions
FREE
Introduction:
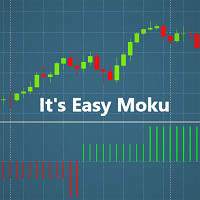
Welcome dear Users, This indicator has been developed in order to help traders who are daily struggling to find a strategy . I have always been acctracted by Ichimoku Strategy, however took me sometime figure out how it does work. Easy Moku makes Ichimoku Simple!
Aspect:
Easy Moku shows 2 principal ICHIMOKU signals: kijun sen/tenken sen sen crossover Span A Span B + Kijun sen/tenken sen Get Rid of all the Ichimoku Lines!
On the Mt4 Chart the Easy Moku paints an Histogram: (
FREE
The LWO is a tool that effectively indicates the end of trends. Being an oscillator, it has values between 0 and 100, defining the areas of hyper-sold and those of hyper-bought. Its effectiveness is due to the weighing of prices at the end of individual periods on a logarithmic scale; this allows you to have a perception of the will of the market.
The parameters
The indicator has only 2 settable values, period and smooth factor.
The period indicates how many bars the weighing is performed, whi
FREE
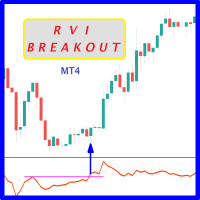
Probability emerges to record higher prices when RVi breaks out oscillator historical resistance level. It's strongly encouraged to confirm price breakout with oscillator breakout since they have comparable effects to price breaking support and resistance levels; surely, short trades will have the same perception. As advantage, a lot of times oscillator breakout precedes price breakout as early alert to upcoming event as illustrated by 6th screenshot. Furthermore; divergence is confirmed in case
FREE
Find Your Trading Direction with Signal Compass Pro ! Tired of guessing your next move? Signal Compass Pro is your answer. This indicator isn't just a tool; it's your personal compass in the financial markets. By combining three powerful momentum indicators— CCI , WPR , and Force Index —we provide confirmed trading signals that are cleaner, more reliable, and less prone to "noise." Key Features & Advantages Confirmed Signals: No more guesswork. This indicator merges the power of three momentum i
FREE

The script tries to determine the overall direction of the market, using smoothed Heiken Ashi candles. The coloring system (using bright and dark colors) is an attempt to detect strong market and weak market conditions. There's also an oscillator within the script
These are the features: Alert condition Features: You can now set alerts in the alert dialog for events like trend switch, trend strengthening and weakening; all for both Bullish and Bearish trend.
I also added the code for custom a
FREE

The indicator is designed for displaying the following price levels on the chart: Previous day's high and low. Previous week's high and low. Previous month's high and low. Each of the level types is customizable. In the indicator settings, you set line style, line color, enable or disable separate levels. The version of the exact same indicator but only with sound alerts there - Time Levels with Alerts .
Configurations ----Day------------------------------------------------- DayLevels - enable/
FREE
Highly configurable RSI indicator. Features: Highly customizable alert functions (at levels, crosses, direction changes via email, push, sound, popup) Multi timeframe ability Color customization (at levels, crosses, direction changes) Linear interpolation and histogram mode options Works on strategy tester in multi timeframe mode (at weekend without ticks also) Adjustable Levels Parameters:
RSI Timeframe: You can set the current or a higher timeframes for RSI. RSI Bar Shift: you can set t
FREE

This scanner is monitoring the entire market for trade opportunities for all symbols and for all time frames. You don't have to look to all the charts, for all symbols and for all time frames. This scanner will alert you on your computer, or on your mobile, when a trade opportunity has been found. You never have to miss a trade opportunity! This indicator is designed to scan all pairs and symbols, for all time frames, to find a cross of the MACD main and signal line. MACD Definition
The
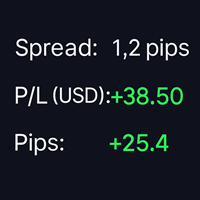
SpreadPipsProfit – Real-Time Spread, P/L & Pip Tracker SpreadPipsProfit is a lightweight, non-intrusive MT4 indicator that displays your key trading metrics in real time — directly on your chart. It’s designed for traders who value clarity, precision, and clean visuals. Key Features Right-Aligned Display Panel – Perfectly positioned in the top-right corner with adaptive spacing and safe edge margins. Live Spread Monitor – Shows the current spread in pips , helping you avoid overpaying on e
FREE
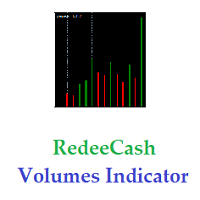
Version History : Date Version Changes 6/20/2022 1.00 Initial release 6/21/2022 1.10 Add global variables for Minimum (SYMBOL_volume_min) and Maximum (SYMBOL_volume_max) History Volumes Description : RedeeCash Volumes Indicator is the Volumes indicator that you have come to trust for market entry and exit with the added benefit of exposing key metrics as global variables. Including global variables in an indicator permits easier interaction with expert advisors (EA) and scripts. When attaching
FREE
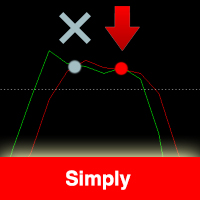
The indicator is based on the Stochastic indicator. I also recommend to see my EA Night Zen Strategy: It contains a strategy for crossing the K and D lines in the overbought (for sales) and oversold (for purchases) zones. The indicator gives a signal at the second intersection.
The signals are not rewritten, they appear after confirming the intersection of the K and D lines.
Settings: Stochastic Indicator Settings Indicator period Notification and Alert Settings
FREE

Current indicator shows the trading sessions for the major financial centres: London New York Tokyo Sydney There are available two types of displaying zones: in sub window below the chart and on the chart. When the subwindow is selected, the sessions are shown in the form of bars. If the sessions are shown on the main chart, they are displayed in the form of lines at the open price of the session that may also act as a support and resistance for further price action during the trading day. The
FREE

Double Exponential Moving Average (DEMA) is a well-known trend indicator. DEMA was developed by Patrick Mulloy and published in February 1994 in the "Technical Analysis of Stocks & Commodities" magazine. It is used for smoothing price series and is applied directly on a price chart of a financial security. Besides, it can be used for smoothing values of other indicators. The advantage of this indicator is that it eliminates false signals at the saw-toothed price movement and allows saving a posi
FREE

Unlock Smarter Trading with Triple Candle Trend! Stop chasing signals and start trading with confidence and confluence . The Triple Candle Trend indicator is your all-in-one system designed to cut through market noise and deliver high-probability entry points. We don't rely on a single factor; we combine the power of three confirming tools into one clear signal! Why You Need This Indicator: Filter Out Noise, Find the Trend: This system uses the mighty EMA 200 as a foundational trend filter. If
FREE

What is G Force Trend? G Force Trend is a technical analysis indicator developed for the MetaTrader 4 platform. It analyzes price movements to identify trend direction and generates buy/sell signals. The indicator creates a dynamic channel to track price behavior within the channel and visualizes trend changes. What Does It Do? Trend Detection : Determines whether the price is in a bullish or bearish trend. Buy/Sell Signals : Generates clear buy and sell signals when the price crosses the channe
FREE
** All Symbols x All Timeframes scan just by pressing scanner button ** *** Contact me to send you instruction and add you in "RSI scanner group" for sharing or seeing experiences with other users.
Introduction RSI divergence is a main technique used to determine trend reversing when it’s time to sell or buy because prices are likely to drop or pick in the charts. The RSI Divergence indicator can help you locate the top and bottom of the market. This indicator finds Regular divergence for pul
The indicator can be used with any time frame and forex pair. One easy to use parameter in the indicator will allow you to adapt the signals to any forex pair and time frame you want to trade.
The Arrows DO NOT REPAINT !
Information Panel: We've equipped this indicator with a user-friendly Panel. one side of the panel, the time frame is displayed, while on the other side, the currency pair is shown. Below that, the direction of the trend is identified, showing whether it is an uptrend or a d

This tools is design to easily forecast the projection of the current trend through the inputs of Zigzag and get out of the market when the trend do not the ability to maintain it's volatility to go further... the indicator gets the initial and final price from the value of zigzag automatically by adjusting the intdepth of zigzag. You can also switch from Projection to Extension from the inputs tab of indicator.
FREE

Индикатор рисует уровни Фибоначчи с выделенными Ценовыми метками.При установке индикатора на график необходимо создать трендовую линию с именем указанным в поле" Unique name of trend line to place fib on ". По умолчанию имя=" Unique name of trend line to place fib on" = "+" .В индикаторе можно заменить уровни фибоначчи по своему усмотрению.Также меняются цвет,стиль,толщина линий и т. д.
FREE

A simple information indicator showing the time left before the opening of the next candlestick or bar.
About the concept of a timeframe A timeframe is the time interval considered in the technical analysis of free financial markets (the same applies to the global currency market), during which the price and other market data change. The smallest timeframe is the so-called tick. A timeframe is the time interval used to group quotes when drawing elements of a price chart (bars, Japanese candlest
FREE
Индикатор Free Pro Level предназначен для автоматического построения уровней поддержки и сопротивления. Преимущества индикатора: подходит как для опытных трейдеров, так и для новичков; простота в использовании; уровни не перерисовываются; вероятность реакции цены при касании уровня более 80%; бесплатный. Индикатор Free Pro Level имеет всего 5 пунктов входных параметров: Минимальная длина свечи в пунктах по 5 знаку - основной параметр, на основании которого происходит анализ и поиск уровней по
FREE
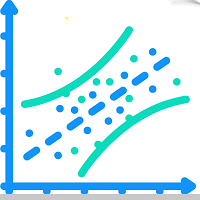
1. Indicator Purpose and Inputs Overview The Linear Regression Forecaster is an advanced analytical indicator designed to perform comprehensive trend evaluation and short-term price forecasting using the Linear Regression (LR) statistical method.
It is optimized for the Weekly (W1) timeframe and combines both long-term trend analysis and short-term rolling trend dynamics to generate reliable weekly forecasts. The indicator operates using two distinct timeframes : Long-Term Period (e.g., 52 weeks
FREE

指标适用于趋势跟随者! 三条均线构建的交易系统.顺势交易,让利润奔 跑. 交易实用必备工具指标 波浪自动计算指标,通道趋势交易 完美的趋势-波浪自动计算通道计算 , MT4版本 完美的趋势-波浪自动计算通道计算 , MT5版本 本地跟单复制交易 Easy And Fast Copy , MT4版本 Easy And Fast Copy , MT5版本 本地跟单复制交易 模拟试用 Easy And Fast Copy , MT4 模拟账号运行 Easy And Fast Copy , MT5 模拟账号运行 强烈推荐趋势指标, 波浪的标准自动计算 和 波浪的标准自动计算MT5版本 升级版蜡烛图颜色可变 合作QQ:556024" 合作wechat:556024" 合作email:556024@qq.com" 专业EA指标定制编写. 首先,我们要明白,所有的移动均线都是滞后指标,它们只能事后告诉你市场已经转向,即使它们提供了有价值的信息并且帮助你建立了头寸,不能协助在利润最大化方面发挥太多作用,所以要配合均线价值回归区域使用,价格可以根据重要支撑线的指示,不是滞后的,当市场从目前的隧道
FREE

This scanner is monitoring the entire market for Ichimoku trade opportunities for all symbols and for all time frames. You don't have to look to all the charts, for all symbols and for all time frames. This scanner will alert you on your computer, or on your mobile, when a trade opportunity has been found. You never have to miss a trade opportunity! This indicator is designed to scan all pairs and symbols, for all selected time frames, to find a Tenkan and Kijun Cross or a breakout of the Ich

Graphic Shapes -using history, it projects four types of graphical shapes at the moment, allowing you to determine the main ranges of price movement in the future, as well as gives an understanding of the main market reversals, while giving entry points by priority!The panel contains three types of figure sizes expressed by timeframes. They allow you to conduct a complete market analysis without using additional tools! The indicator is a powerful tool for forecasting price movements in the forex
FREE
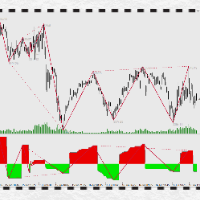
万能背驰指标简介(DivergenceLines) 注意注意,这个指标不能单独运作,对以下两个指标有依赖,请确保先获得以下两个指标后才购买本指标! 1) 动力之梯(PowerTrapezoid) (力度评估副图指标,本指标) 2) 万能分段(LinesSegment) (线段划分主图指标) 。 3)万能背驰(DivergenceLines,本指标) (比较力度背离主图指标)。 指标原理: 通过获取动力之梯指标的筹码堆积值,依照万能分段指标为依据,对同向线段向前回朔,进行一一对比,当后面线段力度比前面力度小时,定义为背驰(背离),背驰的两个高点(或两个低点)之间可以连接一条背驰线,当某个高点(或低点)连接的背驰线越多,这个点就构成了多个单级别背驰区间套。
FREE
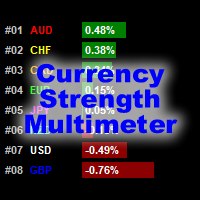
貨幣強度萬用表指示器顯示以下每種貨幣的強度,方向和等級: AUD CAD CHF EUR GBP JPY NZD USD 此外,它還顯示以下每種貨幣對的強度,方向和等級: AUDCAD AUDCHF AUDJPY AUDNZD AUDUSD CADCHF CADJPY CHFJPY EURAUD EURCAD EURCHF EURGBP EURJPY EURNZD EURUSD GBPAUD GBPCAD GBPCHF GBPJPY GBPNZD GBPUSD NZDCAD NZDCHF NZDJPY NZDUSD USDCAD USDCHF USDJPY
該指標適用於任何圖表和任何時間範圍。每個貨幣和貨幣對的強度,方向和排名數據都可以通過指標緩衝區訪問。您可以將指標拖放到圖表上以顯示所有信息,也可以將指標配置為僅顯示其所在特定圖表的貨幣和貨幣對。
數據顯示為貨幣和貨幣對的水平條形圖。它還顯示僅針對貨幣的連續折線圖
指標輸入和默認值如下: BarsLimit = 60-計算中使用的條數。 Hours = 1-計算中使用的小時數。 ShowAllCurrencyPairs = t
FREE

www tradepositive .lat
ALGO Smart Flow Structure Indicator The institutional standard for market structure. Designed for serious SMC (Smart Money Concepts) and Price Action traders, this indicator eliminates the noise of conventional fractals. Forget about repainting signals and ambiguity; get a crystal-clear view of the real market structure , validated by strict algorithmic rules. The Bias Dashboard Make informed decisions by monitoring 3 critical variables across 8 simultaneous timefr
FREE

Range-Bound & Reversal Strategies Dashboard (MT4) Trade clean reversals with confidence.
This MT4 indicator scans 20 major instruments in real time and pinpoints high-probability range and mean-reversion opportunities—then lays everything out in a simple, professional dashboard. Why traders love it 10 Proven Setups in One Tool
Support/Resistance bounce, Bollinger mean reversion, RSI OB/OS, MACD turn, Stochastic OB/OS, CCI extremes, Daily Pivot S/R, Keltner touch, Donchian extremes, and Envelopes
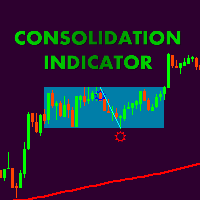
Сonsolidation box indicator with possibility of flexible settings according to the traiders requipments. Also, it is possible to embed indicatior in EA. Thank Alexey Mavrin for realization of technical task. According to the classic technical analysis the price is in motion without a clear direction for almost 70% of the market time and methods of getting profit from flat should be in the arsenal of any trader. Price consolidation- are periods of market equilibrium when supply and demand are app
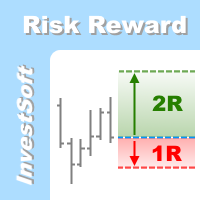
This is the forex visual orders tool & forex position size (lot) calculator with intuitive panel. Risk Reward Ratio Indicator works on all kind of symbols: currency pairs, indices, metals, commodities, cryptocurrencies, etc.
If you want to make sure that Risk Reward Ratio Indicator works on your favorite symbols contact us ( visit our profile ) and ask for 7-day free trial to test this tool without limits. If you want to place orders easier, faster and more intuitive? If you like to mark trad

Indicator (includes Volume Profile + Order Blocks) - a revolutionary indicator that combines two of the most powerful concepts of modern technical analysis: volume profiles and institutional players' order blocks. This tool allows you to see what is hidden from most traders and gives you a significant advantage in the market.
Key benefits of the indicator: Visualization of "smart money": Clearly shows the areas of concentration of large players, highlighting areas with maximum volume in bright
Unlock Smarter Trades with Candle Sync Pro! Are you tired of conflicting signals across different timeframes? Do you wish you had a clearer view of the market's true direction? "Candle Sync Pro" is your essential tool for making more confident and informed trading decisions! This powerful indicator cuts through the noise, allowing you to see the bigger picture by visualizing higher timeframe candles directly on your current chart. No more switching back and forth, no more guesswork – just pure,
FREE

Hermes Trend
專為專業用途設計,採用強大的訊號邏輯和安全的運算方法,消除延遲或錯誤更新。
不會重繪、刪除或修改過去的訊號。
所有訊號均在K線圖上產生並保持不變。
在實際交易中,訊號不會重繪-它會立即顯示在K線圖上。
提供專業級的穩定性、準確性和靈活性。
此系統能夠準確辨識趨勢和動量變化,以及橫盤整理(平台行情),提供高勝率的訊號,同時最大限度地減少噪音和錯誤訊號。
主要功能:
多級過濾系統(模組化,完全可自訂)。
逼真的即時視覺化效果。
直接在圖表上顯示清晰的訊號。
完全針對MT4平台最佳化。
適用於所有貨幣對、指數、股票、外匯和加密貨幣。
趨勢交易、波段交易和反轉確認。
為尋求可靠、清晰的專業交易訊號的交易者而設。
FREE

"Sentiments of traders" in the financial markets is a topic that has been of interest to us for a long time. In time, we could not find the right formula to define these sentiments. We went through many stages in the search for the right methodology - from taking data from external sources to calculate open positions of buyers and sellers to calculating tick volumes, but still we were not satisfied with the results. The calculation of open positions of buyers and sellers from external sources ha

AD Trend line draws trend lines on the basis of A/D indicator (Accumulation/Distribution). When A/D indicator breaks a trend line, the probability of the trend reversal is very high. This is a multitimeframe indicator which can display values from higher timeframes. Parameters Time-frame — Select a timeframe; zero is the current timeframe of the chart; Trend Line — Display lines on the chart; Apply to — Apply lines to close the candle's highest/lowest value; Width line — Width of the line; Style
FREE

This indicator is stand alone version from MP Pivot Levels (All in one) containing Demark's Pivots.
Calculations: PP = X / 4 R1 = X / 2 - LOWprev S1 = X / 2 - HIGHprev Uses: When the pair currency price may change the direction of movement. Possible constraints of support and resistance that creates plateaus for the currency pair prices. Tendency identification by comparing the present prices according to current day's pivot point and also the prior day's pivot points. ____________
FREE
Please read before you purchase : - We don't have buyer's detail when purchase was made. In order to get the bonuses, you need to contact me via product comment ( not product review). That way I will contact you back via mql message asking for email. - Please make sure you enable receiving message from non-friend list, otherwise I cannot message you for email. This indicator is not just about Smart Money Concept, with lots of features which I believe could help you understand the concept. Not on
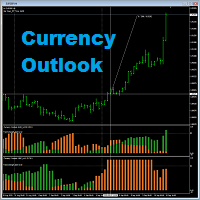
Currency Outlook is an indicator that can help us "Trade the right pair in the right direction and at the right time". This indicator analyzes prices of all cross currency pairs of the selected currency and report the result to us in form of double colours histogram diagram. The maximum height of the histogram diagram of the indicator is 100. The indicator is exclusively programming for AUD, CAD, CHF, EUR, GBP, JPY, NZD and USD. It can work in any timeframe in MT4. A feature for calculating trad

这款智币狙击指标分析系统使用了强大的内部循环调用指标自己的外部指标,然后,再前后周期调用分析。
本指标分析系统的数据计算非常复杂(前后循环周期调用),所以减小了信号的滞后性,而达到提前预测的准确性。
本指标可以用在MT4上的所有周期,最适合15分钟、30分钟、1小时、4小时的周期使用。
做多单:
当出现紫色线,并且紫色线在0轴上方,即可下单做多(买涨单)!
做空单:
当出现绿色线,并且绿色线在0轴下方,即可下单做空(买跌单)!
注意:
如果下单后出现了相反信号,最好的办法是立即平仓止损,并且再反向做单!
因为下单后出现反信号,这个时候持仓单的亏损会很小,所以止损掉也不会有很大损失!
我们下单盈利需要抓大波段,这款指标有很强的抓大波段的能力!而且滞后性非常小!
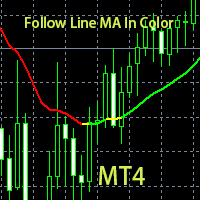
这是基于颜色识别的自定义指标。 当颜色为绿色时做多单。 当颜色为红色时做空单。 当颜色为黄色时表示行情即将反转,最好平仓或空仓。
这是本人经过长时间跟随手工做单,准确率较高,然后编写出来根据线颜色很好标识下单方向的指标,无时间,货币对限制。 当前指标最好在15分钟,30分钟,1小时,4小时上工作,效果较好。 当前指标不建议用在1分钟或5分钟或1day以上时间周期,虽然然指标是无限制的,但是效果不太好。 本指标工作平台最好选择点差比较小的交易商。 由于外汇交易是24小时运行,手工下单的话容易受到个人时间和情绪的影响,如果时间不够多的话,建议选择我基于当前指标编写的另外一个EA来交易。 基于本指标编写的EA:https://www.mql5.com/zh/market/product/37082 本指标编写的EA实盘详情:https://www.mql5.com/zh/signals/557404
FREE

The indicator helps to determine the potential for price movement within the day and on a trend. For calculations, the average price movement on the instrument is used. If you have a problem setting TP, the indicator allows you not to overestimate your expectations. For volatile instruments, the SL position can also be taken into account. If the entry was in the right place, the risk / reward ratio will prompt a profitable level for profit taking. There is a reset button at the bottom of the sc
FREE

Some short but nice algo giving signals and some ideas for stops. Five moving averages are used to find cross overs and create a zone. All periods and methods are adjustable but default values are optimized already. If you have lags on long history you can reduce MaxBars to make it work faster. Please comment if need to explain the parameters. Also any improvement ideas are welcome.
FREE
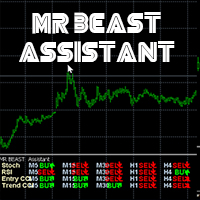
MRBEAST Assistant El indicador MR BEAST Assistant para MetaTrader es un indicador multitemporal que se basa en tres indicadores estándar: el oscilador estocástico, el RSI (Índice de Fuerza Relativa) y el CCI (Commodity Channel Index). Muestra las direcciones de la tendencia actual para los marcos temporales M1, M5, M15, M30, H1, H4, D1, W1 y MN1. Cuando se sigue un indicador de este tipo se tiene una visión clara de las tendencias en todos los marcos temporales importantes. No imp
FREE

This indicator is an addition to "Trend Edges."
The "Trend Edges histogram" indicator determines whether the trend is rising or falling. It is suitable for any time frame (tested on DAX).
Find a trending pair, index or CFD. Additionally :
-Sound alert on trend change.
-Alert Notification
-Alert Notification on your mobile phone Check my other indicators.
FREE
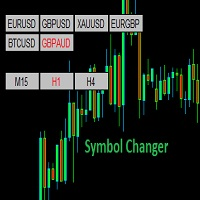
Symbol Changer (Custom) Indicator
This is a simple yet intuitive indicator. And its free.
The indicator provide easy navigation across various symbols and across different time frames all in a chart.
The buttons are displayed on the main chart.
It is flexible and easy to use with fast response speed.
FEATURES
UniqueID : This identifies the pairs for each chart
Use Custom Pairs : If set to true, load all the available symbols in the Market Watch. No means it loads the pairs selected be
FREE

Unleash Your Trading Potential with Momentum Strength Signal! Tired of lagging indicators and confusing market noise? Momentum Strength Signal is the cutting-edge tool built to give you a decisive edge by focusing on what truly drives prices: pure market force . This isn't just another average indicator; it's a dynamic system that identifies the exact moment a trend begins and confirms its validity, helping you enter and exit trades with confidence. Why You Need This Powerhouse Indicator: Preci
FREE

This scanner shows the trend values of the well known indicator SuperTrend for up to 30 instruments and 8 time frames. You can get alerts via MT4, Email and Push-Notification as soon as the direction of the trend changes. This is the FREE version of the indicator: SuperTrend Scanner The free version works only on EURUSD and GBPUSD!
Important Information How you can maximize the potential of the scanner, please read here: www.mql5.com/en/blogs/post/718074
With the following FREE indicator you c
FREE
28 symbols, multi-time frame powerful Dashboard for the full market view Customizable Buy/Sell alerts, push alerts, email alerts, and visual on-screen alerts. Marked buy/sell signals Two color trend histogram. The commodity channel index (CCI) is an oscillator originally introduced by Donald Lambert in 1980. CCI measures current price level relative to an average price level over a given period of time. CCI is high when prices are above the average price, and low when the prices are below the a
FREE

Hello. Another free indicator from Sepehr! ;) You can determine the trend with this tool. Using crosses of two Moving averages, you can say that the trend is going to be bullish or bearish; A fast-moving average and a slow one. When the fast-moving crosses up the slow-moving, it's going to be an uptrend and when it crosses down the slow-moving, it means that you are going to have a downtrend. That's easy ;) Hope to enjoy it Sepehr(Faran)
FREE

Supreme Stoploss is an indicator for metatrader 4 that is based on the ATR indicator , it gives stoploss/takeprofit as lines drawn above and below the price , this indicator does not repaint/back paint and is not delayed. can be used to determine the stop loss or take profit of a trade using ATR value multiplied by the number set by user. ====================================================================================================== Parameters : ATR SL period : ATR period identity : leave
FREE

"Five Minute Drives" indicator that is designed to be used in the 5 minute timeframe. One of its most important advantages is that it shows the general trend in the upper time frames when looking at the 5-minute timeframe. Therefore, when opening positions in the 5 minute timeframe, when it is in line with the trends in the upper timeframes, you are less likely to be upside down. If you can evaluate breakout/breakdown opportunities between the curves on the graphic screen with your geometric per
FREE

Having to check constantly if your Stochastic has reached a specific level can be tedious and draining at times, especially if you have to monitor different asset classes at a time. The Alert Stochastics indicator will assist in this task, ensuring that you get the most with little effort. When the Stochastic values get to a specified level, the alerts will go off, on the chart, on the MT4 phone app or via email (You can receive text messages to your phone if you activate texts on your Gmail acc
FREE

交易实用必备工具指标 波浪自动计算指标,通道趋势交易 完美的趋势-波浪自动计算通道计算 , MT4版本 完美的趋势-波浪自动计算通道计算 , MT5版本 本地跟单复制交易 Easy And Fast Copy , MT4版本 Easy And Fast Copy , MT5版本 本地跟单复制交易 模拟试用 Easy And Fast Copy , MT4 模拟账号运行 Easy And Fast Copy , MT5 模拟账号运行 Fibo: 来源于KTrade 1.自动计算分析波段.->得出所需波段 2.画出斐波那契 回撤线,以及扩展线作为参考 指标波段分析如何得来->请参考如下 波段分析来源于波浪分析指标↓↓↓ 波浪自动计算指标,通道趋势交易 完美的趋势-波浪自动计算通道计算 , MT4版本 完美的趋势-波浪自动计算通道计算 , MT5版本
FREE
What is the Market Sessions Indicator? The Market Sessions Indicator is a technical analysis tool designed for the MetaTrader 4 platform. It visually represents the trading hours of major financial markets (Asia, Europe, USA, and other key sessions) on the chart. By marking each market session with colored rectangles, it helps traders understand which markets are active and their impact on price movements. What Does It Do? Visualizes Market Sessions : Displays key trading sessions such as Asia,
FREE

** All Symbols x All Time frames scan just by pressing scanner button ** *** Contact me to send you instruction and add you in "Divergence group" for sharing or seeing experiences with other users. Introduction MACD divergence is a main technique used to determine trend reversing when it’s time to sell or buy because prices are likely to drop or pick in the charts. The MACD Divergence indicator can help you locate the top and bottom of the market. This indicator finds Regular divergence for pul

The indicator shows entry points with Risk-Reward-Ratio 1 to 5. Main timeframe H1. Works on every pair. The main logic - is to find a reversal level, and then track the price reaction to this level. Doesn't need any settings. As a standard, it paint 5 levels of the same take-profit (red / blue for sellers and buys) and 1 stop-loss level - orange. ATTENTION! Test version of the indicator. Works only on the USDCAD pair! The full version can be bought here https://www.mql5.com/en/market/product/61
FREE

The Supertrend draws a line following the current trend.. Green Line under the candle means a likely bullish trend Red Line above the candle means a likely bearish trend
How to trade with SuperTrend indicator Buy when the Supertrend Green line is below the price, Sell when the Supertrend Red line is above the price. It is strongly suggested to use this indicator in a trending market.
Parameters Multiplier - the lower it is and the more sensitive is the line, meaning it will follow the price mo
FREE

Forex Target Zones Indicator – Master Key Support & Resistance Levels
Unlock the power of precise trading with the Forex Target Zones Indicator, the ultimate tool for identifying high-probability buy and sell zones based on previous weekly and daily highs and lows. Designed for both scalpers and swing traders, this indicator highlights critical levels where price is likely to react, giving you a competitive edge in the forex market.
Key Features: Smart Weekly & Daily Zones – Instantly
FREE

You can see resistance and support levels with the Gann Square 9 calculator. You can adjust the sensitivity setting to suit your needs and the symbol. If you leave the sensitivity at 0, it will work with the default values. I recommend adjusting it to suit your needs and the symbol. Good luck.
I plan to improve the Gann Square 9 indicator and create signals in the next version. If you have any requests, please leave them in the comments. Thank you.
FREE

Market Calculator is a powerful tool that allows you to easily and quickly calculate the main parameters of a trade: Lot size, StopLoss and TakeProfit, as well as estimate the amount of funds (required Margin) to open a position. The program has a very convenient and intuitive control, because implemented in OS Windows style. There are many interesting and handy features - just watch the video: youtu.be/FG2qqTJTIhE All program data are sorted into sections in the form of tabs: " Lot Calculator "

對稱三角形模式儀表板允許您同時監控多個市場和時間範圍內的對稱三角形模式,由此處提供的對稱三角形模式指標繪製: https://www.mql5.com/en/market/product/68709/ 訪問上述指標以了解有關如何形成對稱三角形模式的更多信息,以及如何簡單地遵循交易它們的策略。
儀表板是獨立產品,不需要指示器工作。它僅監視模式並在它們形成時發出警報,因此如果您想實際查看圖表上的模式,您還需要對稱三角形模式指示器。
對稱三角形圖表模式代表價格被迫向上突破或崩盤之前的一段收縮和盤整期。下趨勢線的突破標誌著新的看跌趨勢的開始,而上趨勢線的突破表明新的看漲趨勢的開始。
此儀表板可識別這些模式,並在 4 個關鍵點形成且價格再次回落至三角形時提醒您,以便您為潛在的突破做好準備。儀表板將監控您想要為您不斷交易的所有主要時間框架和工具,並在蠟燭接近時檢查每個工具和時間框架,以便在新模式形成時發出警報。
輸入和配置選項:
模板名稱 - 當您單擊警報時,破折號將為該工具和時間範圍打開一個新圖表,這是它將使用的模板的名稱。 有效信號柱 - 儀表板之前的蠟燭/柱數量將顯示警報。如果模

Trend Graf - это инструмент позволяющий видеть тренд текущего момента,имея стартовые диапозоны которые появляются каждые шесть часов ,способен давать нам уровень предела коррекции как по тренду так и на смену ему.Работает на всех валютных парах!В настройках мы имеем смещение для проекции стартового диапозона от текущей установки ,для каждой валютной пары можно подобрать то смещение, которое лучшим образом будет показывать предел коррекции.Следующее обновление будет включать сигнальные указатели!
FREE
The purpose of this new version of the MT4 standard indicator provided in your platform is to display in a sub-window multiple timeframes of the same indicator. See the example shown in the picture below. But the display isn’t like a simple MTF indicator. This is the real display of the indicator on its timeframe. Here's the options available in the FFx indicator: Select the timeframes to be displayed (M1 to Monthly) Define the width (number of bars) for each timeframe box Alert pop up/sound/ema
FREE
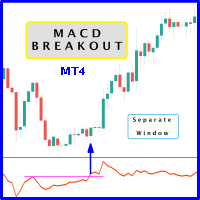
Probability emerges to record higher prices when MACD breaks out oscillator historical resistance level. It's encouraged to confirm price breakout with oscillator breakout since they have comparable effects to price breaking support and resistance levels; certainly, short trades will have the same perception. As advantage, many times oscillator breakout precedes price breakout as early alert to upcoming event as illustrated by second and third screenshot. Furthermore divergence is confirmed in c
FREE

Range Filter - BreakOut EA
What is the Range Filter? The Range Filter is an innovative tool designed to smooth out market noise and highlight meaningful price movements. Rather than focusing on every small fluctuation, the Range Filter eliminates insignificant activity, allowing traders to see trends more clearly. The idea comes from the QQE’s volatility filter, but instead of applying it to RSI, this approach is applied directly to price action. Here’s how it works: A smoothed average of t
FREE

This powerful tool helps you to easily access Fibonacci tools at different times and in different markets. This tool has the ability to send signals based on Fibonacci as well as setting alarms to be aware of broken Fibonacci levels. Among the capabilities of this tool are the following:
Identifies market trends Fibonacci auto design If Fibonacci levels are broken, it sends a message Send Fibonacci signal
Manuals: After selecting the target market, run the tool In the input settings according
FREE
MetaTrader市场是 出售自动交易和技术指标的最好地方。
您只需要以一个有吸引力的设计和良好的描述为MetaTrader平台开发应用程序。我们将为您解释如何在市场发布您的产品将它提供给数以百万计的MetaTrader用户。
您错过了交易机会:
- 免费交易应用程序
- 8,000+信号可供复制
- 探索金融市场的经济新闻
注册
登录