MQL5 Programming Articles
Study the MQL5 language for programming trading strategies in numerous published articles mostly written by you - the community members. The articles are grouped into categories to help you quicker find answers to any questions related to programming: Integration, Tester, Trading Strategies, etc.
Follow our new publications and discuss them on the Forum!
Add a new article

You are missing trading opportunities:
- Free trading apps
- Over 8,000 signals for copying
- Economic news for exploring financial markets
Registration
Log in
You agree to website policy and terms of use
If you do not have an account, please register

The View and Controller components for tables in the MQL5 MVC paradigm: Resizable elements
In the article, we will add the functionality of resizing controls by dragging edges and corners of the element with the mouse.

MQL5 Wizard Techniques you should know (Part 50): Awesome Oscillator
The Awesome Oscillator is another Bill Williams Indicator that is used to measure momentum. It can generate multiple signals, and therefore we review these on a pattern basis, as in prior articles, by capitalizing on the MQL5 wizard classes and assembly.

Developing a Replay System (Part 37): Paving the Path (I)
In this article, we will finally begin to do what we wanted to do much earlier. However, due to the lack of "solid ground", I did not feel confident to present this part publicly. Now I have the basis to do this. I suggest that you focus as much as possible on understanding the content of this article. I mean not simply reading it. I want to emphasize that if you do not understand this article, you can completely give up hope of understanding the content of the following ones.

Developing a Replay System (Part 75): New Chart Trade (II)
In this article, we will talk about the C_ChartFloatingRAD class. This is what makes Chart Trade work. However, the explanation does not end there. We will complete it in the next article, as the content of this article is quite extensive and requires deep understanding. The content presented here is intended solely for educational purposes. Under no circumstances should the application be viewed for any purpose other than to learn and master the concepts presented.

Developing a Replay System (Part 51): Things Get Complicated (III)
In this article, we will look into one of the most difficult issues in the field of MQL5 programming: how to correctly obtain a chart ID, and why objects are sometimes not plotted on the chart. The materials presented here are for didactic purposes only. Under no circumstances should the application be viewed for any purpose other than to learn and master the concepts presented.

Neural Networks in Trading: Integrating Chaos Theory into Time Series Forecasting (Final Part)
We continue to integrate methods proposed by the authors of the Attraos framework into trading models. Let me remind you that this framework uses concepts of chaos theory to solve time series forecasting problems, interpreting them as projections of multidimensional chaotic dynamic systems.

Python-MetaTrader 5 Strategy Tester (Part 05): Multi-Symbols and Timeframes Strategy Tester
This article presents a MetaTrader 5–compatible backtesting workflow that scales across symbols and timeframes. We use HistoryManager to parallelize data collection, synchronize bars and ticks from all timeframes, and run symbol‑isolated OnTick handlers in threads. You will learn how modelling modes affect speed/accuracy, when to rely on terminal data, how to reduce I/O with event‑driven updates, and how to assemble a complete multicurrency trading robot.

Python-MetaTrader 5 Strategy Tester (Part 02): Dealing with Bars, Ticks, and Overloading Built-in Functions in a Simulator
In this article, we introduce functions similar to those provided by the Python-MetaTrader 5 module, providing a simulator with a familiar interface and a custom way of handling bars and ticks internally.

Neural networks made easy (Part 41): Hierarchical models
The article describes hierarchical training models that offer an effective approach to solving complex machine learning problems. Hierarchical models consist of several levels, each of which is responsible for different aspects of the task.

Neural networks made easy (Part 72): Trajectory prediction in noisy environments
The quality of future state predictions plays an important role in the Goal-Conditioned Predictive Coding method, which we discussed in the previous article. In this article I want to introduce you to an algorithm that can significantly improve the prediction quality in stochastic environments, such as financial markets.

Price Action Analysis Toolkit Development (Part 9): External Flow
This article explores a new dimension of analysis using external libraries specifically designed for advanced analytics. These libraries, like pandas, provide powerful tools for processing and interpreting complex data, enabling traders to gain more profound insights into market dynamics. By integrating such technologies, we can bridge the gap between raw data and actionable strategies. Join us as we lay the foundation for this innovative approach and unlock the potential of combining technology with trading expertise.

Neural Networks in Trading: Spatio-Temporal Neural Network (STNN)
In this article we will talk about using space-time transformations to effectively predict upcoming price movement. To improve the numerical prediction accuracy in STNN, a continuous attention mechanism is proposed that allows the model to better consider important aspects of the data.

Neural networks made easy (Part 89): Frequency Enhanced Decomposition Transformer (FEDformer)
All the models we have considered so far analyze the state of the environment as a time sequence. However, the time series can also be represented in the form of frequency features. In this article, I introduce you to an algorithm that uses frequency components of a time sequence to predict future states.

Blood inheritance optimization (BIO)
I present to you my new population optimization algorithm - Blood Inheritance Optimization (BIO), inspired by the human blood group inheritance system. In this algorithm, each solution has its own "blood type" that determines the way it evolves. Just as in nature where a child's blood type is inherited according to specific rules, in BIO new solutions acquire their characteristics through a system of inheritance and mutations.

Category Theory in MQL5 (Part 10): Monoid Groups
This article continues the series on category theory implementation in MQL5. Here we look at monoid-groups as a means normalising monoid sets making them more comparable across a wider span of monoid sets and data types..

Developing a Replay System — Market simulation (Part 19): Necessary adjustments
Here we will prepare the ground so that if we need to add new functions to the code, this will happen smoothly and easily. The current code cannot yet cover or handle some of the things that will be necessary to make meaningful progress. We need everything to be structured in order to enable the implementation of certain things with the minimal effort. If we do everything correctly, we can get a truly universal system that can very easily adapt to any situation that needs to be handled.

Data Science and ML (Part 35): NumPy in MQL5 – The Art of Making Complex Algorithms with Less Code
NumPy library is powering almost all the machine learning algorithms to the core in Python programming language, In this article we are going to implement a similar module which has a collection of all the complex code to aid us in building sophisticated models and algorithms of any kind.

Developing a Replay System (Part 54): The Birth of the First Module
In this article, we will look at how to put together the first of a number of truly functional modules for use in the replay/simulator system that will also be of general purpose to serve other purposes. We are talking about the mouse module.

Neural Networks in Trading: Market Analysis Using a Pattern Transformer
When we use models to analyze the market situation, we mainly focus on the candlestick. However, it has long been known that candlestick patterns can help in predicting future price movements. In this article, we will get acquainted with a method that allows us to integrate both of these approaches.

Creating a Trading Administrator Panel in MQL5 (Part VI): Multiple Functions Interface (I)
The Trading Administrator's role goes beyond just Telegram communications; they can also engage in various control activities, including order management, position tracking, and interface customization. In this article, we’ll share practical insights on expanding our program to support multiple functionalities in MQL5. This update aims to overcome the current Admin Panel's limitation of focusing primarily on communication, enabling it to handle a broader range of tasks.

Neural networks made easy (Part 62): Using Decision Transformer in hierarchical models
In recent articles, we have seen several options for using the Decision Transformer method. The method allows analyzing not only the current state, but also the trajectory of previous states and actions performed in them. In this article, we will focus on using this method in hierarchical models.

Neural Networks in Trading: Adaptive Detection of Market Anomalies (DADA)
We invite you to get acquainted with the DADA framework, which is an innovative method for detecting anomalies in time series. It helps distinguish random fluctuations from suspicious deviations. Unlike traditional methods, DADA is flexible and adapts to different data. Instead of a fixed compression level, it uses several options and chooses the most appropriate one for each case.

Neural networks made easy (Part 64): ConserWeightive Behavioral Cloning (CWBC) method
As a result of tests performed in previous articles, we came to the conclusion that the optimality of the trained strategy largely depends on the training set used. In this article, we will get acquainted with a fairly simple yet effective method for selecting trajectories to train models.
Neural Networks in Trading: Superpoint Transformer (SPFormer)
In this article, we introduce a method for segmenting 3D objects based on Superpoint Transformer (SPFormer), which eliminates the need for intermediate data aggregation. This speeds up the segmentation process and improves the performance of the model.

Developing a multi-currency Expert Advisor (Part 10): Creating objects from a string
The EA development plan includes several stages with intermediate results being saved in the database. They can only be retrieved from there again as strings or numbers, not objects. So we need a way to recreate the desired objects in the EA from the strings read from the database.

Neural Network in Practice: Pseudoinverse (I)
Today we will begin to consider how to implement the calculation of pseudo-inverse in pure MQL5 language. The code we are going to look at will be much more complex for beginners than I expected, and I'm still figuring out how to explain it in a simple way. So for now, consider this an opportunity to learn some unusual code. Calmly and attentively. Although it is not aimed at efficient or quick application, its goal is to be as didactic as possible.

Category Theory in MQL5 (Part 23): A different look at the Double Exponential Moving Average
In this article we continue with our theme in the last of tackling everyday trading indicators viewed in a ‘new’ light. We are handling horizontal composition of natural transformations for this piece and the best indicator for this, that expands on what we just covered, is the double exponential moving average (DEMA).

Creating a Trading Administrator Panel in MQL5 (Part IX): Code Organization (I)
This discussion delves into the challenges encountered when working with large codebases. We will explore the best practices for code organization in MQL5 and implement a practical approach to enhance the readability and scalability of our Trading Administrator Panel source code. Additionally, we aim to develop reusable code components that can potentially benefit other developers in their algorithm development. Read on and join the conversation.

Population optimization algorithms: Simulated Annealing (SA) algorithm. Part I
The Simulated Annealing algorithm is a metaheuristic inspired by the metal annealing process. In the article, we will conduct a thorough analysis of the algorithm and debunk a number of common beliefs and myths surrounding this widely known optimization method. The second part of the article will consider the custom Simulated Isotropic Annealing (SIA) algorithm.

From Basic to Intermediate: WHILE and DO WHILE Statements
In this article, we will take a practical and very visual look at the first loop statement. Although many beginners feel intimidated when faced with the task of creating loops, knowing how to do it correctly and safely can only come with experience and practice. But who knows, maybe I can reduce your troubles and suffering by showing you the main issues and precautions to take when using loops in your code.

Chaos Game Optimization (CGO)
The article presents a new metaheuristic algorithm, Chaos Game Optimization (CGO), which demonstrates a unique ability to maintain high efficiency when dealing with high-dimensional problems. Unlike most optimization algorithms, CGO not only does not lose, but sometimes even increases performance when scaling a problem, which is its key feature.

Neural Network in Practice: Straight Line Function
In this article, we will take a quick look at some methods to get a function that can represent our data in the database. I will not go into detail about how to use statistics and probability studies to interpret the results. Let's leave that for those who really want to delve into the mathematical side of the matter. Exploring these questions will be critical to understanding what is involved in studying neural networks. Here we will consider this issue quite calmly.

Mastering Log Records (Part 7): How to Show Logs on Chart
Learn how to display logs directly on the MetaTrader chart in an organized way, with frames, titles and automatic scrolling. In this article, we show you how to create a visual log system using MQL5, ideal for monitoring what your robot is doing in real time.

Developing a multi-currency Expert Advisor (Part 11): Automating the optimization (first steps)
To get a good EA, we need to select multiple good sets of parameters of trading strategy instances for it. This can be done manually by running optimization on different symbols and then selecting the best results. But it is better to delegate this work to the program and engage in more productive activities.

Artificial Bee Hive Algorithm (ABHA): Tests and results
In this article, we will continue exploring the Artificial Bee Hive Algorithm (ABHA) by diving into the code and considering the remaining methods. As you might remember, each bee in the model is represented as an individual agent whose behavior depends on internal and external information, as well as motivational state. We will test the algorithm on various functions and summarize the results by presenting them in the rating table.

Neural networks made easy (Part 65): Distance Weighted Supervised Learning (DWSL)
In this article, we will get acquainted with an interesting algorithm that is built at the intersection of supervised and reinforcement learning methods.

Optimizing Trend Strength: Trading in Trend Direction and Strength
This is a specialized trend-following EA that makes both short and long-term analyses, trading decisions, and executions based on the overall trend and its strength. This article will explore in detail an EA that is specifically designed for traders who are patient, disciplined, and focused enough to only execute trades and hold their positions only when trading with strength and in the trend direction without changing their bias frequently, especially against the trend, until take-profit targets are hit.

Comet Tail Algorithm (CTA)
In this article, we will look at the Comet Tail Optimization Algorithm (CTA), which draws inspiration from unique space objects - comets and their impressive tails that form when approaching the Sun. The algorithm is based on the concept of the motion of comets and their tails, and is designed to find optimal solutions in optimization problems.
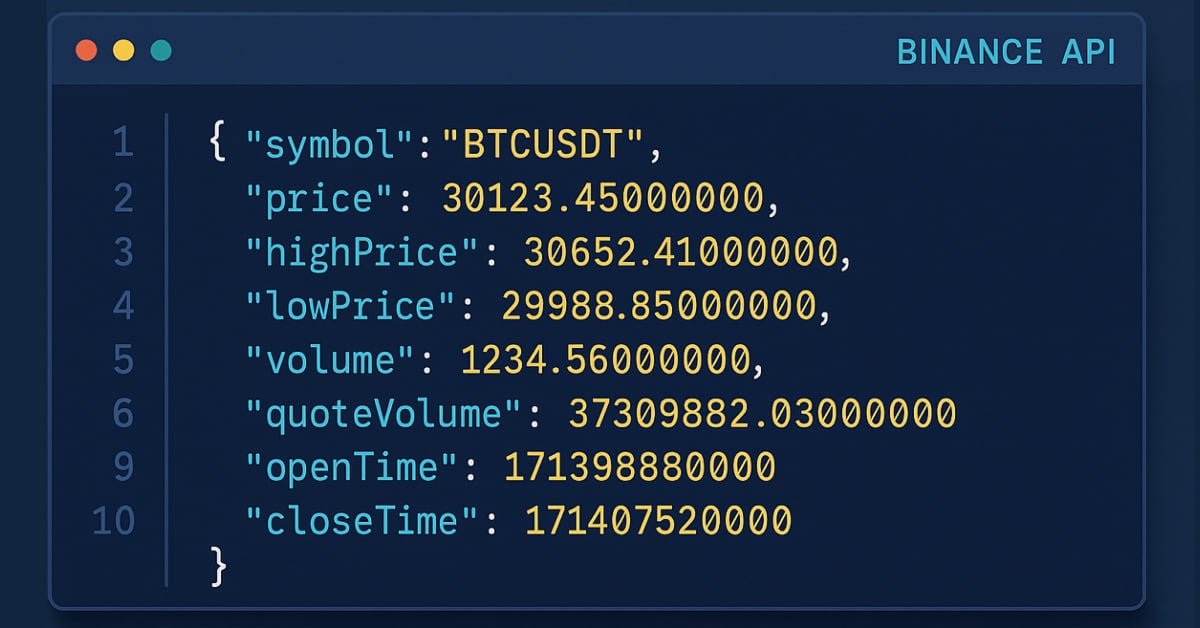
Introduction to MQL5 (Part 31): Mastering API and WebRequest Function in MQL5 (V)
Learn how to use WebRequest and external API calls to retrieve recent candle data, convert each value into a usable type, and save the information neatly in a table format. This step lays the groundwork for building an indicator that visualizes the data in candle format.

Low-Frequency Quantitative Strategies in Metatrader 5: (Part 1) Setting Up An OLAP-Friendly Data Store
The article outlines a practical data pipeline for quantitative analysis based on Parquet storage, Hive-style partitions, and DuckDB. It details migrating selected SQLite tables to Parquet, structuring market data by source, symbol, timeframe, and date, and querying it with SQL window functions. A Golden Cross example illustrates cross‑symbol evaluation of forward returns. Accompanying Python scripts handle data download, conversion, and execution.