
MQL5 Wizard Techniques you should know (Part 65): Using Patterns of FrAMA and the Force Index
Introduction
We continue our series, where we had last looked at the DeMarker and Envelopes channels, by considering the pairing of the Fractal Adaptive Moving Average (FrAMA) and the Force Index Oscillator. FrAMA being a moving average is a trend signalling indicator while the Force Index provides a check on volume to see if the trend has sustenance. We will consider the typical 10 patterns that can be generated from combining these two indicators, as we have in past articles. We are training or optimizing with EUR USD on the 4-hour time frame for the year 2023. Forward walks or testing are done with this symbol for the year 2024.
FrAMA and Force Index Divergence
Our first pattern comes from the divergence between FrAMA and the Force Index. A bullish signal is when FrAMA shows a downtrend with either price making lower lows or extending its drift below the FrAMA while the Force Index forms higher lows, which implies weakening selling pressure. This simple pattern, even within the relatively confined definition, can still be implemented a variety of ways. We choose to implement it by looking for price declines below FrAMA while Force Index rises above its previous low while staying sub-zero.
The bearish signal is when an uptrend from FrAMA as affirmed when price making higher highs is on display together with the Force Index forming lower highs, a sign of weakening buying pressure. We implement both bullish and bearish patterns as follows in MQL5:
//+------------------------------------------------------------------+
//| Check for Pattern 0.                                             |
//+------------------------------------------------------------------+
bool CSignalFRM_FRC::IsPattern_0(ENUM_POSITION_TYPE T)
{  if(T == POSITION_TYPE_BUY && Close(X()) < FRM(X()) && Close(X() + 1) >  FRM(X() + 1) && 0.0 > FRC(X()) && FRC(X()) > FRC(X() + 1))
   {  return(true);
   }
   else if(T == POSITION_TYPE_SELL && Close(X()) > FRM(X()) && Close(X() + 1) <  FRM(X() + 1) && 0.0 < FRC(X()) && FRC(X()) < FRC(X() + 1))
   {  return(true);
   }
   return(false);
}
This pattern spots potential trend reversals by comparing FrAMA’s trend direction with the Force Index’s momentum. Often a strong bullish/ bearish divergence signals weakening trends, which makes the key entry thesis. This pattern therefore brings together adaptability with volume-weighted momentum.
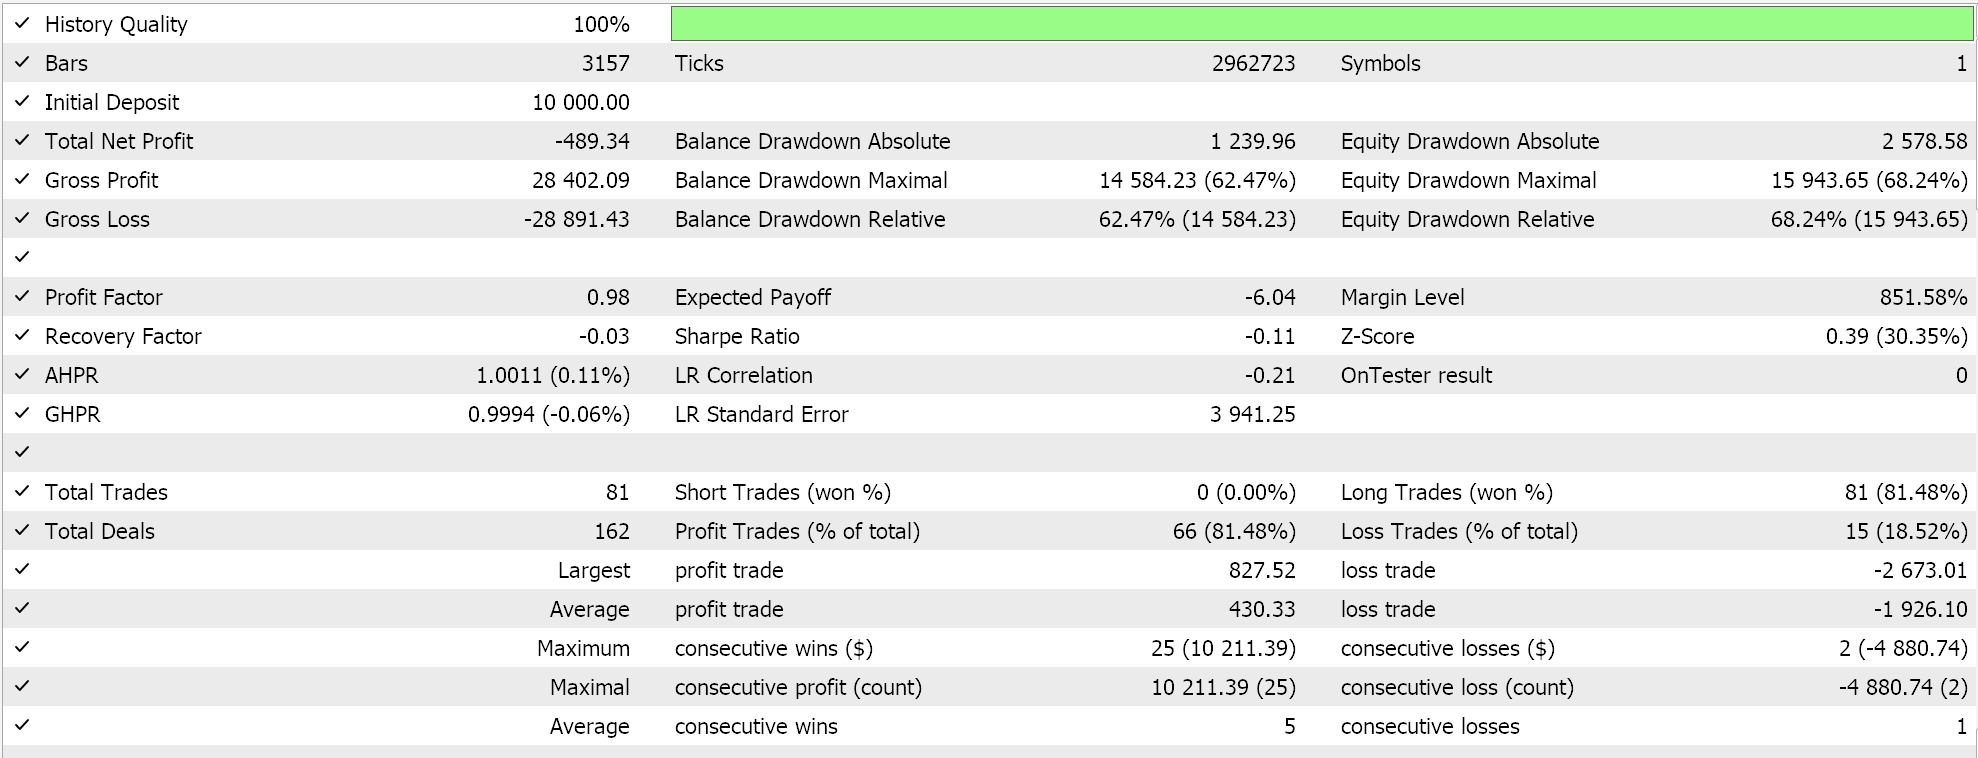
FrAMA adjusts its smoothing period based on fractal geometry, which makes it highly responsive to changes in price while filtering noise. The Force Index on the other hand measures the strength of a price move by multiplying the price change by volume, which serves as a proxy for buying/selling pressure. A bullish/bearish divergence will occur, FrAMA shows a downtrend but Force index forms higher lows indicating weakness in current long trend. The bearish divergence, taking on the opposite of this. Pattern is inherently meant to capture swing or inflexion points in the market. Test results after training/ optimization are presented below, and this pattern does not forward walk over the designated period of 1-year, 2024;
FrAMA Crossover with Force Index Confirmation
Our pattern-1 is based on the FrAMA crossover and a confirmation from the Force Index. The bullish signal is when price crosses above FrAMA or a fast FrAMA crosses above a slow FrAMA. When this is happening, the Force Index would also cross its zero line. A bearish signal is thus when price crosses FrAMA from above to go below it, while the Force Index also turns negative by crossing its zero line to close below it. We implement this as follows in MQL5:
//+------------------------------------------------------------------+
//| Check for Pattern 1.                                             |
//+------------------------------------------------------------------+
bool CSignalFRM_FRC::IsPattern_1(ENUM_POSITION_TYPE T)
{  if(T == POSITION_TYPE_BUY && Close(X()) > FRM(X()) && Close(X() + 1) <  FRM(X() + 1) && 0.0 > FRC(X() + 1) && FRC(X()) > 0.0)
   {  return(true);
   }
   else if(T == POSITION_TYPE_SELL && Close(X()) < FRM(X()) && Close(X() + 1) >  FRM(X() + 1) && 0.0 < FRC(X() + 1) && FRC(X()) < 0.0)
   {  return(true);
   }
   return(false);
}
This pattern relies on two crossovers. One for signal trend changes, that being FrAMA and the other being for volume backed momentum by the Force Index. This helps reduce on false signals in choppy markets. The FrAMA crossover can also be implemented by using a fast and slow FrAMA where signals are read from the crossing of the faster FrAMA instead of price. Periods of 14 and 50 can be considered, for instance. The Force Index then plays a secondary role of validation by confirming if the trend changes are backed by volume.
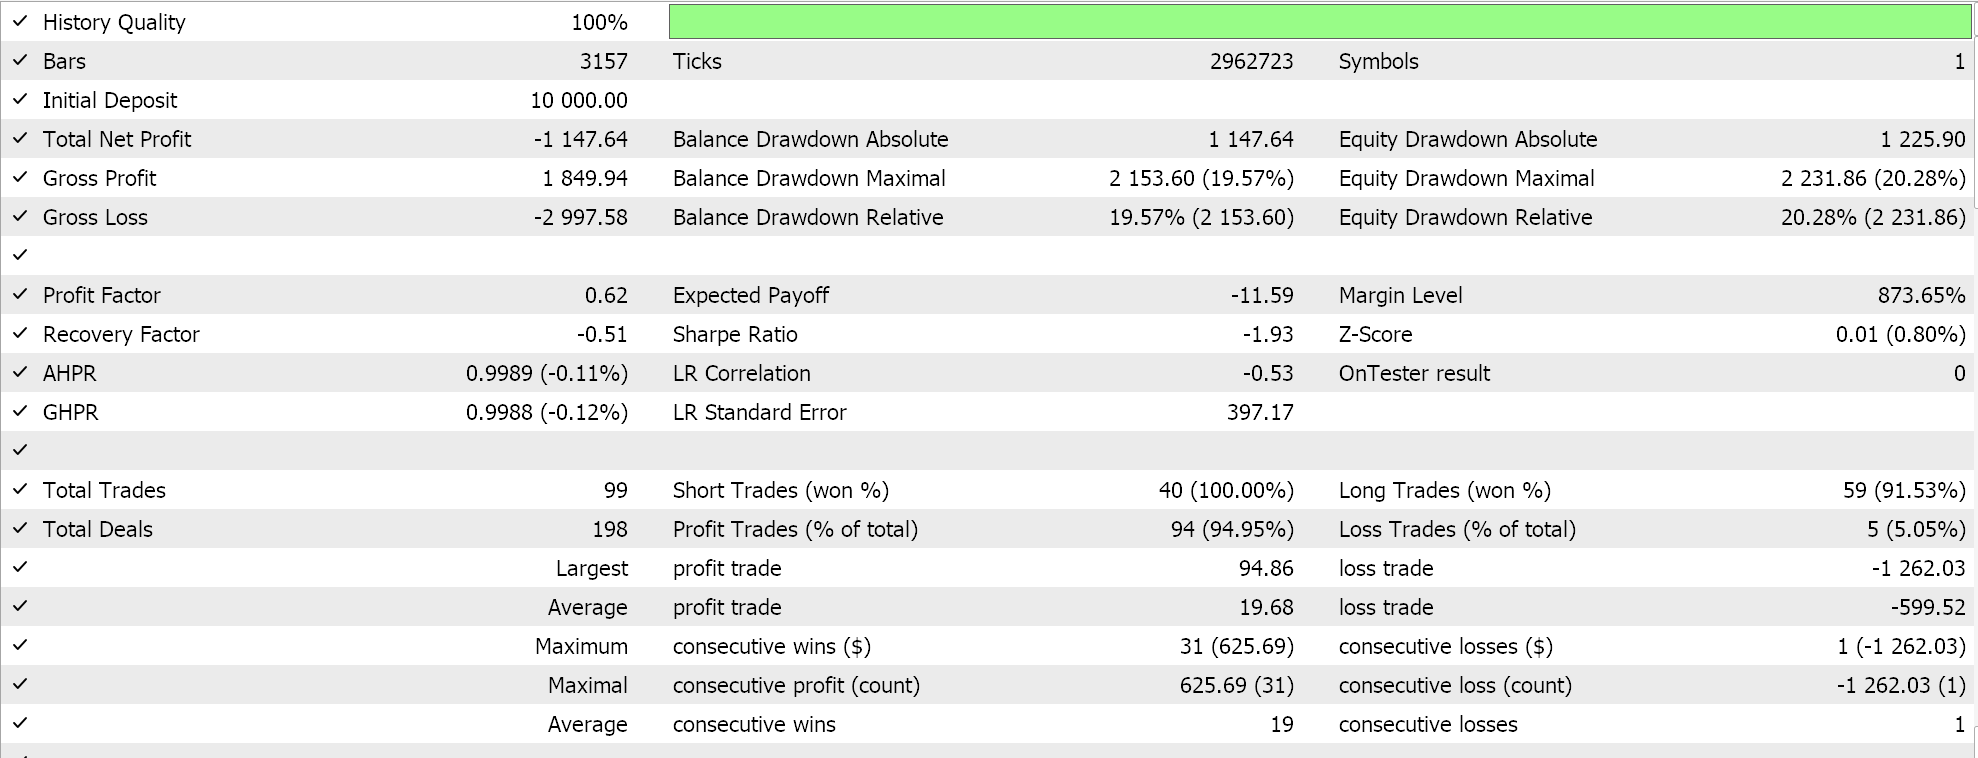
This pattern is effective in trending markets, as FrAMA’s adaptability sees to it that trends are detected in a ‘timely’ manner while the Force Index filters out low-volume breakouts. When implementing this, it is a good idea to set FrAMA periods in the 12-50 range in order to capture medium-term trends. The requirement for the Force Index to cross its zero line can also be substituted by having it cross its moving average if this buffer of information is available. This pattern should not be used to trade in consolidation phases of the market, as FrAMA crossovers are known to whipsaw a lot. Key to having suitable results could be to back test for a suitable FrAMA and Force Index periods, which is something we have not done as we have used the number 14 for both. Our strategy-tester tests that cover the training and testing period are presented below. This pattern also does not forward walk:
FrAMA Trend Direction, with Force Index Overbought/Oversold
Our pattern-2 uses FrAMA trend direction together with Force Index readings for overbought or oversold. The bullish signal is price above FrAMA marking a long trend plus the Force Index reaching an oversold level followed by retracement. This Force Index pullback is taken as a buying opportunity. Conversely, the bearish signal is when price is below FrAMA, and the Force Index reaches an overbought level and then starts falling, signalling a pullback. We implement this in MQL5 as follows:
//+------------------------------------------------------------------+
//| Check for Pattern 2.                                             |
//+------------------------------------------------------------------+
bool CSignalFRM_FRC::IsPattern_2(ENUM_POSITION_TYPE T)
{  if(T == POSITION_TYPE_BUY && Close(X()) > FRM(X())  && 0.0 >= FRC(X()) && FRC(X()) > FRC(X() + 1))
   {  return(true);
   }
   else if(T == POSITION_TYPE_SELL && Close(X()) < FRM(X())  && 0.0 <= FRC(X()) && FRC(X()) < FRC(X() + 1))
   {  return(true);
   }
   return(false);
}
This signal pattern brings together FrAMA’s trend confirmation and Force Index’s extreme levels to spot pullbacks and reversals. It's ideal for trading mean-reversion strategies within trends. Volume spikes at overbought/ oversold do enhance this signal’s reliability. This pattern does leverage FrAMA’s trend clarity and the Force Index’s volume-weighted extremes. Adjustments to the Force Index thresholds can be done based on the asset volatility. For our purposes we have not used an absolute threshold value for overbought/ oversold as these values tend to value with the price units of the assets. Instead, we are using the Force Index patterns to gauge hitting the thresholds. Therefore, confirmation with price pullbacks from key support levels or with candle stick patterns can go a long way in sharpening this particular signal.
It can be used with shorter time frames like the 1-hour for intraday trading, while also aligning with higher timeframes. It should not be used in trading against strong trends unless the Force Index is indicating extreme divergence. This pattern also does not forward walk. Its testing report is given below;

FrAMA Slope with Force Index Smoothing
Pattern-3 uses FrAMA slope and force Index smoothing such that the bullish signal is FrAMA with a positive slope at a steep angle and the Force Index also spikes steeply in positive territory. On the other side, the bearish signal is FrAMA with a negative steep slope and the smoothed Force Index is negative and declining. We implement this in MQL5 as follows:
//+------------------------------------------------------------------+
//| Check for Pattern 3.                                             |
//+------------------------------------------------------------------+
bool CSignalFRM_FRC::IsPattern_3(ENUM_POSITION_TYPE T)
{  if(T == POSITION_TYPE_BUY && FRM(X()) - FRM(X() + 1) > FRM(X() + 1) - FRM(X() + 2) && FRM(X() + 1) - FRM(X() + 2) > 0.0 && FRC(X()) - FRC(X() + 1) > FRC(X() + 1) - FRC(X() + 2) && FRC(X() + 1) - FRC(X() + 2) > 0.0)
   {  return(true);
   }
   else if(T == POSITION_TYPE_BUY && FRM(X()) - FRM(X() + 1) < FRM(X() + 1) - FRM(X() + 2) && FRM(X() + 1) - FRM(X() + 2) < 0.0 && FRC(X()) - FRC(X() + 1) < FRC(X() + 1) - FRC(X() + 2) && FRC(X() + 1) - FRC(X() + 2) < 0.0)
   {  return(true);
   }
   return(false);
}
We are not reading a secondary smoothed buffer, but rather we are looking at the changes in the Force Index. But tracking the magnitude of these changes and looking to increases in these changes, we are simulating a smoothed Force Index. This pattern is meant to measure FrAMA’s slope to gauge trend strength when paired with smoothed Force, and it tends to be effective in trending markets with consistent volume.
In alternative implementations, that look into the FrAMA angle; the slope can be worked out as a rate of change. A higher rate of change would mean a steeper angle, while a slower change rate would mean a less steep angle. We are therefore using FrAMA rate of change as well as a proxy for uptick in slope of the angle. The used smooth Force Index also filters out short-term noise and highlights price action with sustained momentum. So, bringing these two together, a steep FrAMA slope with a rising smooth Force Index should confirm a strong bullish trend, while a declining slope with a falling Force Index should point to significant bearish momentum. This pair of indicators in this pattern is robust for swing trading since it focuses on sustained trends. This pattern also does not forward walk, its report is presented below:

When implementing, calculation of FrAMA slope can be meddled in if rate of change is not considered sensitive enough. Using a period of between 13 and 21 when using the rate of change approach could provide more balance between responsiveness and noise reduction. Entry into the trades should be when both indicators align, i.e. both positive sloping or both negative sloping. Exiting can be inferred to be when FrAMA slope flattens of Force Index reverses, marking trend exhaustion.
FrAMA Breakout with Force Index Volume Surge
Pattern-4 uses the FrAMA breakout and a spike in the Force Index. The bullish signal is when price breaks decisively above FrAMA typically by more than 1 percent. While this is registered, the Force Index would also show a sharp positive spike of about twice the average Force Index value to mark strong buying volume. On the flip, the bearish signal is when price breaks clearly below FrAMA by a decent percentage and also the Force Index shows a sharp negative spike of, again, 2x which marks strong selling volume. We implement this as follows in MQL5:
//+------------------------------------------------------------------+
//| Check for Pattern 4.                                             |
//+------------------------------------------------------------------+
bool CSignalFRM_FRC::IsPattern_4(ENUM_POSITION_TYPE T)
{  if(T == POSITION_TYPE_BUY && Close(X()) > FRM(X()) && Close(X() + 1) <  FRM(X() + 1) && Close(X()) - Close(X() + 1) >= High(X() + 1) - Low(X() + 1) && FRC(X()) >= 2.0 * FRC(X() + 1) && FRC(X() + 1) > 0.0)
   {  return(true);
   }
   else if(T == POSITION_TYPE_SELL && Close(X()) < FRM(X()) && Close(X() + 1) >  FRM(X() + 1) && Close(X()) - Close(X() + 1) <= High(X() + 1) - Low(X() + 1) && FRC(X()) <= 2.0 * FRC(X() + 1) && FRC(X() + 1) < 0.0)
   {  return(true);
   }
   return(false);
}
This pattern detects breakouts when price moves sharply above or below FrAMA and the Force Index confirms this breakout with a volume surge. It tends to be a high-probability setup in volatile markets. The FrAMA breakout does signal a new trend, with the Force Index acting as a filter for confirmation. The indicator pairing in this pattern is ideal for volatile assets such as crypto or small-cap stocks, where volume spikes precede sustained moves. FrAMA’s adaptability ensures timely breakout detection, while the Force Index filters out false breakouts.
This pattern requires a minimum Force Index spike of double the average or prior value. Extra confirmation of breakouts with chart patterns like triangles or flags when at key price levels can be supplemented. Using stop losses below or above the FrAMA can also mitigate risk. Monitoring of volume trends to avoid fading breakouts in low-liquidity markets. This pattern tested as follows and sadly, like most patterns with this indicator pair at the 14 indicator period, it did not forward walk:

FrAMA Support/Resistance with Force Index Reversal
Our pattern-5 uses the FrAMA as a support/ resistance with Force Index reversal. The bullish signal is price bounces off FrAMA as a dynamic support. With this, price would approach or touch FrAMA from above and then bounce off. When this is happening, the Force Index does cross above its zero line or in an alternate implementation its 5/13 period EMA. This signals a rise in bullish volume.
On the other side, a bearish signal is when price rejects FrAMA as a dynamic resistance, where price touches or approaches FrAMA in a downtrend. The Force would cross below its zero line or its EMA to mark a rise in bearish volume. We implement this in MQL5 as follows:
//+------------------------------------------------------------------+
//| Check for Pattern 5.                                             |
//+------------------------------------------------------------------+
bool CSignalFRM_FRC::IsPattern_5(ENUM_POSITION_TYPE T)
{  if(T == POSITION_TYPE_BUY && Close(X()) >= FRM(X()) && Close(X() + 1) <=  FRM(X() + 1) && Close(X() + 2) >=  FRM(X() + 2) && FRC(X()) > 0.0 && FRC(X() + 1) < 0.0)
   {  return(true);
   }
   else if(T == POSITION_TYPE_SELL && Close(X()) <= FRM(X()) && Close(X() + 1) >=  FRM(X() + 1) && Close(X() + 2) <=  FRM(X() + 2) && FRC(X()) < 0.0 && FRC(X() + 1) > 0.0)
   {  return(true);
   }
   return(false);
}
This pattern combines trend context with momentum shifts and works well in range-bound and trending markets. FrAMA serves as a dynamic support and resistance where price bounces or gets rejected and the Force Index signals reversals. This pairing can be versatile as FrAMA adapts to market conditions, and Force Index provides precise timing.
Testing of this pattern on historical data for FrAMA’s reliability as support/ resistance is something that needs to be established. If faster Force Index conformations are desired, then the implementation that uses Force EMA maybe considered instead of our approach above. This pattern can also be combined with macro static support/ resistance zones for higher confluence. Trading should be avoided during low volume periods as Force Index may lag. This pattern also does not forward walk when trained on just the year 2023 and tested on the year 2024. Its test report across both periods is given below:

FrAMA Trend Continuation with Force Index Pullback
Our seventh pattern, pattern-6 is based on FrAMA trend continuation with Force Index pullbacks. The bullish signal is when price remains above FrAMA, confirming the bullish trend and the Force Index dips towards the zero bound, maybe going slightly negative, but then recovers from this bound to become positive. The Force Index action being tied down to renewed buying pressure.
The bearish signal, on the flip, is when price remains below the FrAMA confirming a bearish setup. To confirm this, the Force Index rises towards to zero from below zero, maybe pokes above it, then reverts to below zero. This, like with the bullish also marks renewed selling pressure. So, in essence, pattern-6 identifies trend continuation opportunities during pullbacks. FrAMA defines the trend and Force checks for volume recovery. This pattern, on paper, should have a high reward-to-risk ratio in strong trends. We implement it in MQL5 as follows:
//+------------------------------------------------------------------+
//| Check for Pattern 6.                                             |
//+------------------------------------------------------------------+
bool CSignalFRM_FRC::IsPattern_6(ENUM_POSITION_TYPE T)
{  if(T == POSITION_TYPE_BUY && Close(X()) > FRM(X()) && Close(X() + 1) >  FRM(X() + 1) && Close(X() + 2) >  FRM(X() + 2) && FRC(X()) > 0.0 && FRC(X() + 1) <= 0.0 && FRC(X() + 2) >= 0.0)
   {  return(true);
   }
   else if(T == POSITION_TYPE_SELL && Close(X()) < FRM(X()) && Close(X() + 1) <  FRM(X() + 1) && Close(X() + 2) <  FRM(X() + 2) && FRC(X()) < 0.0 && FRC(X() + 1) >= 0.0 && FRC(X() + 2) <= 0.0)
   {  return(true);
   }
   return(false);
}
This pattern is also ideal for entering trends after correction since FrAMA ensures trend persistence and the Force Index confirms the volume. When in use, it is important to wait for the Force Index to recover about the zero bound before any decisions are made, since the trend tends to be persistent. Fibonacci retracement levels can be used to supplement this pattern, where the pullbacks are aligned to the retracement zones. Stop-losses can be set to recent swing extremes or with the FrAMA as a guide.
This pattern should not be used in choppy markets, as pullbacks are more likely to be false signals. This pattern is one of only two that are able to forward walk over a year, having been trained on just 1 year prior. Its report is given below:
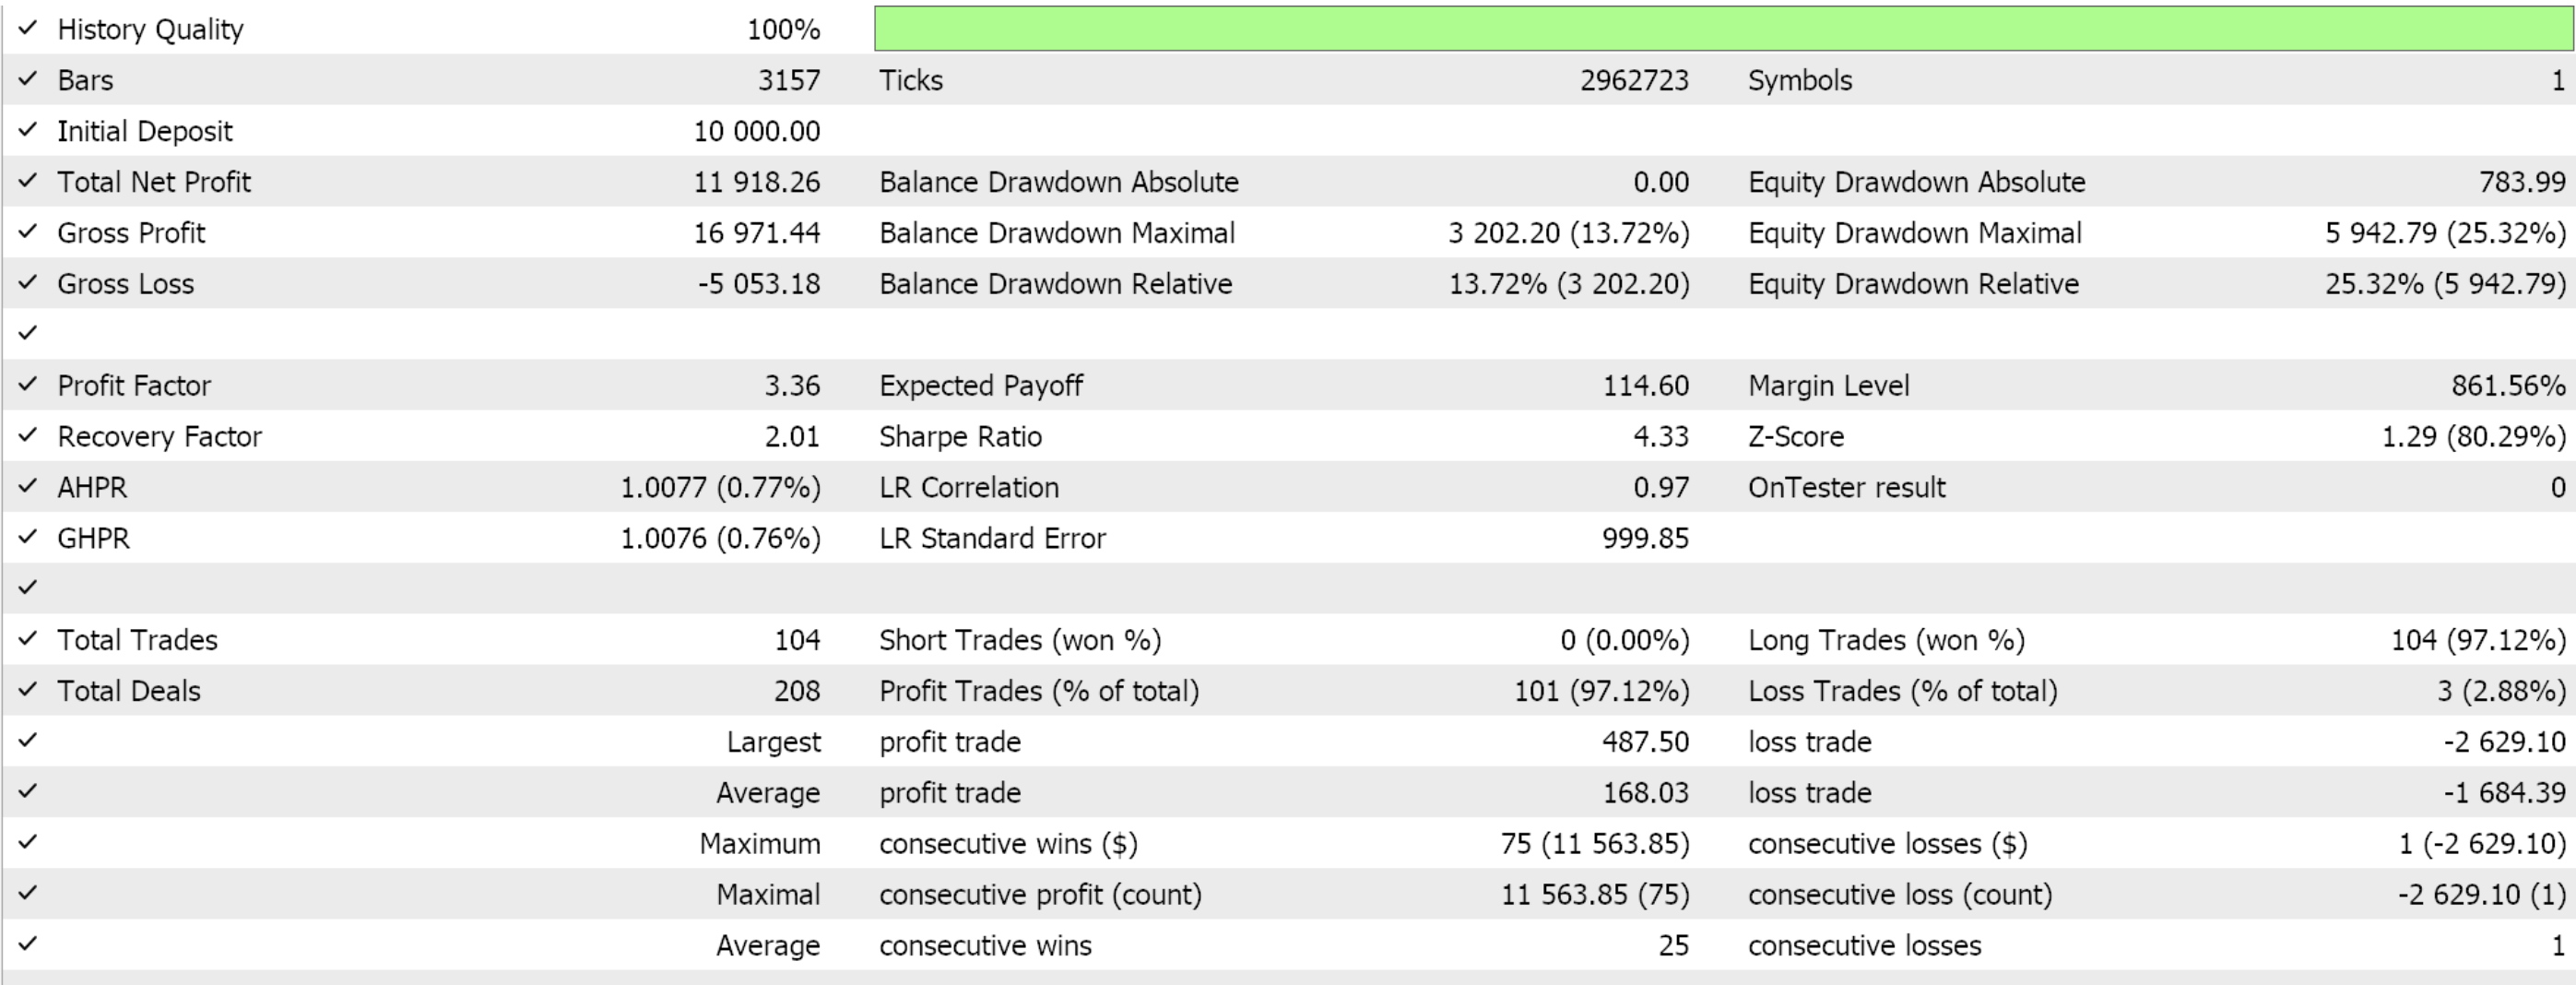
All testing or training was over just one year, which strictly speaking is not sufficient for drawing long-term conclusions. This especially applies to the other patterns that were not able to walk.
FrAMA Volatility Contraction with Force Index Expansion
Our 8th pattern combines FrAMA volatility contraction with trends on the Force Index. The bullish signal is when FrAMA flattens, as marked by either a low slope or a tight price range, and the Force Index surges positively from near the zero bound towards its overbought levels. The bearish signal is also when FrAMA flattens and the Force Index dips significantly from the zero towards the oversold level.
The Force Index oscillator is not like the RSI or Stochastic oscillator in that the extreme levels are not defined by absolute values. The extreme values vary from asset to asset. This makes our definition of overbought and oversold regions slightly problematic from a coding perspective. Nonetheless, we implement this pattern in MQL5 as follows:
//+------------------------------------------------------------------+
//| Check for Pattern 7.                                             |
//+------------------------------------------------------------------+
bool CSignalFRM_FRC::IsPattern_7(ENUM_POSITION_TYPE T)
{  if(T == POSITION_TYPE_BUY && fabs(FRM(X()) -  FRM(X() + 5)) <= fabs(Close(X()) - Close(X() + 1))  && FRC(X()) > 0.0 && FRC(X() + 1) < 0.0 && FRC(X()) - FRC(X() + 1) >= 2.0 * fabs(FRC(X() + 1)))
   {  return(true);
   }
   else if(T == POSITION_TYPE_SELL && fabs(FRM(X()) -  FRM(X() + 5)) >= fabs(Close(X()) - Close(X() + 1))  && FRC(X()) < 0.0 && FRC(X() + 1) > 0.0 && FRC(X()) - FRC(X() + 1) <= -2.0 * fabs(FRC(X() + 1)))
   {  return(true);
   }
   return(false);
}
Pattern-7 picks up prior low volatility periods by using FrAMA that are followed by Force Index expansive moves. It is geared to capture explosive moves after consolidation. The volume-backing of the Force Index plays a key role in establishing reliability. A FrAMA contraction followed by volume spike makes this pattern well suited for trading in range breakouts since in this instance FrAMA serves as the low volatility identifier and signal strength confirmation with the Force.
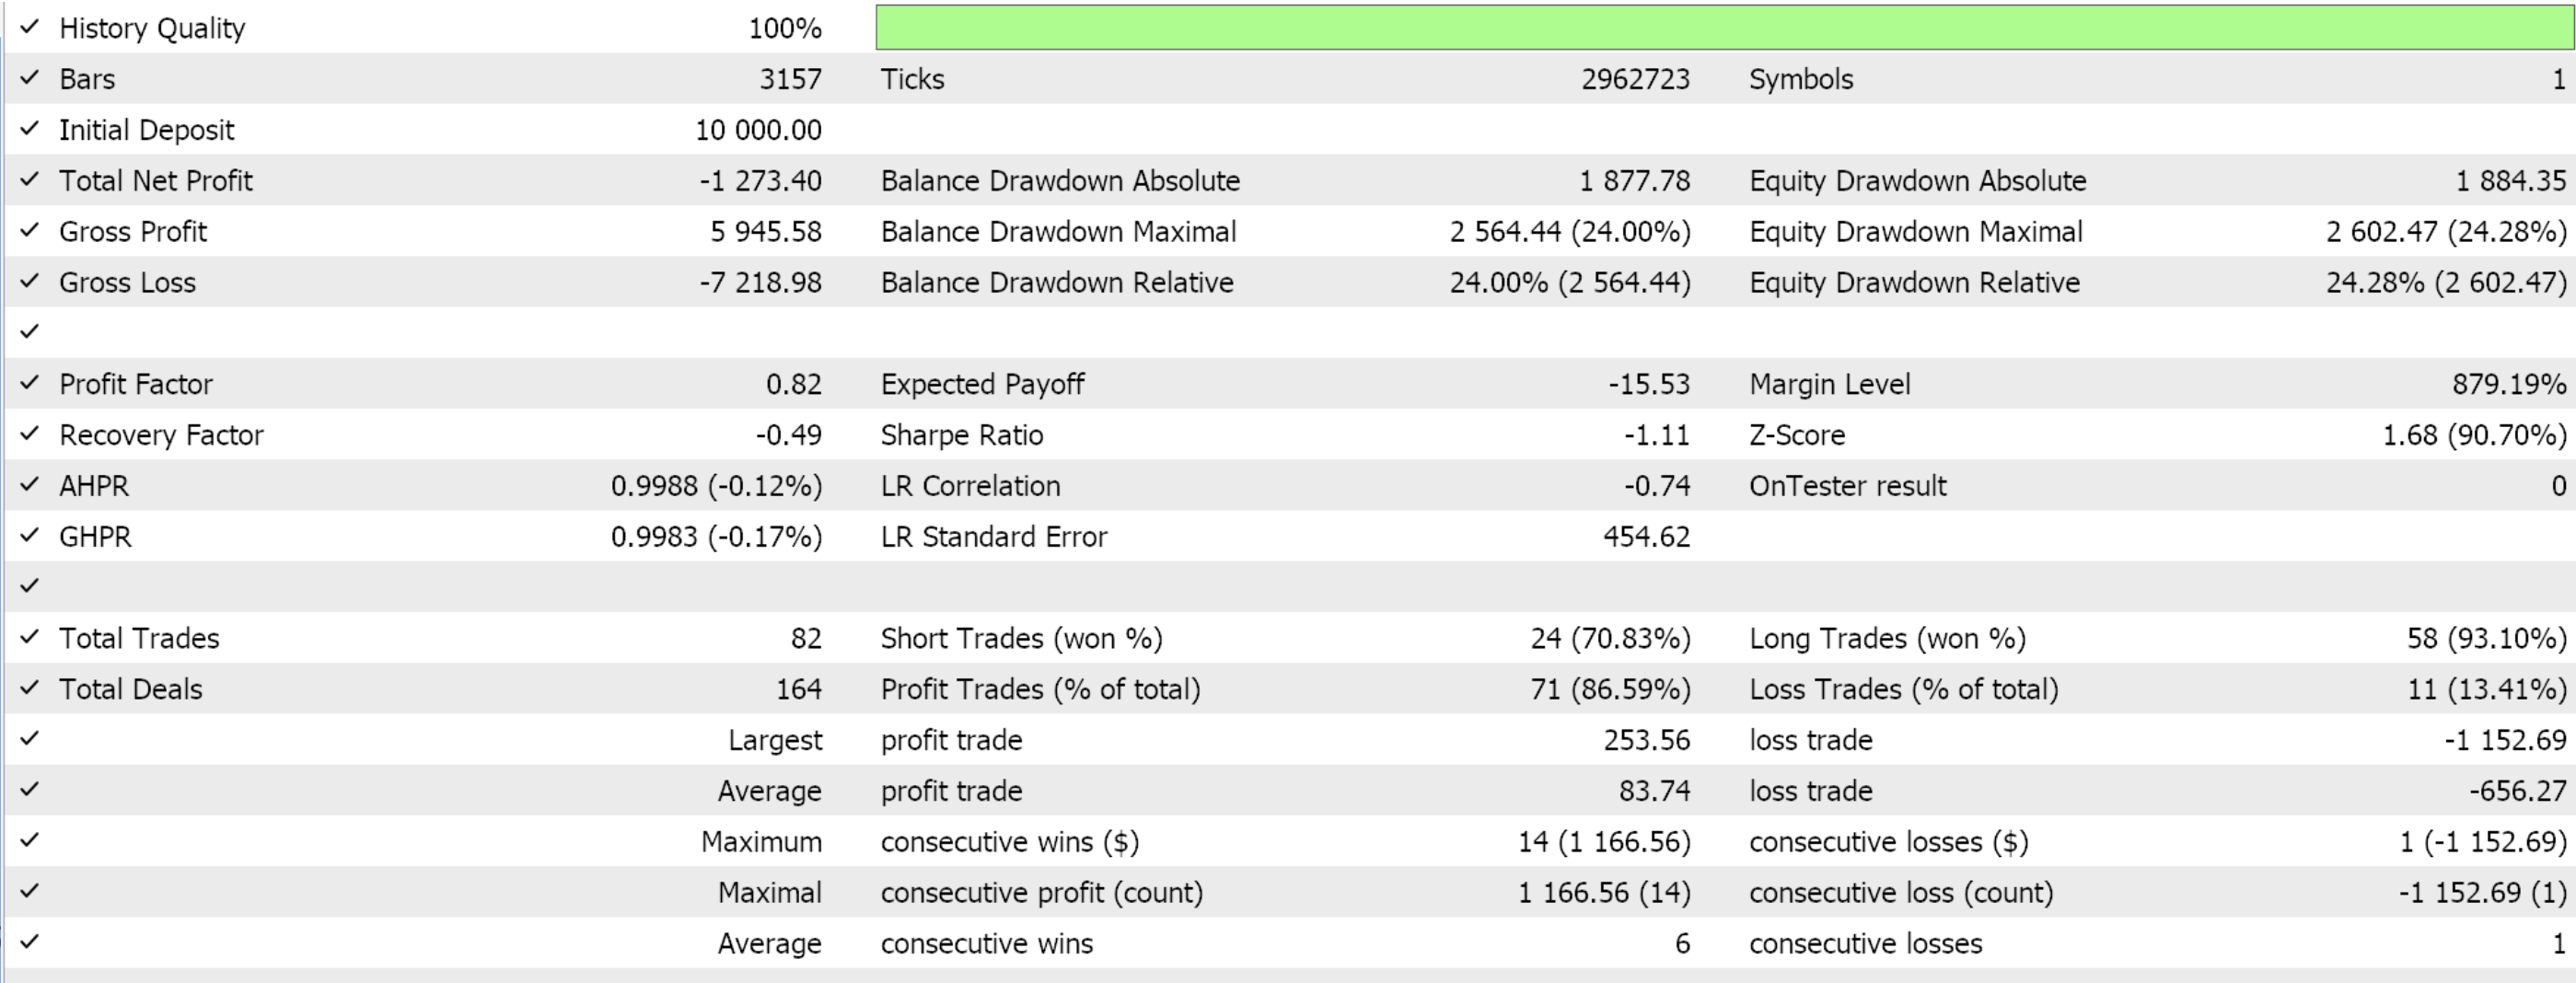
Measuring the flatness of FrAMA can also be done by considering its slope or comparing its changes to another indicator like the ATR. Force Index thresholds are key here and one needs to find a way of defining this, which in our case is by sizing up the magnitude of the move from the zero bound. Combining this pattern with the Bollinger Bands or the Keltner Channel can help confirm volatility contraction. Stop-losses can be added in the consolidation range. This pattern also did not walk, and its report to this effect is given below:
FrAMA Trend Strength with Force Index Divergence Filter
The penultimate pattern considers the FrAMA move strength and the Force Index divergence. A bullish signal is when FrAMA is trending up strongly at a steep slope and the Force Index shows no bearish divergence, which confirms the bullish case. The bearish pattern is the flip, with the FrAMA indicating strong bearish trend and the Force Index giving off no bullish divergence. Implementation in MQL5 is as follows;
//+------------------------------------------------------------------+
//| Check for Pattern 8.                                             |
//+------------------------------------------------------------------+
bool CSignalFRM_FRC::IsPattern_8(ENUM_POSITION_TYPE T)
{  if(T == POSITION_TYPE_BUY && Close(X()) > Close(X() + 1)  && FRC(X()) > FRC(X() + 1) && FRM(X()) - FRM(X() + 1) >= 2.0 * FRM(X() + 1))
   {  return(true);
   }
   else if(T == POSITION_TYPE_SELL && Close(X()) < Close(X() + 1)  && FRC(X()) < FRC(X() + 1) && FRM(X()) - FRM(X() + 1) <= -2.0 * FRM(X() + 1))
   {  return(true);
   }
   return(false);
}
Key to this pattern is price is fairly above for bullish or below for bearish from the FrAMA. Using the FrAMA to assess trend strength as filtered by the Force Index should avoid false signals, improve trade accuracy in trending markets, and balance trend and volume analysis. This pairing in pattern-8 allows traders to stay in strong trends while avoiding entries during weakening momentum as the Force Index acts as a filter.
When implementing this, the use of a trend threshold we can sharpen entries even further if this threshold is based on say FrAMA slope or price percentage changes. Monitoring the Force Index for hidden divergences, exiting trades if divergences persist across multiple time frames, and also properly back testing FrAMA input settings to optimize trend strength detection should all be considered. Forward testing of pattern 8 does not produce a walk as well, and its report is persented below;
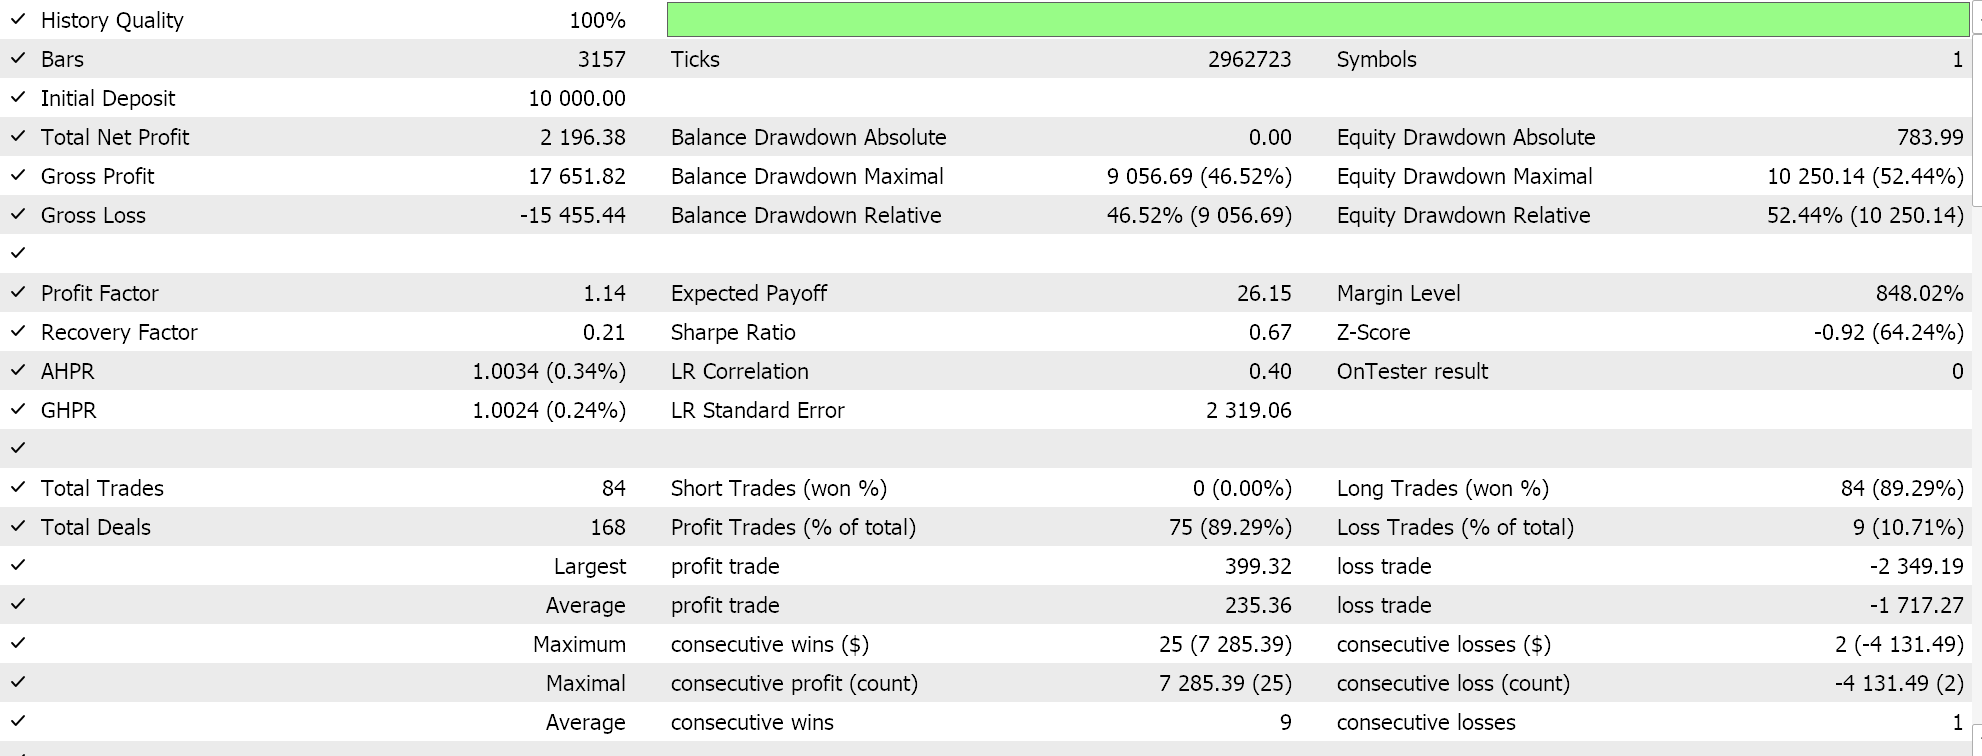
FrAMA Multi-Timeframe with Force Index Alignment
Using the basics of our two indicators on two separate time frames is our final indicator pairing, pattern-9. The bullish signal is when, for the FrAMA, it is rising on both the lower time frame and the higher timeframe; and the Force Index is also simply above the zero bound also on both time frames. We have implemented this, for our testing purposes, to have a larger time frame of daily to complement our base test period of 4-hours. For the bearish signal, we would also have a bearish trend in FrAMA on both the main time frame and larger time frame, while the Force Index is also sub-zero on both the time frames. We implement this in MQL5 as follows;
//+------------------------------------------------------------------+
//| Check for Pattern 9.                                             |
//+------------------------------------------------------------------+
bool CSignalFRM_FRC::IsPattern_9(ENUM_POSITION_TYPE T)
{  if(T == POSITION_TYPE_BUY && Close(X()) > Close(X() + 1) && FRC(X()) > FRC(X() + 1) && FRM(X()) > FRM(X() + 1) && FRC(X()) > FRC(X() + 1) && FRM(X()) > FRM(X() + 1))
   {  return(true);
   }
   else if(T == POSITION_TYPE_SELL && Close(X()) < Close(X() + 1) && FRC(X()) < FRC(X() + 1) && FRM(X()) < FRM(X() + 1) && FRC(X()) < FRC(X() + 1) && FRM(X()) < FRM(X() + 1))
   {  return(true);
   }
   return(false);
}
The combination of these very basic signals from the two indicators on two timeframes aligns for high probability trades. Pattern-9 enhances confluence by aligning trend and volume. It can be ideal for swing and position trading. The maximizing of confluence works towards reducing false signals. Testing over the year 2024 after optimizing/training over 2023 gives us the following report which is only the second report of the total 10 we have looked at in this article, that forward walks
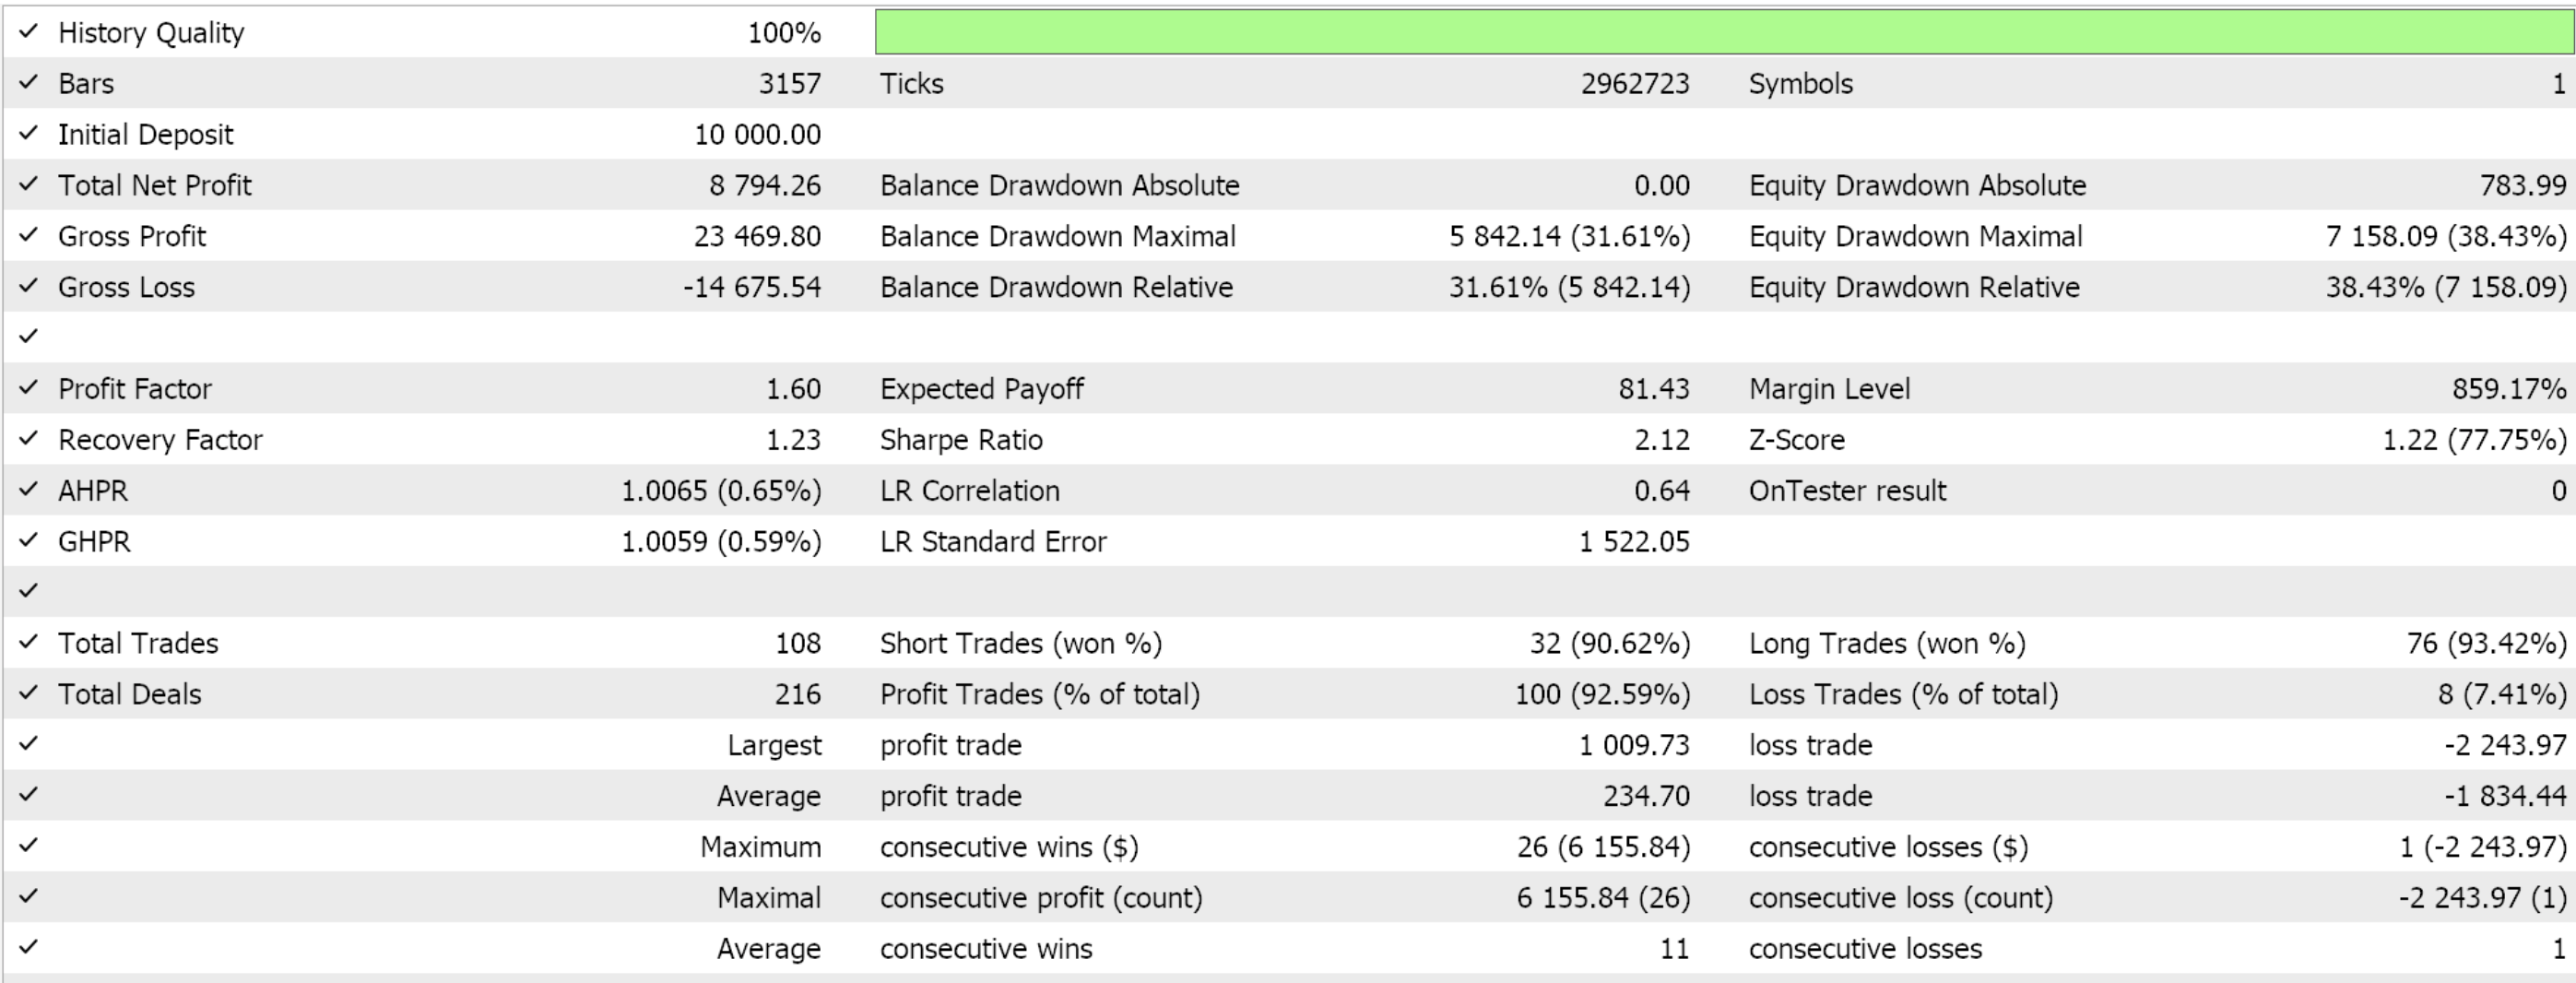
We have implemented this with a Daily timeframe, but even higher time frames can be considered when testing over periods that exceed a year in order to maintain robustness. In addition, the trends of the Force Index can also be required to be trending upwards for the bullish signal and downward for the bearish signal on top of their relative positioning to the zero bound. Also, we have used a standard period for the FrAMA, 14, however this figure can be customized for each timeframe for extensive testing.
Of the 10 patterns we have examined above, only 2 were able to forward walk. Strictly speaking, training/ optimizing any Expert Advisor over one year is never sufficient to mean it will forward walk over the subsequent year. Asset market trends can be persistent for more than a year, for many tradeable securities, and therefore in order to have a more robust trade system it is important to train or optimize the Expert Advisor across many years when seeking balanced input settings.
With that said, from past articles we have had ‘better-promising’ results even with this short training window of 1-year followed by testing over the following year. Our results for this indicator pairing could therefore have underlying issues that prevent them from auguring well. Reasons for this are considered below.
Why FrAMA and Force Index pairing could be problematic
FrAMA, a trend following indicator, does adapt its smoothing based on the fractal dimension of price movements. It effectively tracks price movements with a reduction in lag. The Force Index which multiplies price changes to volume tends to reflect price change dynamics since its primary component is the price change. This overlap means both indicators are heavily influenced by trends in price. This potentially leads to redundant signals rather than complementary insights.
This can be problematic for forecasting because in financial time series forecasting, benefits from diverse inputs capture different aspects of market behaviour. These broad categories tend to include trend, momentum, volatility, volume etc. Redundant signals do reduce the information available to a model for forecasting by limiting the ability to generalize across various market conditions. For instance, if both indicators signal an uptrend simultaneously, they may be amplifying noise rather than provide any unique features.
Instead of pairing FrAMA with the Force Index, it may be better to consider combining it with another indicator that captures orthogonal information, such as support/ resistance or momentum. These could be the Bollinger Bands and the RSI, respectively. Such combinations could ensure the model receives diverse inputs, which can improve its ability to forecast price movements.
Force Index’s heavy volume dependence where we are not able to use or access real volume and thus have to settle for tick volume could be another weakness. This compromise does make the Force Index less reliable. Also, there is a lag and sensitivity mismatch because FrAMA. FrAMA’s adaptive smoothing can conflict with Force Index’s rapid response to price and volume changes, which can lead to conflicting signals in volatile periods.
It can be argued as well that there is limited predictive power, since neither indicator is inherently designed for forecasting future price levels. It can be defended that they are suited at identifying current trends and volume levels, but not necessarily forecasting.
Conclusion
We have looked at another indicator pair of FrAMA and the Force Index Oscillator for this article. Though not as ‘profitable’ as some pairs we have considered in previous articles, there are many aspects to our process that need to be factored in as always before long-term conclusions can be drawn. Chief among them is always testing with intended Broker’s real-tick data, and over several years, before deployment. We look in the next article as to how machine learning could enhance this indicator pairing, if at all.
| name | description |
|---|---|
| wz-65.mq5 | Wizard Assembled File whose header shows files used |
| SignalWZ-65.mqh | Signal Class File |
Warning: All rights to these materials are reserved by MetaQuotes Ltd. Copying or reprinting of these materials in whole or in part is prohibited.
This article was written by a user of the site and reflects their personal views. MetaQuotes Ltd is not responsible for the accuracy of the information presented, nor for any consequences resulting from the use of the solutions, strategies or recommendations described.
 Trading with the MQL5 Economic Calendar (Part 9): Elevating News Interaction with a Dynamic Scrollbar and Polished Display
 Price Action Analysis Toolkit Development (Part 23): Currency Strength Meter
 Neural Networks in Trading: Controlled Segmentation
 Data Science and ML (Part 40): Using Fibonacci Retracements in Machine Learning data
- Free trading apps
- Over 8,000 signals for copying
- Economic news for exploring financial markets
You agree to website policy and terms of use