
Redefining MQL5 and MetaTrader 5 Indicators

Introduction
MQL5 is no longer a simple programming language as it used to be for making simple trading robots. The language has matured nowadays you can pretty much create trading programs of much complexity deploy and test in a much more robust and convenient way.
All of us have used either the "native" or "custom indicators" at some point in our trading journey. MetaTrader5 has an easy interface for loading and attaching the indicator to the chart, this enables traders (manual traders mostly) to analyze the markets conveniently using indicators in a way, however, when it comes to algorithmic trading it's not about what you see on the chart but the calculations of an indicator that matters.
In manual trading for example, one may need to look at the moving average indicator line to detect a trend if that's what they are looking for but, in algorithmic trading, we might look for a positive trend based on whether the closing price is above or below the moving average value calculated over a certain number of bars.
When it comes to algorithmic trading to use a certain indicator, for example a Simple Moving Average(SMA) of period 20, you have to:
int sma_handle; //Declare an indicator handle
//+------------------------------------------------------------------+
//| Expert initialization function                                   |
//+------------------------------------------------------------------+
int OnInit()
  {
   sma_handle = iMA(Symbol(), Period(), 20, 0, MODE_SMA, PRICE_CLOSE); //Initialize the indicator inside the OnInit function

//---
   return(INIT_SUCCEEDED);
  }
//+------------------------------------------------------------------+
//| Expert deinitialization function                                 |
//+------------------------------------------------------------------+
void OnDeinit(const int reason)
  {
//---

  }
//+------------------------------------------------------------------+
//| Expert tick function                                             |
//+------------------------------------------------------------------+
void OnTick()
  {
//---

   double sma_buffer[];
   CopyBuffer(sma_handle, 0, 0, 1, sma_buffer); //Copy the indicator buffers inside the Ontick function
  }
This approach is handy and works fine, to say the least, but, it feels crude and doesn't give us the flexibility and control to what information can be passed to the indicator for immediate calculations.
Based on this approach, it is stated that the Moving average (MA) indicator is only supposed to be applied to either one of the price constants provided in the docs.
| ID | Description |
|---|---|
| PRICE_CLOSE | Close price |
| PRICE_OPEN | Open price |
| PRICE_HIGH | The maximum price for the period |
| PRICE_LOW | The minimum price for the period |
| PRICE_MEDIAN | Median price, (high + low)/2 |
| PRICE_TYPICAL | Typical price, (high + low + close)/3 |
| PRICE_WEIGHTED | Average price, (high + low + close + close)/4 |
Not to mention that you are restricted to the smoothing methods/techniques as described in the docs.
| ID | Description |
|---|---|
| MODE_SMA | Simple averaging |
| MODE_EMA | Exponential averaging |
| MODE_SMMA | Smoothed averaging |
| MODE_LWMA | Linear-weighted averaging |
What happens when you want to try something out of the box? For example, wanting to calculate the moving average of the difference between high and low prices, it's impossible based on the current approach as we are restricted and limited to what we can do with the indicators.
I understand that most indicators are what they are based on how they were defined and derived mathematically, but, wouldn't it be awesome if we can pass different inputs and parameters to the indicators for the sake of observing new patterns in the market?
Inspired by the Technical Analysis (TA-Lib) python library, This innovative approach aims to give traders and algorithmic systems developers more control over what information is fed to the indicator for immediate calculations.

In this article, we will be implementing a few indicators (most used ones) using this plug-and-play approach.
Grouped into categories.
Trend Indicators
- Simple Moving Average Indicator
- Exponential Moving Average Indicator
- Bollinger Bands
- The Parabolic SAR
- Standard Deviation
Oscillators
- The Moving Average Convergence Divergence (MACD)
- Relative Streng Index (RSI)
- Stochastic Oscillators
- Average True Range (ATR)
- Momentum Indicator
Bill Williams
- Accelerator Oscillator
- Awesome Oscillator
Simple Moving Average (SMA) Indicator
This is one of the most commonly used technical indicators, It calculates the average of a price series over a specified period value.
Given by the formula.
![]()
Where:
-
 are prices (e.g. (closing prices) over
  period.
 -
 is the period of the SMA.
We can easily implement this formula in a vectorized function.
File: ta-lib.mqh
vector CTrendIndicators::SMA(const vector &price, uint period, uint shift = 0)
  {
   uint size = (uint)price.Size();

   if(!CheckShiftPeriod(size, period, shift))
      return price;

//---

   vector ma(size);
   ma.Fill(NaN);

   for(uint i = shift + period - 1; i < size; i++) //Loop through all the prices considering the period and shift
     {
      double sum = 0;
      for(uint j = i - period + 1; j <= i; j++)
         sum += price[j]; //sum of the prices

      ma[i] = sum / period; //divided by period to find the mean of that period
     }

   return ma;
  }
This is how a simple moving average indicator is calculated, No buffers deployed, no checking of MQL5 errors when loading the indicator for a particular symbol, etc. which can be tiresome.
This minimalist approach only checks if the shift and period values are correct, if they are, the function proceeds with the indicator calculations returning the calculated values in a vector form. I decided to use the vector format to gain more control and flexibility on the final outcome.
Since all the functions in our Indicators classes are static ones, we can easily access indicator values in our MQL5 programs, For example, In a simple script.
File: Custom Indicators test script.mq5
#include <ta-lib.mqh>
//+------------------------------------------------------------------+
//| Script program start function                                    |
//+------------------------------------------------------------------+
void OnStart()
  {
     vector prices = {1,2,3,4,5,6,7,8,9,10};
     int period = 3;

     Print("SMA values: ", CTrendIndicators::SMA(prices, period));
  }
Outputs
2025.01.21 09:57:35.727 Custom Indicators test script (EURUSD,H1) SMA values: [nan,nan,2,3,4,5,6,7,8,9]
Just like that, we were able to calculate the simple moving average indicator given a vector of some values, We are going to discuss how to plot these values for a visual indicator later on.
Exponential Moving Average (EMA) Indicator
The EMA is calculated as the average of a price series over a specific number of periods just like the SMA but, it gives more weight to recent prices making it more responsive to price changes compared to the Simple Moving Average (SMA).
Given by the formula.
![]()
Where:
-
 is the EMA at time t.
 - Pt is price at time t.
-
 is the EMA of the previous period.
 -
 is the smoothing factor (where n is the period)
We can implement it in MQL5 as follows;
File: ta-lib.mqh
vector CTrendIndicators::EMA(const vector &price, uint period, uint shift = 0)
  {
   uint size = (uint)price.Size();

   if(!CheckShiftPeriod(size, period, shift))
      return price;

//---

   double alpha = 2.0 / (period + 1.0);    // Smoothing factor

   vector res(size);
   res.Fill(NaN);

// Initialize the EMA with the SMA of the first period

   vector sma = SMA(price, period, shift);
   res[period - 1 + shift] = sma[period - 1 + shift];

// Calculate EMA for the rest of the prices

   for(ulong i = period + shift; i < size; i++)
      res[i] = alpha * price[i] + (1 - alpha) * res[i - 1];

   return res;
  }
We can obtain the calculated indicator values similarly to how we did for the SMA.
File: Custom Indicators test script.mq5
void OnStart()
  {
     vector prices = {1,2,3,4,5,6,7,8,9,10};
     int period = 3;

     Print("EMA values: ", CTrendIndicators::EMA(prices, period));
  }
Outputs
2025.01.21 10:19:54.291 Custom Indicators test script (EURUSD,H1) EMA values: [nan,nan,2,3,4,5,6,7,8,9]
We have calculated the Simple Moving Average (SMA) and the Exponential Moving Average (EMA) Indicators separately, unlike how they are calculated inside the the built-in IMA indicator which gives an option for the smoothing method you would prefer.
This separated approach requires writing additional lines of code to implement all the moving average indicators smoothing methods.
Functions for smoothing methods such as the MODE_SMMA (Smoothed averaging) and (MODE_LWMA) Linear-weighted averaging are yet to be implemented in the library as I believe they are not commonly used as their counterparts (the SMA and EMA smoothing methods).
The Bollinger Bands Indicator
This is a volatility indicator consisting of three bands.
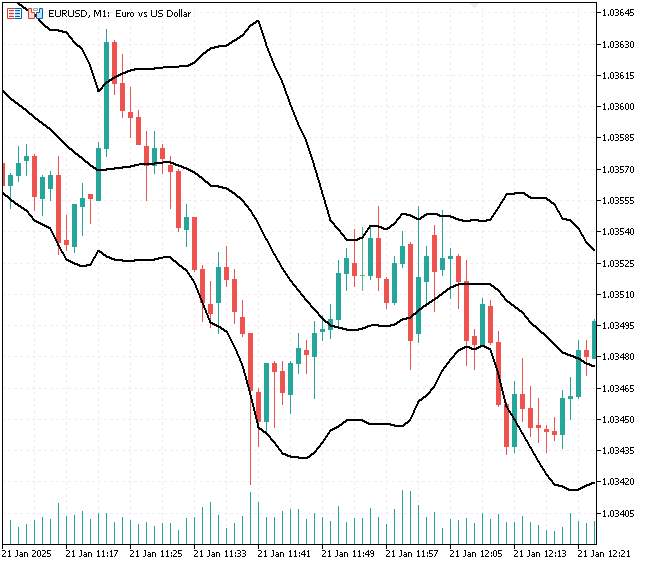
- The Middle band is a Simple moving average (SMA) of the closing prices over a specific period.

- The Upper band is the middle band plus a multiple of the standard deviation of the closing prices over the same period.

Where:
-
 is typically 2 (the standard setting for Bollinger Bands),
 -
 is the period for SMA and standard deviation calculations.
Since this indicator has to return three (3) one-dimensional (1D) values, known as buffers when you use the built-in Bollinger bands indicator, lets make this function return a structure of 3 vectors.
File: ta-lib.mqh
struct BB_res_struct
  {
   vector            upper_band;
   vector            lower_band;
   vector            middle_band;
  };
BB_res_struct CTrendIndicators::BollingerBands(const vector &price, uint period, uint shift = 0, double k = 2.0)
  {
   uint size = (uint)price.Size();

   BB_res_struct res;

//--- Check for valid parameters
   if(!CheckShiftPeriod(size, period, shift))
      return res;

//--- Initialize vectors

   res.upper_band.Resize(size);
   res.lower_band.Resize(size);

   res.upper_band.Fill(NaN);
   res.lower_band.Fill(NaN);

//--- Calculate the middle band (SMA)

   res.middle_band = SMA(price, period, shift);

//--- Calculate the upper and lower bands

   for(uint i = shift + period - 1; i < size; i++)
     {
      double sum_squared_diff = 0;
      for(uint j = i - period + 1; j <= i; j++)
        {
         sum_squared_diff += MathPow(price[j] - res.middle_band[i], 2);
        }

      double std_dev = MathSqrt(sum_squared_diff / period);

      res.upper_band[i] = res.middle_band[i] + (k * std_dev);
      res.lower_band[i] = res.middle_band[i] - (k * std_dev);
     }

   return res;
  }
Below, is how you easily implement the Bollinger bands indicator and obtain its values.
File: Custom Indicators test script.mq5
void OnStart()
  {
     vector prices = {1,2,3,4,5,6,7,8,9,10};
     int period = 3;

     BB_res_struct bb;
     bb = CTrendIndicators::BollingerBands(prices,period,0,2);

     Print("BB upper: ",bb.upper_band);
     Print("BB middle: ",bb.middle_band);
     Print("BB lower: ",bb.lower_band);
  }
Outputs
RL      0       11:39:21.000    Custom Indicators test script (EURUSD,H1)       BB upper: [nan,nan,3.632993161855452,4.632993161855453,5.632993161855453,6.632993161855453,7.632993161855453,8.632993161855453,9.632993161855453,10.63299316185545]
RO      0       11:39:21.000    Custom Indicators test script (EURUSD,H1)       BB middle: [nan,nan,2,3,4,5,6,7,8,9]
FF      0       11:39:21.000    Custom Indicators test script (EURUSD,H1)       BB lower: [nan,nan,0.3670068381445479,1.367006838144548,2.367006838144548,3.367006838144548,4.367006838144547,5.367006838144547,6.367006838144547,7.367006838144547]
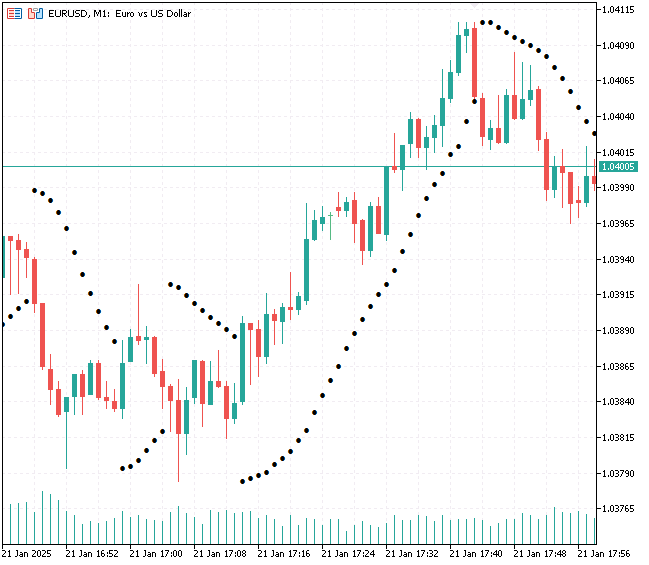
The Parabolic SAR (Stop and Reverse)
This is a trend-following indicator used to identify potential reversals in the market. It places dots above or below the price based on the trend direction.
Given by the formula.
For uptrend
![]()
For downtrend
![]()
Where:
-
 = The next period's SAR value
 -
 = Accelaration Factor (Starts at a default value e.g 0.02 and increases by 0.02 each time a new high/low is reached. Up to a maximum value of 0.2)
 -
 = Extreme Point (highest high in an uptrend, lowest low in a downtrend)
This indicator can be implemented as follows in MQL5.
File: ta-lib.mqh
vector CTrendIndicators::ParabolicSAR(const vector &high,
                                      const vector &low,
                                      const vector &close,
                                      double step = 0.02,
                                      double max = 0.2)
  {
   uint size = (uint)close.Size();
   vector psar(size);
   psar.Fill(NaN);

// Initialize variables

   double AF = step;    // Acceleration Factor
   double EP = high[0];      // Extreme Point
   double SAR = low[0];      // Initial SAR
   bool isUptrend = true;    // Assume uptrend at the start

// Calculate Parabolic SAR

   for(uint i = 0; i < size; i++)
     {
      // Update SAR
      if(isUptrend)
         SAR = SAR + AF * (EP - SAR);
      else
         SAR = SAR + AF * (SAR - EP);

      // Determine if trend changes
      if(isUptrend && SAR > low[i])
        {
         // Switch to downtrend
         isUptrend = false;
         SAR = EP;            // Reset SAR to the most recent EP
         EP = low[i];         // Reset EP
         AF = step;      // Reset AF
        }

      else
         if(!isUptrend && SAR < high[i])
           {
            // Switch to uptrend
            isUptrend = true;
            SAR = EP;            // Reset SAR to the most recent EP
            EP = high[i];        // Reset EP
            AF = step;      // Reset AF
           }

      // Update EP and AF
      if(isUptrend)
        {
         if(high[i] > EP)
           {
            EP = high[i];
            AF = MathMin(AF + step, max);
           }
        }
      else
        {
         if(low[i] < EP)
           {
            EP = low[i];
            AF = MathMin(AF + step, max);
           }
        }

      // Store the SAR value
      psar[i] = SAR;
     }

   return psar;
  }
Unlike the prior two trend following-indicators which can receive a single vector as a price input, the parabolic SAR considers three(3) price values (High, Low and, Close values).
File: Custom Indicators test script.mq5
void OnStart()
  {
     vector close = {1,2,3,4,5,6,7,8,9,10};
     vector high = {1.5,2.5,3.5,4.5,5.5,6.5,7.5,8.5,9.5,10.5};
     vector low = {0.5,1.5,2.5,3.5,4.5,5.5,6.5,7.5,8.5,9.5};

     Print("Parabolic SAR values: ", CTrendIndicators::ParabolicSAR(high,low,close,0.02,0.2));
  }
Outputs
2025.01.21 11:11:03.525 Custom Indicators test script (EURUSD,H1) Parabolic SAR values: [1.5,0.5,0.54,0.6584000000000001,0.8888960000000001,1.25778432,1.782005888,2.46816518144,3.3126220560384,4.302602527072256]
The Standard Deviation Indicator
This indicator measures the amount of variation or dispersion of the price from its mean. This indicator is often used to assess market volatility.
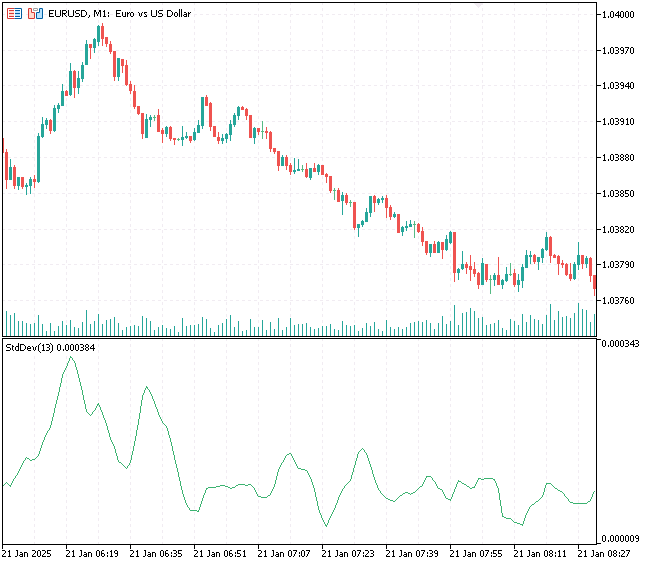
A high standard deviation value indicates high volatility while a low standard deviation value indicates low volatility.
Given by the formula.
![]()
Where:
-
 = Standard deviation
 - n = Period
-
 = Price point
 -
 = Mean of the data points
We can implement this indicator in MQL5 as follows;
File: ta-lib.mqh
vector CTrendIndicators::StandardDeviation(const vector &price, uint period, uint shift = 0)
  {
   uint size = (uint)price.Size();

// Check if the period and shift are valid
   if(!CheckShiftPeriod(size, period, shift))
      return price;

// Initialize standard deviation vector
   vector std_dev(size);
   std_dev.Fill(NaN);

// Loop through the price data
   for(uint i = shift + period - 1; i < size; i++)
     {
      double sum = 0.0;
      double sum_sq_diff = 0.0;

      // Calculate mean
      for(uint j = i - period + 1; j <= i; j++)
         sum += price[j];
      double mean = sum / period;

      // Calculate squared differences
      for(uint j = i - period + 1; j <= i; j++)
         sum_sq_diff += MathPow(price[j] - mean, 2);

      // Calculate standard deviation
      std_dev[i] = MathSqrt(sum_sq_diff / period);
     }

   return std_dev;
  }
This is another simple indicator that can be called as follows.
File: Custom Indicators test script.mq5
void OnStart()
  {
     vector prices = {1,2,3,4,5,6,7,8,9,10};
     int period = 3;

     Print("Stddev values: ", CTrendIndicators::StandardDeviation(prices, period));
  }
Outputs
2025.01.21 11:55:11.657 Custom Indicators test script (EURUSD,H1) Stddev values: [nan,nan,0.816496580927726,0.816496580927726,0.816496580927726,0.816496580927726,0.816496580927726,0.816496580927726,0.816496580927726,0.816496580927726]
The Moving Average Convergence Divergence (MACD)
This oscillator shows the relationships between two moving averages of a security's price. It is widely used as a technical analysis tool.

Given by the formula.
MACD Main Line
![]()
Where:
-
 = Exponential Moving Average with a shorter period (e.g. 12)
 -
 = Exponential Moving Average with a longer period (e.g 26)
Signal Line
![]()
This is a smoothed EMA of the MACD line, typically with a period value of 9
Macd Histogram
This is the difference between the MACD line and the signal line.
![]()
Similarly to how we returned multiple Bollinger bands calculated values, we define a structure for returning the MACD histogram, main and signal line values.
File: ta-lib.mqh
struct MACD_res_struct
  {
   vector            main;     // The MACD Line
   vector            signal;   // The Signal Line
   vector            histogram;    // The MACD Histogram
  };
MACD_res_struct COscillatorIndicators::MACD(const vector &price, uint fast_ema = 12, uint slow_ema = 26, uint macd_sma = 9, uint shift = 0)
  {
   uint size = (uint)price.Size();

   MACD_res_struct res;
   if(!CheckShiftPeriod(size, slow_ema, shift))
      return res;

//--- Calculate EMA(short), EMA(long), and MACD Line

   vector fast_ema_vector = CTrendIndicators::EMA(price, fast_ema, shift);
   vector slow_ema_vector = CTrendIndicators::EMA(price, slow_ema, shift);

   res.main.Resize(size);
   res.main.Fill(NaN);

   for(uint i = 0; i < size; i++)
      res.main[i] = fast_ema_vector[i] - slow_ema_vector[i];

//--- Calculate Signal Line (SMA of MACD Line)

   res.signal = CTrendIndicators::SMA(price, macd_sma, shift);

//--- Calculate MACD Histogram

   res.histogram.Resize(size);
   res.histogram.Fill(NaN);

   for(uint i = 0; i < size; i++)
      res.histogram[i] = res.main[i] - res.signal[i];

   return res;
  }
We can easily obtain the MACD oscillator calculated values inside a testing script as follows.
File: Custom Indicators test script.mq5
void OnStart()
  {
     vector prices = {1,2,3,4,5,6,7,8,9,10};

     MACD_res_struct macd;

     macd = COscillatorIndicators::MACD(prices,2,3,4);

     Print("MACD main: ", macd.main);
     Print("MACD signal: ", macd.signal);
  }
Outputs
RD      0       12:28:51.368    Custom Indicators test script (EURUSD,H1)       MACD main: [nan,nan,0.5,0.5,0.5,0.5,0.5,0.5,0.5,0.5]
HO      0       12:28:51.368    Custom Indicators test script (EURUSD,H1)       MACD signal: [nan,nan,nan,2.5,3.5,4.5,5.5,6.5,7.5,8.5]
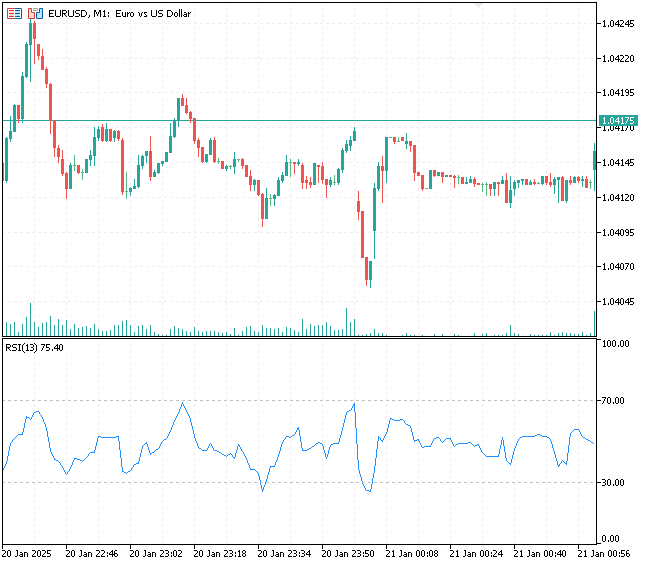
The Relative Strength Indicator (RSI)
This is a momentum oscillator that measures the speend and magnitude of price movements. It oscillates between 0 and 100, traders use it to identify overbought and oversold conditions in the market.
The calculations of the RSI indicator involves the following steps:
01: Finding the average gains and average losses over a specified period
![]()
![]()
02: Calculating the Relative Strength (RS)
![]()
03: Computing the RSI
![]()
MQL5 implementation
vector COscillatorIndicators::RSI(const vector &price, uint period, uint shift = 0)
  {
   uint size = (uint)price.Size();

//--- Check for valid parameters
   if(!CheckShiftPeriod(size, period, shift))
      return price;

//--- Initialize vectors
   vector rsi(size), gains(size), losses(size);
   rsi.Fill(NaN);
   gains.Fill(0.0);
   losses.Fill(0.0);

//--- Calculate gains and losses
   for(uint i = shift + 1; i < size; i++)
     {
      double change = price[i] - price[i - 1];
      gains[i] = (change > 0) ? change : 0;
      losses[i] = (change < 0) ? -change : 0;
     }

//--- Initialize first average gain and loss (simple average for the first period)
   double avg_gain = 0, avg_loss = 0;
   for(uint i = shift + 1; i < shift + 1 + period; i++)
     {
      avg_gain += gains[i];
      avg_loss += losses[i];
     }
   avg_gain /= period;
   avg_loss /= period;

//--- Compute RSI for the rest of the periods
   for(uint i = shift + period; i < size; i++)
     {
      // Apply smoothing for average gain and loss
      avg_gain = ((avg_gain * (period - 1)) + gains[i]) / period;
      avg_loss = ((avg_loss * (period - 1)) + losses[i]) / period;

      // Calculate RSI
      double rs = (avg_loss == 0) ? 0 : avg_gain / avg_loss;
      rsi[i] = (avg_loss == 0) ? 100 : (100 - (100 / (1 + rs)));
     }

   return rsi;
  }
Below is how you can obtain values from the RSI indicator.
void OnStart()
  {
     vector prices = {1,2,3,4,5,6,7,8,9,10};
     int period = 3;

     Print("RSI values: ", COscillatorIndicators::RSI(prices,period));
  }
Outputs
2025.01.21 12:51:29.640 Custom Indicators test script (EURUSD,H1) RSI values: [nan,nan,nan,100,100,100,100,100,100,100]
The Stochastic Oscillator Indicator
This is a momentum indicator that compares the closing price of a security to its price range over a specified period.
The formula for calculating this indicator consists of;
%K Line
![]()
Where:
-
 is the current closing price
 -
 is the lowest price over the lookback period
 -
 is the highest price over the lookback period
%D Line
This is the moving average of the %K Line typically using a 3 period simple moving average SMA
Below is how to implement this indicator in MQL5.
Stochastic_struct COscillatorIndicators::StochasticOscillator(const vector &high, const vector &low, const vector &close, uint k_period = 5, uint d_period = 3, uint period = 3, uint shift = 0)
  {
   uint size = (uint)close.Size();

   Stochastic_struct res;

// Check for valid parameters
   if(!CheckShiftPeriod(size, period, shift))
      return res;

// Initialize vectors for %K and %D
   vector K(size), D(size);
   K.Fill(NaN);
   D.Fill(NaN);

// Calculate %K
   for(uint i = shift + period - 1; i < size; i++)
     {
      double H_max = -DBL_MAX, L_min = DBL_MAX;

      // Find the highest high and the lowest low over the lookback period
      for(uint j = i - period + 1; j <= i; j++)
        {
         H_max = MathMax(H_max, high[j]);
         L_min = MathMin(L_min, low[j]);
        }

      // Calculate %K
      double K_value = (H_max - L_min != 0) ? ((close[i] - L_min) / (H_max - L_min)) * 100 : 0;
      K[i] = K_value;
     }

// Smooth %K with a simple moving average (k_period)
   vector smoothedK(size);
   smoothedK.Fill(NaN);

   for(uint i = shift + k_period - 1; i < size; i++)
     {
      double sum = 0;
      for(uint j = i - k_period + 1; j <= i; j++)
        {
         sum += K[j];
        }
      smoothedK[i] = sum / k_period;
     }

// Calculate %D (3-period moving average of %K)

   D = CTrendIndicators::SMA(smoothedK, period, shift);

   res.main = K;
   res.signal = D;

   return res;
  }
We return the signal and main line in a structure.
void OnStart()
  {
     vector close = {1,2,3,4,5,6,7,8,9,10};
     vector high = {1.5,2.5,3.5,4.5,5.5,6.5,7.5,8.5,9.5,10.5};
     vector low = {0.5,1.5,2.5,3.5,4.5,5.5,6.5,7.5,8.5,9.5};

     Stochastic_struct stoch;
     stoch = COscillatorIndicators::StochasticOscillator(high,low,close,5,3,3);

     Print("Stoch main: ", stoch.main);
     Print("Stoch signal: ", stoch.signal);
  }
The Average True Range (ATR) Indicator
This is a useful indicator for understanding market volatility. It measures the average range between high and low prices over a specified period.

Given by the formula.
01: Calculating the True Range (TR)
![]()
Where:
- H is the curernt period's high.
-
 is the current period's low.
 -
 is the previous period's close.
02: Calculating the Average True Range (ATR)
ATR is the moving average of the true range over a specified period.
![]() SMA is the Simple Moving Average.
SMA is the Simple Moving Average.
We can implement this indicator in MQL5 as follows.
vector COscillatorIndicators::ATR(const vector &high, const vector &low, const vector &close, uint period = 14, uint shift = 0)
  {
   uint size = (uint)close.Size();

// Check for valid parameters
   if(!CheckShiftPeriod(size, period, shift))
      return close;

// Initialize the True Range (TR) and ATR vectors
   vector TR(size);
   TR.Fill(NaN);

// Calculate the True Range for each period
   for(uint i = shift + 1; i < size; i++)
     {
      double H = high[i];
      double L = low[i];
      double C_prev = close[i - 1];

      // Calculate the three possible True Range values
      double TR1 = H - L;
      double TR2 = MathAbs(H - C_prev);
      double TR3 = MathAbs(L - C_prev);

      // True Range is the maximum of the three
      TR[i] = MathMax(TR1, MathMax(TR2, TR3));
     }

//--- Smooth the True Range using a simple moving average (SMA) over the specified period

   return CTrendIndicators::SMA(TR, period, shift);
  }
Below is how we can obtain the values for this indicator.
void OnStart()
  {
     vector close = {1,2,3,4,5,6,7,8,9,10};
     vector high = {1.5,2.5,3.5,4.5,5.5,6.5,7.5,8.5,9.5,10.5};
     vector low = {0.5,1.5,2.5,3.5,4.5,5.5,6.5,7.5,8.5,9.5};

     Print("ATR values: ", COscillatorIndicators::ATR(high,low,close,3));
  }
Outputs
2025.01.21 13:57:59.943 Custom Indicators test script (EURUSD,H1) ATR values: [nan,nan,nan,1.5,1.5,1.5,1.5,1.5,1.5,1.5]
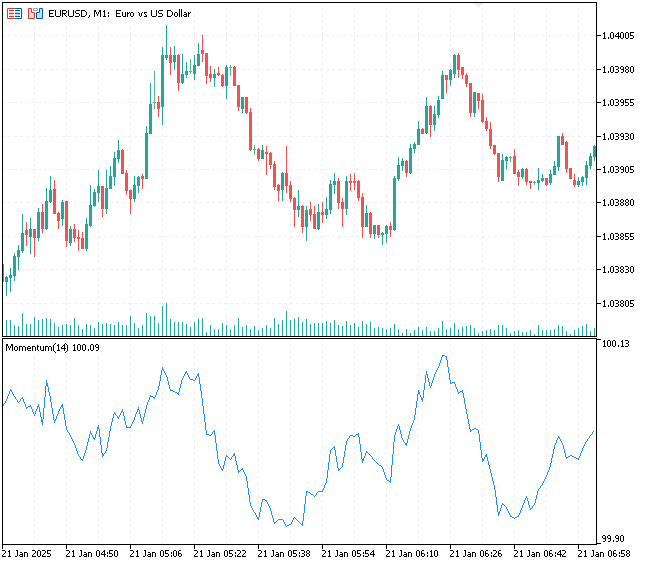
The Momentum Indicator
This is a simple indicator used to measure the speed at which an asset's price is moving over a specified period. It helps identify trends and potential trend reversals.
Given by a simple formula.
![]()
Where:
- Momentum(t) = momentum value at time t
- Price(t) = The current price
- Price(t - n) = Price at n periods ago
- n = the period over which momentum is calculated
Some variations for calculating the momentum use a ratio.
![]()
We are going to implement the momentum indicator using this variation.
MQL5 Implementation
vector COscillatorIndicators::MomentumIndicator(const vector &price, uint period, uint shift = 0)
  {
   uint size = (uint)price.Size();

// Check for valid input
   if(!CheckShiftPeriod(size, period, shift))
      return price;

// Initialize the momentum vector
   vector momentum(size);
   momentum.Fill(NaN);

// Calculate Momentum
   for(uint i = shift + period; i < size; i++)
     {
      //momentum[i] = price[i] - price[i - period]; // Momentum difference formula

      // using the ratio formula:
      momentum[i] = (price[i] / price[i - period]) * 100;
     }

   return momentum;
  }
Awesome Oscillator Indicator
This is a momentum indicator that calculates the difference between two Simple Moving Averages(SMAs) of the median price.
Given by the formula:
![]()
Where:
-
 = SMA with a shorter period (Commonly 5)
 -
 = SMA with a longer period (Commonly 34)
Below is the MQL5 implementation.
vector CBillWilliamsIndicators::AwesomeOscillator(const vector &high, const vector &low, uint fast_period = 5, uint slow_period = 34, uint shift = 0)
  {
   uint size = (uint)high.Size();
   if(size != low.Size())
      return vector::Zeros(0); // Ensure high and low vectors are of the same size

   if(!CheckShiftPeriod(size, slow_period, shift))
      return vector::Zeros(0); // Validate shift and slow period

// Initialize vectors
   vector ao(size), median_price(size);
   ao.Fill(NaN);
   median_price.Fill(NaN);

// Calculate Median Price
   for(uint i = 0; i < size; i++)
      median_price[i] = (high[i] + low[i]) / 2;

// Calculate Fast and Slow SMAs of the Median Price
   vector sma_fast = CTrendIndicators::SMA(median_price, fast_period, shift);
   vector sma_slow = CTrendIndicators::SMA(median_price, slow_period, shift);

// Calculate AO
   for(uint i = 0; i < size; i++)
      ao[i] = sma_fast[i] - sma_slow[i];

   return ao;
  }
Since we have very simple vectors for high and low prices, we can set the fast period to 3 and the slow period to 5.
void OnStart()
  {
     vector close = {1,2,3,4,5,6,7,8,9,10};
     vector high = {1.5,2.5,3.5,4.5,5.5,6.5,7.5,8.5,9.5,10.5};
     vector low = {0.5,1.5,2.5,3.5,4.5,5.5,6.5,7.5,8.5,9.5};

     Print("AO values: ", CBillWilliamsIndicators::AwesomeOscillator(high,low,3,5));
  }
Outputs.
2025.01.21 14:25:50.590 Custom Indicators test script (EURUSD,H1) AO values: [nan,nan,nan,nan,1,1,1,1,1,1]
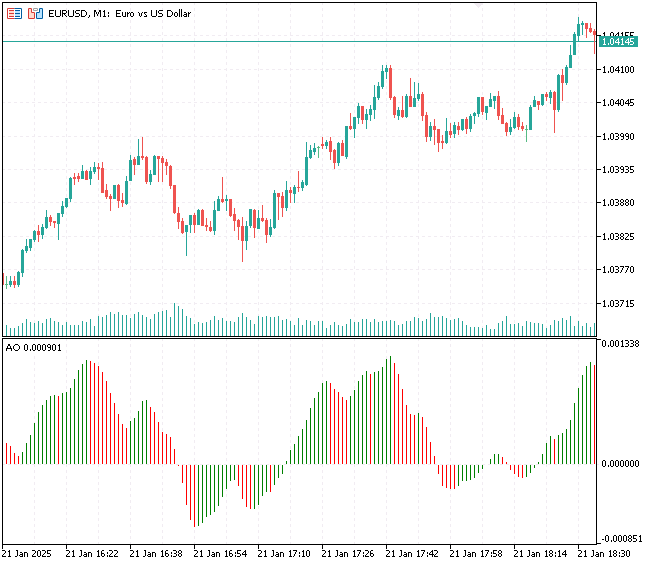
Accelerator Oscillator Indicator
The Accelerator Oscillator (AC) is a technical analysis tool that tracks the speed of changes in price momentum. It shows whether the market driving force accelerates or decelerates, helping traders anticipate potential reversals.
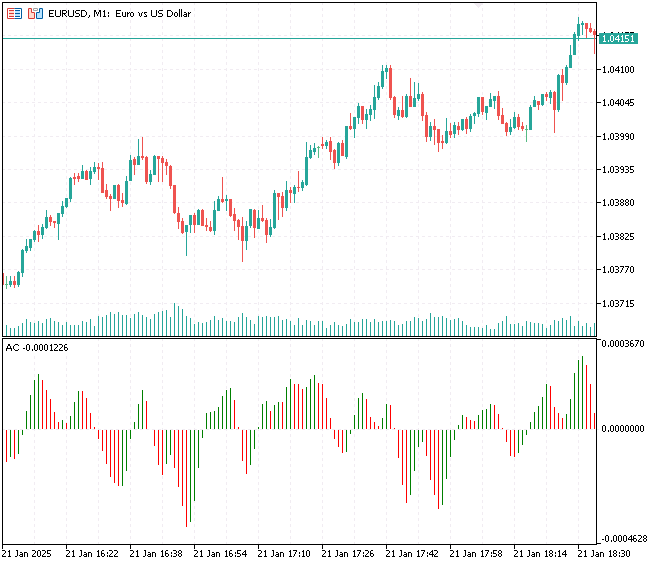
It is calculated as the difference between the Awesome Oscillator and the 5-period simple moving average (SMA) of the AO.
Given by the below formula.
We can implement this indicator in MQL5 as follows.
vector CBillWilliamsIndicators::AcceleratorOscillator(const vector &high,
      const vector &low,
      uint ao_period_fast = 5, // Fast period for AO
      uint ao_period_slow = 34, // Slow period for AO
      uint ac_period = 5 // Period for AC SMA
                                                     )
  {
   uint size = (uint)high.Size();
   if(size != low.Size())
      return vector::Zeros(0); // Ensure high and low vectors are of the same size


// Validate shift and period
   if(!CheckShiftPeriod(size, ao_period_slow, 0))
      return vector::Zeros(0);

// Calculate AO (Awesome Oscillator)

   vector ao = AwesomeOscillator(high, low, ao_period_fast, ao_period_slow);

// Calculate AC (Accelerator Oscillator)

   vector ac(size);
   ac.Fill(NaN);

   vector ao_sma_ac = CTrendIndicators::SMA(ao, ac_period);

   for(uint i = 0; i < size; i++)
      ac[i] = ao[i] - ao_sma_ac[i];

   return ac;
  }
Since the Accelerator Oscillator is very similar to the Awesome Oscillator, we can call its function with similar arguments.
void OnStart()
  {
     vector close = {1,2,3,4,5,6,7,8,9,10};
     vector high = {1.5,2.5,3.5,4.5,5.5,6.5,7.5,8.5,9.5,10.5};
     vector low = {0.5,1.5,2.5,3.5,4.5,5.5,6.5,7.5,8.5,9.5};

//--- Bill williams indicator

     Print("AO values: ", CBillWilliamsIndicators::AwesomeOscillator(high,low,3,5));
     Print("AC values: ", CBillWilliamsIndicators::AcceleratorOscillator(high,low,3,5));
  }
Outputs
MQ      0       14:40:36.296    Custom Indicators test script (EURUSD,H1)       AO values: [nan,nan,nan,nan,1,1,1,1,1,1]
EL      0       14:40:36.296    Custom Indicators test script (EURUSD,H1)       AC values: [nan,nan,nan,nan,nan,nan,nan,nan,0,0]
Indicators Data Collection Simplified
Now that we have seen how some of the indicators have been implemented in the library, we can try to collect whatever information we'd like to obtain from the market and build an indicator upon that. For example, I'm going to calculate the moving average for Open, High, Low, and Close prices.
We start by obtaining OHLC values.
int size = 1000;

vector open, high, low, close;

open.CopyRates(Symbol(), Period(), COPY_RATES_OPEN, 1, size);
high.CopyRates(Symbol(), Period(), COPY_RATES_HIGH, 1, size);
low.CopyRates(Symbol(), Period(), COPY_RATES_LOW, 1, size);
close.CopyRates(Symbol(), Period(), COPY_RATES_CLOSE, 1, size);
Starting with the simple moving average of period 20 applied to the opening prices.
vector sma_open = CTrendIndicators::SMA(open, 20);
We can collect various SMA indicators given a different period and a different price effortlessly.
vector sma_open = CTrendIndicators::SMA(open, 20);
vector sma_high = CTrendIndicators::SMA(high, 50);
vector sma_low = CTrendIndicators::SMA(low, 100);
vector sma_close = CTrendIndicators::SMA(close, 20);
Let us plug them into a matrix instead and observe them altogether.
matrix Indicators(size, 4);

Indicators.Col(CTrendIndicators::SMA(open, 20), 0);
Indicators.Col(CTrendIndicators::SMA(high, 50), 1);
Indicators.Col(CTrendIndicators::SMA(low, 100), 2);
Indicators.Col(CTrendIndicators::SMA(close, 20), 3);

Print("Indicators matrix\n",Indicators);
Outputs
NK      0       18:30:25.100    Custom Indicators test script (EURUSD,H1)        [1.0485715,1.0484514,nan,1.048488]
LL      0       18:30:25.100    Custom Indicators test script (EURUSD,H1)        [1.0484425,1.0485544,nan,1.0484265]
RP      0       18:30:25.100    Custom Indicators test script (EURUSD,H1)        [1.048381,1.0486754,nan,1.048299]
QG      0       18:30:25.100    Custom Indicators test script (EURUSD,H1)        [1.0483055,1.0488004,nan,1.048152]
KK      0       18:30:25.100    Custom Indicators test script (EURUSD,H1)        [1.0481585,1.0489198,nan,1.048296]
HL      0       18:30:25.100    Custom Indicators test script (EURUSD,H1)        [1.048303,1.049033,nan,1.0485255]
DS      0       18:30:25.100    Custom Indicators test script (EURUSD,H1)        [1.048533,1.0491756,nan,1.0487015]
OK      0       18:30:25.100    Custom Indicators test script (EURUSD,H1)        [1.048658,1.0493158,1.0475226,1.0488295]
KD      0       18:30:25.100    Custom Indicators test script (EURUSD,H1)        [1.0487895,1.0494628,1.047473,1.0488985]
JR      0       18:30:25.100    Custom Indicators test script (EURUSD,H1)        [1.0488575,1.0494916,1.0474256,1.0489465]
FR      0       18:30:25.100    Custom Indicators test script (EURUSD,H1)        [1.0489055,1.049475,1.0473723,1.0490045]
LL      0       18:30:25.100    Custom Indicators test script (EURUSD,H1)        [1.048964,1.0494814,1.0473137,1.049052]
HK      0       18:30:25.100    Custom Indicators test script (EURUSD,H1)        [1.0490075,1.0494728,1.0472494,1.0491065]
CF      0       18:30:25.100    Custom Indicators test script (EURUSD,H1)        [1.049062,1.0494618,1.0471845,1.049044]
RE      0       18:30:25.100    Custom Indicators test script (EURUSD,H1)        [1.0489995,1.0494452,1.047114,1.048892]
FQ      0       18:30:25.100    Custom Indicators test script (EURUSD,H1)        [1.048848,1.0494558,1.047044,1.0487065]
CL      0       18:30:25.100    Custom Indicators test script (EURUSD,H1)        [1.0486625,1.0495002,1.0469762,1.0486305]
DK      0       18:30:25.100    Custom Indicators test script (EURUSD,H1)        [1.048586,1.0496014,1.0469234,1.048582]
EE      0       18:30:25.100    Custom Indicators test script (EURUSD,H1)        [1.0485375,1.0496714,1.0468866,1.048646]
RE      0       18:30:25.100    Custom Indicators test script (EURUSD,H1)        [1.0486015,1.0497982,1.046857200000001,1.04877]
IP      0       18:30:25.100    Custom Indicators test script (EURUSD,H1)        [1.0487245,1.0498646,1.0468378,1.0490025]
DO      0       18:30:25.100    Custom Indicators test script (EURUSD,H1)        [1.0489565,1.0499466,1.046833500000001,1.0492415]
GN      0       18:30:25.100    Custom Indicators test script (EURUSD,H1)        [1.0491975,1.050113,1.046846700000001,1.0497525]
CK      0       18:30:25.100    Custom Indicators test script (EURUSD,H1)        [1.0497085,1.0502838,1.046881000000001,1.0502025]
IJ      0       18:30:25.100    Custom Indicators test script (EURUSD,H1)        [1.050159,1.0503826,1.046898100000001,1.0506915]
PF      0       18:30:25.100    Custom Indicators test script (EURUSD,H1)        [1.0506475,1.0504916,1.046935200000001,1.051158…]
Let's say I want to measure the momentum of these variable I have, by creating a momentum indicator based on them.
Indicators.Col(COscillatorIndicators::MomentumIndicator(open, 20), 4);
Indicators.Col(COscillatorIndicators::MomentumIndicator(high, 50), 5);
Indicators.Col(COscillatorIndicators::MomentumIndicator(low, 100), 6);
Indicators.Col(COscillatorIndicators::MomentumIndicator(close, 20), 7);
Outputs
IN      0       18:39:34.172    Custom Indicators test script (EURUSD,H1)        [1.0441885,nan,nan,1.0438975,99.43679181343492,nan,nan,99.44502817843157]
LN      0       18:39:34.172    Custom Indicators test script (EURUSD,H1)        [1.0438975,1.0495116,nan,1.043593,99.44407828753189,nan,nan,99.41864350150351]
QS      0       18:39:34.172    Custom Indicators test script (EURUSD,H1)        [1.0435925,1.0492638,nan,1.0433225,99.4176888931316,98.82473464044848,nan,99.4833645288208]
HG      0       18:39:34.172    Custom Indicators test script (EURUSD,H1)        [1.0436275,1.049148199999999,nan,1.043363,100.0668474731655,99.45161810609009,nan,100.0773424743863]
EH      0       18:39:34.172    Custom Indicators test script (EURUSD,H1)        [1.0436685,1.0490618,nan,1.043385,100.0782973197491,99.59030385797199,nan,100.0420047732697]
KO      0       18:39:34.172    Custom Indicators test script (EURUSD,H1)        [1.0436925,1.0489454,nan,1.0434175,100.0458251389074,99.4479854313681,nan,100.0620536907626]
JQ      0       18:39:34.172    Custom Indicators test script (EURUSD,H1)        [1.0437225,1.048834,nan,1.043484,100.0572803299347,99.47183265534476,nan,100.1270939444036]
JE      0       18:39:34.172    Custom Indicators test script (EURUSD,H1)        [1.043788,1.048718,nan,1.0435725,100.1251839535195,99.45010144680205,nan,100.1690625149243]
LE      0       18:39:34.172    Custom Indicators test script (EURUSD,H1)        [1.043877,1.048595199999999,nan,1.0435315,100.1700192943244,99.41799844546816,nan,99.92180198737388]
MI      0       18:39:34.172    Custom Indicators test script (EURUSD,H1)        [1.0438365,1.048457,nan,1.0437085,99.92275488503829,99.34503611305946,nan,100.3389538390831]
HN      0       18:39:34.172    Custom Indicators test script (EURUSD,H1)        [1.044013,1.0483164,nan,1.044095,100.3379931060896,99.33386396801032,nan,100.7431263218612]
KS      0       18:39:34.172    Custom Indicators test script (EURUSD,H1)        [1.0443985,1.048186,nan,1.044364,100.7411964891704,99.38227742565063,nan,100.5158345877638]
EE      0       18:39:34.172    Custom Indicators test script (EURUSD,H1)        [1.0446665,1.0480502,nan,1.044532,100.5139219145509,99.35649569733499,nan,100.3225558712848…]
Plotting Indicators Made with Custom Functions
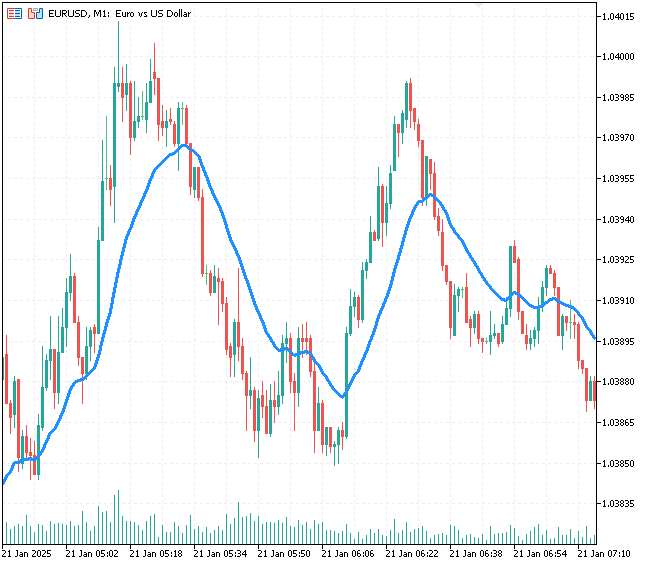
Let us attempt to make the indicator calculations obtained from this library visible to the human eye.
Despite this approach being aimed towards data collection rather than visualization, Let us visualize the indicator calculations in a custom MetaTrader 5 indicator.
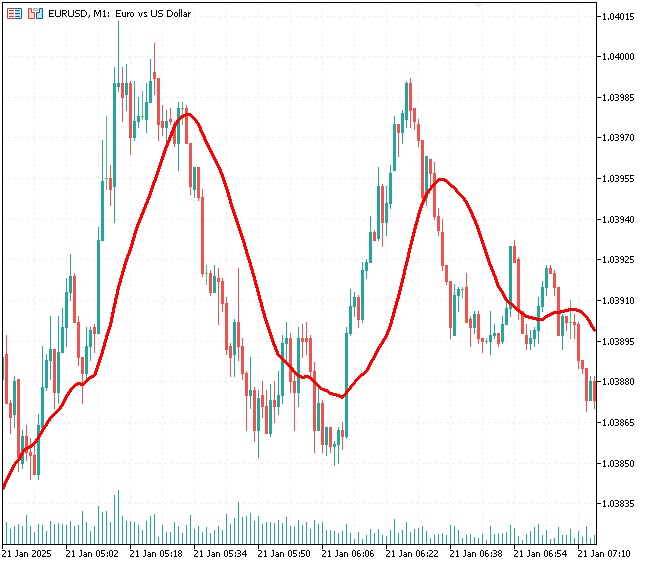
Visualizing the SMA (20) indicator.
#property indicator_chart_window
#property indicator_buffers 1
#property indicator_plots 1

#property indicator_color1 clrDodgerBlue
#property indicator_type1 DRAW_LINE
#property indicator_style1 STYLE_SOLID

#include <ta-lib.mqh>

input int period_ = 20; //SMA period

double buffer[];
//+------------------------------------------------------------------+
//| Custom indicator initialization function                         |
//+------------------------------------------------------------------+
int OnInit()
  {
//--- indicator buffers mapping

   SetIndexBuffer(0, buffer, INDICATOR_DATA);
   PlotIndexSetDouble(0, PLOT_EMPTY_VALUE, 0);

   PlotIndexSetString(0,PLOT_LABEL,"SMA("+string(period_)+")");
   PlotIndexSetInteger(0,PLOT_DRAW_BEGIN,period_+1);

//---
   return(INIT_SUCCEEDED);
  }
//+------------------------------------------------------------------+
//| Custom indicator iteration function                              |
//+------------------------------------------------------------------+
int OnCalculate(const int rates_total,
                const int prev_calculated,
                const datetime &time[],
                const double &open[],
                const double &high[],
                const double &low[],
                const double &close[],
                const long &tick_volume[],
                const long &volume[],
                const int &spread[])
  {
//---

   if (prev_calculated==0) //Initial indicator calculation, For Plotting the entire past
     {
       vector buffer_vector = CTrendIndicators::SMA(close, period_);

       VectorToArray(buffer_vector, buffer); //We assign the calculations into an array format
     }
    else //For plotting the current value
     {
       for (int i=prev_calculated-1; i<rates_total; i++) //Loop from the prev_calculated bars -1 to the total bars present
        {
           double temp_close[]; //For storing temporary close values
           int size = period_*2; //We are going to copy an equivalent of period x 2 to leave a room for NaN values

           if (ArrayCopy(temp_close, close, 0, i - size, size) < 0)
            {
               printf("Failed to copy closing price values to a temporary array, err = %d",GetLastError());
               continue;
            }

           vector indicator_values = CTrendIndicators::SMA(temp_close, period_);
           ulong last_index = indicator_values.Size() - 1; //The last value in the vector is the recent calculated indicator value

           buffer[i] = indicator_values[last_index]; //Assing the last indicator value to the last value in the buffer
        }
     }

//--- return value of prev_calculated for next call
   return(rates_total);
  }
//+------------------------------------------------------------------+
//|      A crude way to convert a vector into Array                  |
//+------------------------------------------------------------------+
template <typename T>
void VectorToArray(const vector<T> &v, T &arr[])
 {
   ArrayResize(arr, (uint)v.Size());

   for (uint i=0; i<(uint)v.Size(); i++)
       arr[i] = v[i];
 }
Outputs

Final Thoughts
This custom collection of indicator values approach is handy when it comes to data collection than in any other particular task, it is well suited for data analytics and enthusiasts who look for innovative ways to collect indicator data for analysis purposes.
I have often found myself in need of a quick way to get multiple indicator values without having to initialize the indicator and do all the boring stuff which oftentimes results in MetaTrader5 errors. With the increasing demand for data in MQL5, which is due to its newly introduced ability to handle sophisticated AI and ML models, we need different and effective ways to extract and visualize indicators data for analysis and ML training purposes.
Peace out.
Attachments Table
| Filename | Description/Usage |
|---|---|
| Include\ta-lib.mqh | MQL5 library with all the indicators code discussed in this article. |
| Indicators\Trend Indicators Redefined.mq5 | An indicator containing a simple moving average indicator implemented for demonstration purposes. |
| Scripts\Custom Indicators test script.mq5 | A simple script made for testing and debugging indicators code. |
Sources & References
- Relative Strength Index (RSI) Indicator Explained With Formula
- Moving Average (MA): Purpose, Uses, Formula, and Examples
- How to Use Bollinger Bands to Gauge Trends
- Parabolic SAR Indicator: Definition, Formula, Trading Strategies
- Standard Deviation Formula and Uses vs. Variance
- What is MACD?
- Stochastic Oscillator: What It Is, How It Works, How To Calculate
- Average True Range (ATR) Formula, What It Means, and How to Use It
Warning: All rights to these materials are reserved by MetaQuotes Ltd. Copying or reprinting of these materials in whole or in part is prohibited.
This article was written by a user of the site and reflects their personal views. MetaQuotes Ltd is not responsible for the accuracy of the information presented, nor for any consequences resulting from the use of the solutions, strategies or recommendations described.


 From Basic to Intermediate: Variables (I)
- Free trading apps
- Over 8,000 signals for copying
- Economic news for exploring financial markets
You agree to website policy and terms of use