MQL5 Programming Articles
Study the MQL5 language for programming trading strategies in numerous published articles mostly written by you - the community members. The articles are grouped into categories to help you quicker find answers to any questions related to programming: Integration, Tester, Trading Strategies, etc.
Follow our new publications and discuss them on the Forum!
Add a new article

You are missing trading opportunities:
- Free trading apps
- Over 8,000 signals for copying
- Economic news for exploring financial markets
Registration
Log in
You agree to website policy and terms of use
If you do not have an account, please register

Price Action Analysis Toolkit Development (Part 6): Mean Reversion Signal Reaper
While some concepts may seem straightforward at first glance, bringing them to life in practice can be quite challenging. In the article below, we'll take you on a journey through our innovative approach to automating an Expert Advisor (EA) that skillfully analyzes the market using a mean reversion strategy. Join us as we unravel the intricacies of this exciting automation process.


Handling ZIP Archives in Pure MQL5
The MQL5 language keeps evolving, and its new features for working with data are constantly being added. Due to innovation it has recently become possible to operate with ZIP archives using regular MQL5 tools without getting third party DLL libraries involved. This article focuses on how this is done and provides the CZip class, which is a universal tool for reading, creating and modifying ZIP archives, as an example.

Neural networks made easy (Part 13): Batch Normalization
In the previous article, we started considering methods aimed at improving neural network training quality. In this article, we will continue this topic and will consider another approach — batch data normalization.

How to Quickly Create an Expert Advisor for Automated Trading Championship 2010
In order to develop an expert to participate in Automated Trading Championship 2010, let's use a template of ready expert advisor. Even novice MQL5 programmer will be capable of this task, because for your strategies the basic classes, functions, templates are already developed. It's enough to write a minimal amount of code to implement your trading idea.

Practical Use of Kohonen Neural Networks in Algorithmic Trading. Part I. Tools
The present article develops the idea of using Kohonen Maps in MetaTrader 5, covered in some previous publications. The improved and enhanced classes provide tools to solve application tasks.
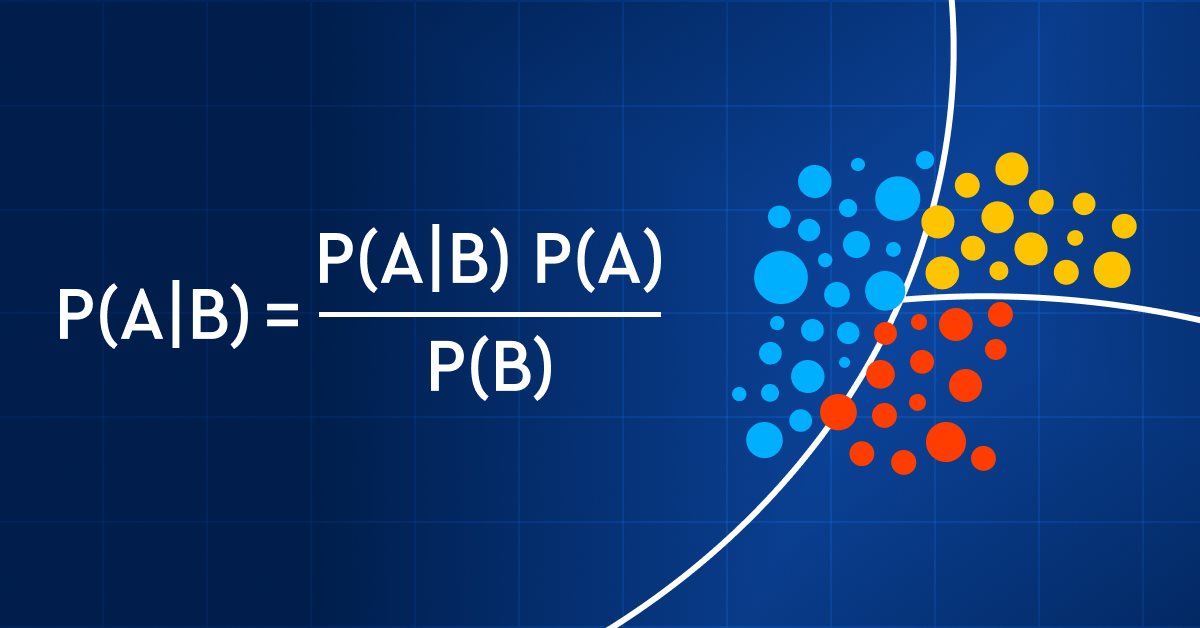
Data Science and Machine Learning (Part 11): Naïve Bayes, Probability theory in Trading
Trading with probability is like walking on a tightrope - it requires precision, balance, and a keen understanding of risk. In the world of trading, the probability is everything. It's the difference between success and failure, profit and loss. By leveraging the power of probability, traders can make informed decisions, manage risk effectively, and achieve their financial goals. So, whether you're a seasoned investor or a novice trader, understanding probability is the key to unlocking your trading potential. In this article, we'll explore the exciting world of trading with probability and show you how to take your trading game to the next level.

Introduction to MQL5 (Part 26): Building an EA Using Support and Resistance Zones
This article teaches you how to build an MQL5 Expert Advisor that automatically detects support and resistance zones and executes trades based on them. You’ll learn how to program your EA to identify these key market levels, monitor price reactions, and make trading decisions without manual intervention.

Graphical Interfaces VIII: the File Navigator Control (Chapter 3)
In the previous chapters of the eighth part of the series, our library has been reinforced by several classes for developing mouse pointers, calendars and tree views. The current article deals with the file navigator control that can also be used as part of an MQL application graphical interface.
Introduction to MQL5 (Part 26): Building an EA Using Support and Resistance Zones
This article teaches you how to build an MQL5 Expert Advisor that automatically detects support and resistance zones and executes trades based on them. You’ll learn how to program your EA to identify these key market levels, monitor price reactions, and make trading decisions without manual intervention.

Building a Custom Market Regime Detection System in MQL5 (Part 2): Expert Advisor
This article details building an adaptive Expert Advisor (MarketRegimeEA) using the regime detector from Part 1. It automatically switches trading strategies and risk parameters for trending, ranging, or volatile markets. Practical optimization, transition handling, and a multi-timeframe indicator are included.

Indicators with on-chart interactive controls
The article offers a new perspective on indicator interfaces. I am going to focus on convenience. Having tried dozens of different trading strategies over the years, as well as having tested hundreds of different indicators, I have come to some conclusions I want to share with you in this article.

Price Action Analysis Toolkit Development (Part 26): Pin Bar, Engulfing Patterns and RSI Divergence (Multi-Pattern) Tool
Aligned with our goal of developing practical price-action tools, this article explores the creation of an EA that detects pin bar and engulfing patterns, using RSI divergence as a confirmation trigger before generating any trading signals.

Magic of time trading intervals with Frames Analyzer tool
What is Frames Analyzer? This is a plug-in module for any Expert Advisor for analyzing optimization frames during parameter optimization in the strategy tester, as well as outside the tester, by reading an MQD file or a database that is created immediately after parameter optimization. You will be able to share these optimization results with other users who have the Frames Analyzer tool to discuss the results together.

Learn how to design a trading system by Bill Williams' MFI
This is a new article in the series in which we learn how to design a trading system based on popular technical indicators. This time we will cover Bill Williams' Market Facilitation Index (BW MFI).
Price Action Analysis Toolkit Development (Part 47): Tracking Forex Sessions and Breakouts in MetaTrader 5
Global market sessions shape the rhythm of the trading day, and understanding their overlap is vital to timing entries and exits. In this article, we’ll build an interactive trading sessions EA that brings those global hours to life directly on your chart. The EA automatically plots color‑coded rectangles for the Asia, Tokyo, London, and New York sessions, updating in real time as each market opens or closes. It features on‑chart toggle buttons, a dynamic information panel, and a scrolling ticker headline that streams live status and breakout messages. Tested on different brokers, this EA combines precision with style—helping traders see volatility transitions, identify cross‑session breakouts, and stay visually connected to the global market’s pulse.

Regression models of the Scikit-learn Library and their export to ONNX
In this article, we will explore the application of regression models from the Scikit-learn package, attempt to convert them into ONNX format, and use the resultant models within MQL5 programs. Additionally, we will compare the accuracy of the original models with their ONNX versions for both float and double precision. Furthermore, we will examine the ONNX representation of regression models, aiming to provide a better understanding of their internal structure and operational principles.

Data Science and Machine Learning (Part 09): The K-Nearest Neighbors Algorithm (KNN)
This is a lazy algorithm that doesn't learn from the training dataset, it stores the dataset instead and acts immediately when it's given a new sample. As simple as it is, it is used in a variety of real-world applications.

Developing a trading Expert Advisor from scratch (Part 18): New order system (I)
This is the first part of the new order system. Since we started documenting this EA in our articles, it has undergone various changes and improvements while maintaining the same on-chart order system model.

Implementing a Rapid-Fire Trading Strategy Algorithm with Parabolic SAR and Simple Moving Average (SMA) in MQL5
In this article, we develop a Rapid-Fire Trading Expert Advisor in MQL5, leveraging the Parabolic SAR and Simple Moving Average (SMA) indicators to create a responsive trading strategy. We detail the strategy’s implementation, including indicator usage, signal generation, and the testing and optimization process.

Revisiting an Old Trend Trading Strategy: Two Stochastic oscillators, a MA and Fibonacci
Old trading strategies. This article presents one of the strategies used to follow the trend in a purely technical way. The strategy is purely technical and uses a few technical indicators and tools to deliver signals and targets. The components of the strategy are as follows: A 14-period stochastic oscillator. A 5-period stochastic oscillator. A 200-period moving average. A Fibonacci projection tool (for target setting).

From Novice to Expert: Support and Resistance Strength Indicator (SRSI)
In this article, we will share insights on how to leverage MQL5 programming to pinpoint market levels—differentiating between weaker and strongest price levels. We will fully develop a working, Support and Resistance Strength Indicator (SRSI).

MVC design pattern and its application (Part 2): Diagram of interaction between the three components
This article is a continuation and completion of the topic discussed in the previous article: the MVC pattern in MQL programs. In this article, we will consider a diagram of possible interaction between the three components of the pattern.

Algorithmic trading based on 3D reversal patterns
Discovering a new world of automated trading on 3D bars. What does a trading robot look like on multidimensional price bars? Are "yellow" clusters of 3D bars able to predict trend reversals? What does multidimensional trading look like?

Creating an EA that works automatically (Part 11): Automation (III)
An automated system will not be successful without proper security. However, security will not be ensured without a good understanding of certain things. In this article, we will explore why achieving maximum security in automated systems is such a challenge.
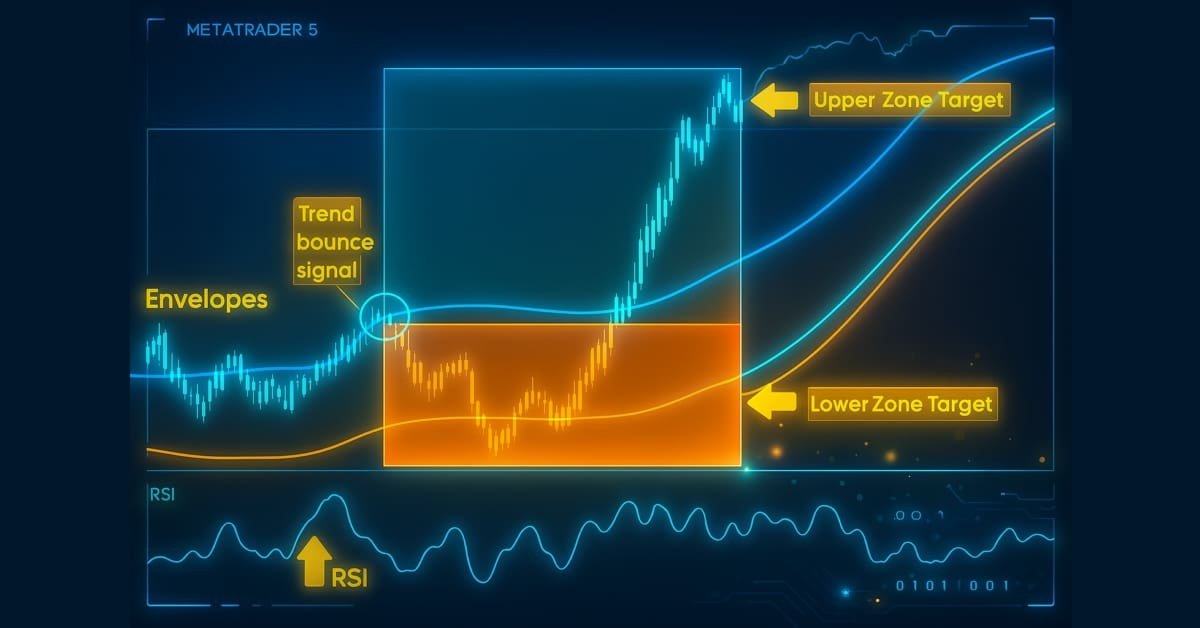
Automating Trading Strategies in MQL5 (Part 22): Creating a Zone Recovery System for Envelopes Trend Trading
In this article, we develop a Zone Recovery System integrated with an Envelopes trend-trading strategy in MQL5. We outline the architecture for using RSI and Envelopes indicators to trigger trades and manage recovery zones to mitigate losses. Through implementation and backtesting, we show how to build an effective automated trading system for dynamic markets

Trade transactions. Request and response structures, description and logging
The article considers handling trade request structures, namely creating a request, its preliminary verification before sending it to the server, the server's response to a trade request and the structure of trade transactions. We will create simple and convenient functions for sending trading orders to the server and, based on everything discussed, create an EA informing of trade transactions.

Building and testing Aroon Trading Systems
In this article, we will learn how we can build an Aroon trading system after learning the basics of the indicators and the needed steps to build a trading system based on the Aroon indicator. After building this trading system, we will test it to see if it can be profitable or needs more optimization.

Creating multi-symbol, multi-period indicators
In this article, we will look at the principles of creating multi-symbol, multi-period indicators. We will also see how to access the data of such indicators from Expert Advisors and other indicators. We will consider the main features of using multi-indicators in Expert Advisors and indicators and will see how to plot them through custom indicator buffers.

Price Action Analysis Toolkit Development (Part 39): Automating BOS and ChoCH Detection in MQL5
This article presents Fractal Reaction System, a compact MQL5 system that converts fractal pivots into actionable market-structure signals. Using closed-bar logic to avoid repainting, the EA detects Change-of-Character (ChoCH) warnings and confirms Breaks-of-Structure (BOS), draws persistent chart objects, and logs/alerts every confirmed event (desktop, mobile and sound). Read on for the algorithm design, implementation notes, testing results and the full EA code so you can compile, test and deploy the detector yourself.

MQL5 — You too can become a master of this language
This article will be a kind of interview with myself, in which I will tell you how I took my first steps in the MQL5 language. I will show you how you can become a great MQL5 programmer. I will explain the necessary bases for you to achieve this feat. The only prerequisite is a willingness to learn.

Using Pseudo-Templates as Alternative to C++ Templates
The article describes a way of programming without using templates but keeping the style of programming iherenet to them. It tells about implementation of templates using custom methods and has a ready-made script attached for creating a code on the basis of specified templates.

Trademinator 3: Rise of the Trading Machines
In the article "Dr. Tradelove..." we created an Expert Advisor, which independently optimizes parameters of a pre-selected trading system. Moreover, we decided to create an Expert Advisor that can not only optimize parameters of one trading system underlying the EA, but also select the best one of several trading systems. Let's see what can come of it...
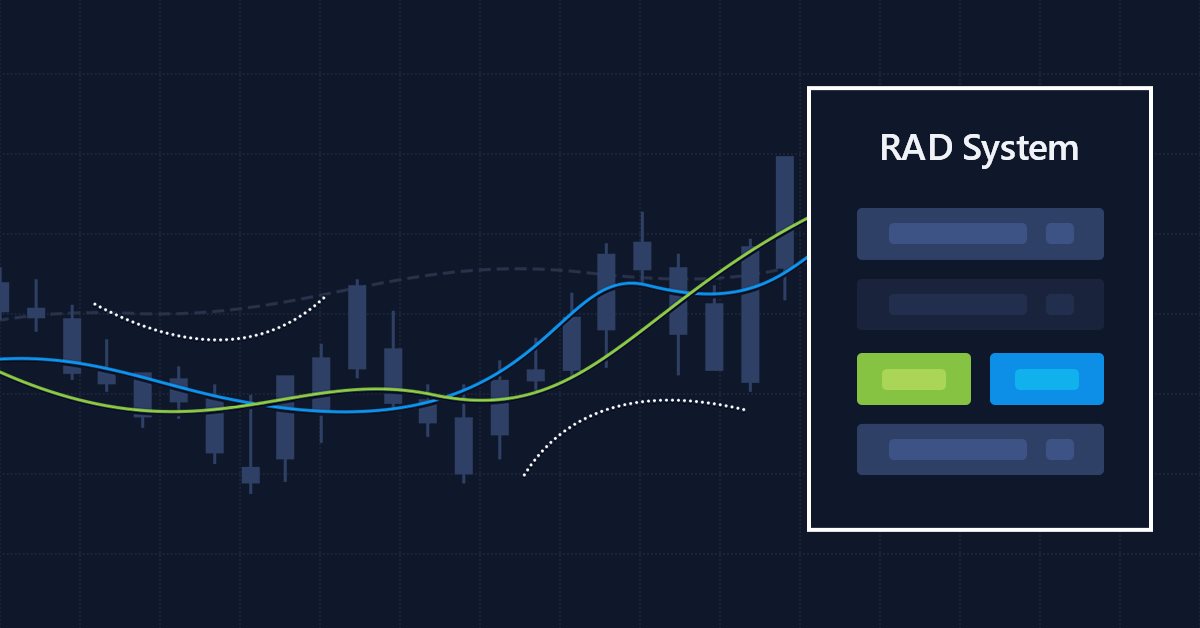
Multiple indicators on one chart (Part 06): Turning MetaTrader 5 into a RAD system (II)
In my previous article, I showed you how to create a Chart Trade using MetaTrader 5 objects and thus to turn the platform into a RAD system. The system works very well, and for sure many of the readers might have thought about creating a library, which would allow having extended functionality in the proposed system. Based on this, it would be possible to develop a more intuitive Expert Advisor with a nicer and easier to use interface.
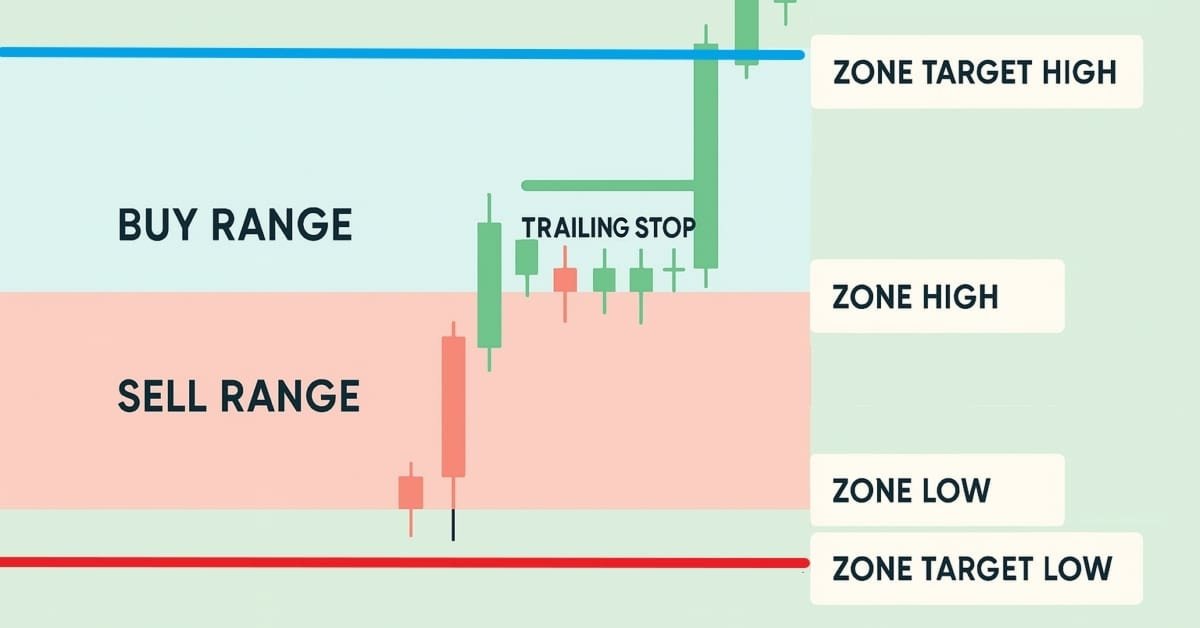
Automating Trading Strategies in MQL5 (Part 23): Zone Recovery with Trailing and Basket Logic
In this article, we enhance our Zone Recovery System by introducing trailing stops and multi-basket trading capabilities. We explore how the improved architecture uses dynamic trailing stops to lock in profits and a basket management system to handle multiple trade signals efficiently. Through implementation and backtesting, we demonstrate a more robust trading system tailored for adaptive market performance.
Timeseries in DoEasy library (part 46): Multi-period multi-symbol indicator buffers
In this article, I am going to improve the classes of indicator buffer objects to work in the multi-symbol mode. This will pave the way for creating multi-symbol multi-period indicators in custom programs. I will add the missing functionality to the calculated buffer objects allowing us to create multi-symbol multi-period standard indicators.
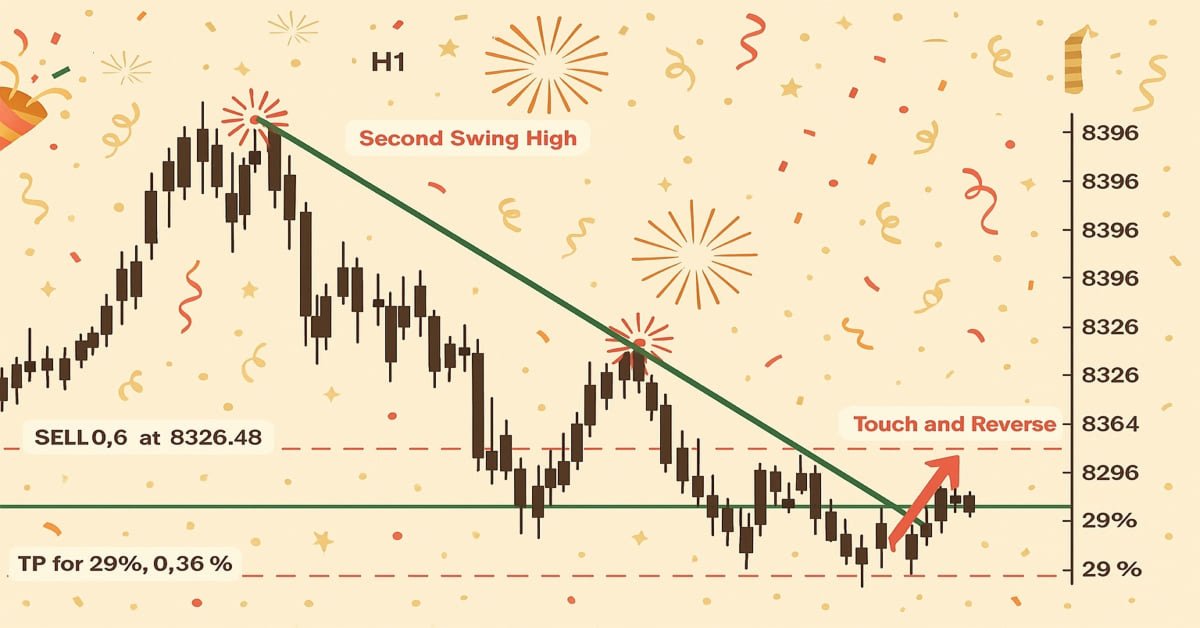
Introduction to MQL5 (Part 17): Building Expert Advisors for Trend Reversals
This article teaches beginners how to build an Expert Advisor (EA) in MQL5 that trades based on chart pattern recognition using trend line breakouts and reversals. By learning how to retrieve trend line values dynamically and compare them with price action, readers will be able to develop EAs capable of identifying and trading chart patterns such as ascending and descending trend lines, channels, wedges, triangles, and more.

Automating Trading Strategies with Parabolic SAR Trend Strategy in MQL5: Crafting an Effective Expert Advisor
In this article, we will automate the trading strategies with Parabolic SAR Strategy in MQL5: Crafting an Effective Expert Advisor. The EA will make trades based on trends identified by the Parabolic SAR indicator.

Learn how to design a trading system by Gator Oscillator
A new article in our series about learning how to design a trading system based on popular technical indicators will be about the Gator Oscillator technical indicator and how to create a trading system through simple strategies.

Creating a Daily Drawdown Limiter EA in MQL5
The article discusses, from a detailed perspective, how to implement the creation of an Expert Advisor (EA) based on the trading algorithm. This helps to automate the system in the MQL5 and take control of the Daily Drawdown.

Creating a mean-reversion strategy based on machine learning
This article proposes another original approach to creating trading systems based on machine learning, using clustering and trade labeling for mean reversion strategies.