From Novice to Expert: Animated News Headline Using MQL5 (XI)—Correlation in News Trading

Contents:
- Introduction
- Understanding Financial Correlation
- Implementation Strategy
- Testing and Results
- Conclusion
- Key Lessons
- Attachments
Introduction
The ability to trade multiple pairs simultaneously may sound exciting, but it also introduces significant risks—particularly when trading pairs that are highly correlated. When pairs move in the same direction, opening positions across all of them amplifies exposure. A single wrong decision could turn into multiple losing trades at once.
Another common challenge arises in the moments before major economic announcements, when traders often face uncertainty and indecision about which move to take. In our recent publications, we introduced the ability to select and trade multiple pairs with a single click through trading buttons. While this feature opened the door to faster execution, it also highlighted a new problem: heightened risk exposure.
This is where the concept of correlation becomes critical. By measuring the relationships between pairs, traders can refine their strategies, avoid redundant exposure, and even apply techniques like the leader–follower (catch-up) strategy—where one instrument’s movement helps predict another’s.
Having built a strong foundation with multi-symbol management, the next step is to integrate correlation analysis into the News Headline EA. This will allow us to filter out pairs that are not aligned with the intended trade direction, identify leading instruments, and improve overall efficiency during high-impact news trading—while still allowing for manual intervention.
Understanding Financial Correlation
Correlation, in financial markets, is a statistical measure that quantifies the degree to which two securities move in relation to each other. It is the cornerstone of modern risk management and a powerful tool for strategic trading, especially in a multi-symbol environment.
For the News Headline EA, understanding correlation transforms it from a simple executor of trades into a sophisticated strategy manager.
The Correlation Coefficient: The Key Metric
The relationship is expressed by the correlation coefficient, which ranges from -1 to +1.
- +1 (Perfect Positive Correlation): The two pairs move in perfect lockstep. If Pair A rises 1%, Pair B rises 1%. If Pair A falls, Pair B falls equally. (e.g., two nearly identical ETFs tracking the same index).
- 0 (No Correlation): There is no discernible relationship between the movements of the two pairs. They are completely independent.
- -1 (Perfect Negative Correlation): The two pairs move in perfect opposition. If Pair A rises 1%, Pair B falls 1%. (e.g., a classic hedge like a stock and a put option on that stock).
In reality, most correlations lie somewhere between these extremes (e.g., +0.85, -0.30).
Why Correlation is Non-Static and Context-Dependent
This is the most critical concept for news trading: correlation is not a fixed law. It is a dynamic relationship that changes over time and can break down completely under certain conditions.
Timeframe Dependency: The correlation between EUR/USD and GBP/USD on a 1-minute chart during news can be very different from their correlation on a daily chart. Your EA must calculate correlation over a short, relevant lookback period (e.g., 15-30 minutes) for news trading.
- Regime Change: Major economic shifts (e.g., a change in central bank policy) can alter long-standing correlations.
- Market Stress: During a "flight to safety" or a market panic (e.g., the 2008 crisis), correlations can converge to +1 or -1 unexpectedly. Diversification fails because everything moves together—either all up or all down. This is the ultimate test for your EA's risk management.
Calculating Correlation for the News Headline EA
The most common method is the Pearson correlation coefficient. Our EA would calculate this automatically between the percentage returns or the price changes of two assets (A and B) over a defined number of periods (N).
The formula is:

Where:
- 𝑟_A = returns of Asset A
- 𝑟_B = returns of Asset B
- Cov(𝑟_A.r_B) = covariance between the two return series
- 𝜎_A = standard deviation of Asset A returns
- 𝜎_B = standard deviation of Asset B returns
Practical Implementation:
- Data: Our EA already has price data for all selected pairs.
- Function: We will code a function, that returns the coefficient.
- Lookback: For news trading, periods will be small (e.g., 50-100 bars on a 1-minute or 5-minute chart).
Implementation Strategy
To implement correlation, I approached the task in two structured steps. The first step was to expand the CTradingButtons class to include both the correlation calculation logic and the visual interface required to display results on the chart. This ensures that all correlation-related functionality remains modular and reusable, living entirely within the header file while still being flexible enough to be called from any EA.
The second step focused on integration—embedding this new correlation feature into the main EA so it works seamlessly alongside existing components such as trading buttons, news lanes, and mini-chart tiles. By keeping the two steps separate, development and debugging became more efficient: we could validate the calculations and UI elements in isolation before merging them into the larger system.
In the following sections, we will walk through the incorporation of correlation into the header, covering the calculation formulas, marker placement on the chart, alignment with existing symbol labels, and cleanup routines to ensure no objects are left behind after deinitialization.
Step 1: Expanding CTradingButtons for correlation
1.1. The design constants and purpose
We start with a small set of compile-time defaults that control the correlation calculations: the window length (how many return samples we use), the maximum lag (how many bars we shift one series against the other to find lead/lag relationships), and a threshold that decides whether a correlation is considered strong enough to mark as “correlated.” These simple constants make the code easy to tune for responsiveness vs. noise sensitivity (short windows react faster but are noisier; longer windows are smoother).
// ---------------- Correlation defaults & utilities (merged) -------
#define CORR_WINDOW    40     // samples used for correlation window (returns)
#define CORR_MAX_LAG    3     // maximum lag (in bars) to test for cross-correlation
#define CORR_THRESHOLD 0.60   // threshold for "correlated" marker
1.2. Fetching return series (how we turn prices into comparable data)
Correlation is computed on "returns" (relative price changes) rather than raw prices to avoid level effects and to make the Pearson formula meaningful across instruments with different price scales. The FetchReturns function copies recent close prices for the requested symbol and timeframe, converts them into simple percentage returns.
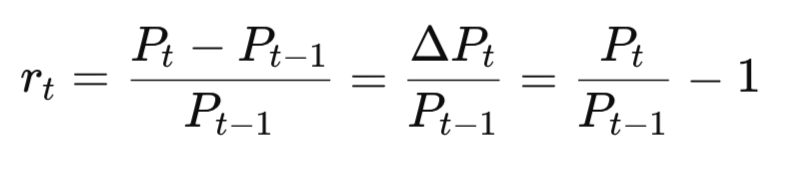
Where:
- R_t is the return at time t
- 𝑃_t is the current close price
- 𝑃_t−1 is the previous close price
- Δ𝑃_𝑡 = 𝑃_𝑡 − 𝑃_𝑡−1 , and returns the array of most recent returns (most-recent-first). It also reserves extra bars to allow lag testing. If insufficient data is present, it fails gracefully.
// Fetch recent returns for `symbol` on timeframe `tf`.
// Returns number of return samples placed into `ret[]` (most recent first).
int FetchReturns(const string symbol, const ENUM_TIMEFRAMES tf, const int samples, const int maxLag, double &ret[])
{
   if(StringLen(symbol) == 0 || samples <= 0) return 0;
   int need = samples + MathMax(0, maxLag) + 5;
   if(need <= 1) return 0;

   double closes[];
   ArrayResize(closes, need);
   int copied = CopyClose(symbol, tf, 0, need, closes);
   if(copied <= 1) return 0;

   int available = copied - 1; // returns available
   int use = MathMin(samples, available - MathMax(0, maxLag));
   if(use <= 0) return 0;

   ArrayResize(ret, use);
   for(int i = 0; i < use; i++)
   {
      double older = closes[i+1];
      double newer = closes[i];
      if(older == 0.0) ret[i] = 0.0;
      else ret[i] = (newer - older) / older;
   }
   return use;
}
1.3. Computing Pearson correlation from two return arrays (math explained)
Once we have two aligned return arrays of length n, we compute the Pearson correlation coefficient r. The familiar formula is
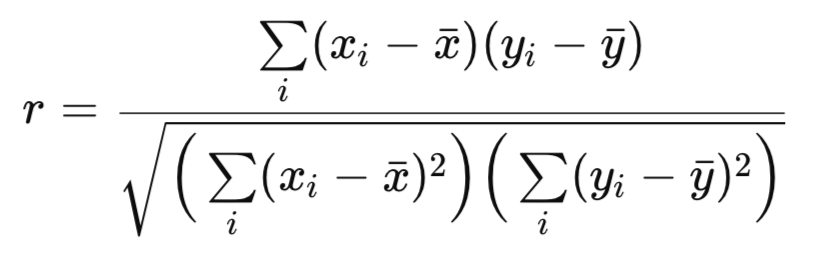
Where:
- r is the Pearson correlation coefficient (a single number between −1 and +1 that measures linear association)
- x_i is the i-th observation of series x (in our EA this is the i-th return for symbol X, e.g. a[i])
- y_i is the i-th observation of series y (the i-th return for symbol Y, e.g. b[i])
- x̄ (x bar) is the mean (average) of the x series: x̄ = (1/n) Σ x_i
- ȳ (y bar) is the mean of the y series: ȳ = (1/n) Σ y_i
This function implements that numerically: it computes means, then covariance and variances, and finally divides by the square root of the product of variances. It returns 0 for degenerate cases. Because we compute returns as simple percentage changes earlier, the result is scale-free (comparable across symbols).
// Compute Pearson correlation from two return arrays of length n
double ComputePearsonFromReturns(const double &a[], const double &b[], const int n)
{
   if(n <= 1) return 0.0;
   double meanA = 0.0, meanB = 0.0;
   for(int i = 0; i < n; i++) { meanA += a[i]; meanB += b[i]; }
   meanA /= n; meanB /= n;

   double cov = 0.0, varA = 0.0, varB = 0.0;
   for(int i = 0; i < n; i++)
   {
      double da = a[i] - meanA;
      double db = b[i] - meanB;
      cov += da * db;
      varA += da * da;
      varB += db * db;
   }

   if(varA <= 0.0 || varB <= 0.0) return 0.0;
   double r = cov / MathSqrt(varA * varB);
   if(r > 1.0) r = 1.0;
   if(r < -1.0) r = -1.0;
   return r;
}
1.4. Searching for the peak cross-correlation across lags (leader/follower detection)
A core enhancement is searching for the strongest correlation between the current chart symbol and each candidate symbol while allowing small lags. For each candidate, we shift one return series relative to the other across lags from −maxLag to +maxLag and compute the Pearson r for each shift. We keep the r with maximum absolute value (peakCorr) and the corresponding lag. A positive lag indicates the candidate lags the current symbol; a negative lag indicates the candidate leads the current symbol. This is how the EA can recommend a leader. The function returns peakCorr and lagAtPeak, or false if insufficient data.// Compute cross-correlation peak and lag between currSym and otherSym. // Outputs peakCorr and lagAtPeak (int). bool ComputeCrossCorrPeak(const string currSym, const string otherSym, const ENUM_TIMEFRAMES tf, const int window, const int maxLag, double &peakCorr, int &lagAtPeak) { if(StringLen(currSym) == 0 || StringLen(otherSym) == 0 || window <= 1) return(false); double rCurr[], rOther[]; int nCurr = FetchReturns(currSym, tf, window, maxLag, rCurr); int nOther = FetchReturns(otherSym, tf, window, maxLag, rOther); if(nCurr == 0 || nOther == 0) return(false); int available = MathMin(nCurr, nOther); if(available < window) return(false); bool found = false; peakCorr = 0.0; lagAtPeak = 0; for(int lag = -maxLag; lag <= maxLag; lag++) { int startCurr = 0; int startOther = lag; if(startOther < 0) { startCurr = -startOther; startOther = 0; } int maxSamples = available - MathMax(startCurr, startOther); if(maxSamples < window) continue; double a[], b[]; ArrayResize(a, window); ArrayResize(b, window); for(int i = 0; i < window; i++) { a[i] = rCurr[startCurr + i]; b[i] = rOther[startOther + i]; } double r = ComputePearsonFromReturns(a, b, window); if(!found || MathAbs(r) > MathAbs(peakCorr)) { peakCorr = r; lagAtPeak = lag; found = true; } } return(found); }
1.5. Rendering markers—the painter functions (visual feedback)
To display correlation results without cluttering the existing symbol labels, you added minimal markers: a compact label that shows a colored dot and the numeric correlation value. DrawCorrelationMarker creates a chart OBJ_LABEL at given coordinates, sets color to green (correlated) or red (not correlated), and writes a short text like "● 0.72". This keeps the UI compact and readable. A similar small function, DrawRecommendation writes the “Recommended leader” suggestion; DrawCorrelationTitle places a static "Correlation" header above the marker area. These three functions are simple object management wrappers that keep drawing consistent and centralize z-order and font choices.// Draw a small correlation marker near (x,y) — dot + numeric value only (no symbol text). void DrawCorrelationMarker(const string objName, const int x, const int y, const double corr, const bool correlated) { if(StringLen(objName) == 0) return; long chart = ChartID(); if(ObjectFind(chart, objName) == -1) ObjectCreate(chart, objName, OBJ_LABEL, 0, 0, 0); ObjectSetInteger(chart, objName, OBJPROP_CORNER, CORNER_LEFT_UPPER); ObjectSetInteger(chart, objName, OBJPROP_XDISTANCE, x); ObjectSetInteger(chart, objName, OBJPROP_YDISTANCE, y); ObjectSetInteger(chart, objName, OBJPROP_FONTSIZE, 10); int col = correlated ? clrLime : clrRed; ObjectSetInteger(chart, objName, OBJPROP_COLOR, col); ObjectSetInteger(chart, objName, OBJPROP_SELECTABLE, 0); ObjectSetInteger(chart, objName, OBJPROP_ZORDER, 20); // Show a small dot and the numeric correlation (2 decimals). Example: "● 0.72" string text = StringFormat("● %.2f", corr); ObjectSetString(chart, objName, OBJPROP_TEXT, text); } // Draw recommendation label (top-left of panel area) void DrawRecommendation(const string objName, const int x, const int y, const string text) { if(StringLen(objName) == 0) return; long chart = ChartID(); if(ObjectFind(chart, objName) == -1) ObjectCreate(chart, objName, OBJ_LABEL, 0, 0, 0); ObjectSetInteger(chart, objName, OBJPROP_CORNER, CORNER_LEFT_UPPER); ObjectSetInteger(chart, objName, OBJPROP_XDISTANCE, x); ObjectSetInteger(chart, objName, OBJPROP_YDISTANCE, y); ObjectSetInteger(chart, objName, OBJPROP_FONTSIZE, 10); ObjectSetInteger(chart, objName, OBJPROP_COLOR, clrWhite); ObjectSetInteger(chart, objName, OBJPROP_SELECTABLE, 0); ObjectSetInteger(chart, objName, OBJPROP_ZORDER, 21); ObjectSetString(chart, objName, OBJPROP_TEXT, text); } // Draw static "Correlation" title above correlation area void DrawCorrelationTitle(const string objName, const int x, const int y) { if(StringLen(objName) == 0) return; long chart = ChartID(); if(ObjectFind(chart, objName) == -1) ObjectCreate(chart, objName, OBJ_LABEL, 0, 0, 0); ObjectSetInteger(chart, objName, OBJPROP_CORNER, CORNER_LEFT_UPPER); ObjectSetInteger(chart, objName, OBJPROP_XDISTANCE, x); ObjectSetInteger(chart, objName, OBJPROP_YDISTANCE, y); ObjectSetInteger(chart, objName, OBJPROP_FONTSIZE, 11); ObjectSetInteger(chart, objName, OBJPROP_COLOR, clrWhite); ObjectSetInteger(chart, objName, OBJPROP_SELECTABLE, 0); ObjectSetInteger(chart, objName, OBJPROP_ZORDER, 22); ObjectSetString(chart, objName, OBJPROP_TEXT, "Correlation"); }
1.6. Where the correlation settings and UI state live inside the trading-button class
For tidy integration, correlation parameters and the per-checkbox coordinates are stored as members of the CTradingButtons class. The constructor sets sane defaults so the EA can simply create the trading panel and have correlation ready. The key members are m_corr_window, m_corr_maxlag, m_corr_threshold, the vertical/horizontal offsets (so you can nudge dots around), and m_check_x/m_check_y arrays that remember checkbox pixel positions. This localized state makes UpdateCorrelationMarkersInternal simple and avoids scattering correlation state across the EA.// initialize correlation defaults here (cannot initialize at declaration) m_corr_marker_prefix = "CorrMarker_"; m_corr_rec_name = "Corr_Recommendation"; m_corr_title_name = "Corr_Title"; m_corr_tf = PERIOD_M1; m_corr_window = CORR_WINDOW; m_corr_maxlag = CORR_MAX_LAG; m_corr_threshold = CORR_THRESHOLD; // vertical offsets (push correlation UI down a bit) m_corr_rec_y_offset = 24; // recommendation label y-distance in pixels (tweak) m_corr_marker_v_offset = 8; // marker offset relative to checkbox top (tweak) // horizontal offset default (shift markers slightly right) m_corr_marker_h_offset = 6; // default shift to the right by 6 pixels (tweak as needed) ArrayResize(m_check_x, 0); ArrayResize(m_check_y, 0);
1.7. Public controls: expose runtime tuning to the EA
Two small methods let the EA tune correlation at runtime: SetCorrelationParams to change timeframe/window/maxlag/threshold and SetCorrelationMarkerHorizontalOffset so the EA user can nudge marker positions for different screen sizes or checkbox widths. Both call (or will call) the internal update routine to redraw markers immediately. This separation keeps UI tweaks simple.// Configure correlation evaluation (optional runtime tuning) void SetCorrelationParams(const int timeframe, const int window, const int maxlag, const double threshold) { m_corr_tf = timeframe; m_corr_window = MathMax(1, window); m_corr_maxlag = MathMax(0, maxlag); m_corr_threshold = MathMax(0.0, MathMin(1.0, threshold)); PrintFormat("SetCorrelationParams: tf=%d window=%d maxlag=%d thresh=%.2f", m_corr_tf, m_corr_window, m_corr_maxlag, m_corr_threshold); } // Exposed update so EA can refresh markers (public wrapper) void UpdateCorrelationMarkers() { UpdateCorrelationMarkersInternal(); } // Public setter for horizontal offset of correlation markers void SetCorrelationMarkerHorizontalOffset(const int px) { m_corr_marker_h_offset = px; UpdateCorrelationMarkersInternal(); }
1.8. Per-checkbox draw: DrawCorrelationForIndex (where each marker is computed & painted)
For each resolved pair, we compute the correlation peak vs. the current chart symbol and decide whether it meets the threshold. Coordinates are read from stored m_check_x/m_check_y values (gathered while creating checkboxes or by querying the checkbox object), then we place the dot and numeric text at that pixel position (with configurable horizontal & vertical offsets). The function calls ComputeCrossCorrPeak and DrawCorrelationMarker—keeping the responsibilities separated.void DrawCorrelationForIndex(const int idx) { if(idx < 0 || idx >= ArraySize(availablePairs)) return; string sym = availablePairs[idx]; if(StringLen(sym) == 0) return; if(idx >= ArraySize(m_check_x) || idx >= ArraySize(m_check_y)) return; int x = m_check_x[idx]; int y = m_check_y[idx]; if(x < 0 || y < 0) return; // move marker slightly to the right with configurable horizontal offset int markerX = MathMax(2, x - 18 + m_corr_marker_h_offset); int markerY = y + m_corr_marker_v_offset; // configurable vertical offset double peakCorr = 0.0; int lag = 0; bool ok = ComputeCrossCorrPeak(Symbol(), sym, (ENUM_TIMEFRAMES)m_corr_tf, m_corr_window, m_corr_maxlag, peakCorr, lag); if(!ok) peakCorr = 0.0; bool correlated = (MathAbs(peakCorr) >= m_corr_threshold); string objName = m_corr_marker_prefix + sym; DrawCorrelationMarker(objName, markerX, markerY, peakCorr, correlated); }
1.9. Orchestrating everything: UpdateCorrelationMarkersInternal (leader selection + redraw)
This is the central function that iterates over resolved pairs, ensures we have pixel coordinates for the checkboxes, draws each marker, and then computes the best leader candidate by choosing the symbol with the largest absolute peak correlation that also indicates leadership by negative lag (you can adjust your leader rule). The function writes a short human-friendly “Recommended leader: … r=… lag=…” string via DrawRecommendation and draws a "Correlation" title above the area. This is the function you call whenever checkboxes or screen layout changes.
   void UpdateCorrelationMarkersInternal()
   {
      int n = ArraySize(availablePairs);
      if(n == 0) return;

      for(int i = 0; i < n; i++)
      {
         if(StringLen(availablePairs[i]) == 0) continue;

         if(i >= ArraySize(m_check_x) || i >= ArraySize(m_check_y) || m_check_x[i] < 0 || m_check_y[i] < 0)
         {
            string chkName = "Chk_" + availablePairs[i];
            if(ObjectFind(ChartID(), chkName) >= 0)
            {
               int y = (int)ObjectGetInteger(ChartID(), chkName, OBJPROP_YDISTANCE);
               int x = (int)ObjectGetInteger(ChartID(), chkName, OBJPROP_XDISTANCE);
               if(ArraySize(m_check_x) < n) ArrayResize(m_check_x, n);
               if(ArraySize(m_check_y) < n) ArrayResize(m_check_y, n);
               m_check_x[i] = x;
               m_check_y[i] = y;
            }
            else
               continue;
         }

         DrawCorrelationForIndex(i);
      }

      double bestCorr = 0.0;
      string bestSym = "";
      int bestLag = 0;
      for(int j = 0; j < n; j++)
      {
         if(StringLen(availablePairs[j]) == 0) continue;
         double p = 0.0; int l = 0;
         bool ok = ComputeCrossCorrPeak(Symbol(), availablePairs[j], (ENUM_TIMEFRAMES)m_corr_tf, m_corr_window, m_corr_maxlag, p, l);
         if(!ok) continue;
         if(l < 0 && MathAbs(p) > MathAbs(bestCorr))
         {
            bestCorr = p;
            bestSym = availablePairs[j];
            bestLag = l;
         }
      }

      int recX = checkStartX;
      int recY = m_corr_rec_y_offset; // configurable vertical offset for recommendation
      string recText;
      if(bestSym != "")
         recText = StringFormat("Recommended leader: %s  r=%.2f lag=%d", bestSym, bestCorr, bestLag);
      else
         recText = "No clear leader detected";

      // Draw title above the recommendation/markers area
      DrawCorrelationTitle(m_corr_title_name, recX, MathMax(2, recY - 18));
      DrawRecommendation(m_corr_rec_name, recX, recY, recText);
   }
1.10. Cleanup: DeleteCorrelationMarkers (tidy object removal)
When the header/UI is torn down (Deinit) we remove all correlation label objects along with the title and recommendation label so the chart returns to its pre-EA state. This prevents orphaned labels when the EA or button panel is removed.void DeleteCorrelationMarkers() { for(int i = 0; i < ArraySize(availablePairs); i++) { if(StringLen(availablePairs[i]) == 0) continue; string obj = m_corr_marker_prefix + availablePairs[i]; if(ObjectFind(ChartID(), obj) >= 0) ObjectDelete(ChartID(), obj); } if(ObjectFind(ChartID(), m_corr_rec_name) >= 0) ObjectDelete(ChartID(), m_corr_rec_name); if(ObjectFind(ChartID(), m_corr_title_name) >= 0) ObjectDelete(ChartID(), m_corr_title_name); }
Where and when the correlation UI is triggered (integration points)
To stay in sync with the checkbox layout and user interactions, we call UpdateCorrelationMarkersInternal after creating the checkboxes (so initial markers are placed) and again whenever a checkbox is toggled via HandleChartEvent. Here are the two call-sites (CreatePairCheckboxes ends by calling UpdateCorrelationMarkersInternal; HandleChartEvent calls UpdateCorrelationMarkersInternal when a checkbox changes).// end of CreatePairCheckboxes() // inside HandleChartEvent() when checkbox clicked: UpdateCorrelationMarkersInternal();
Step 2: Integration of Correlation into the EA
2.1. Header includes—make correlation API available.
Include the trading-buttons header (which now contains correlation utilities) so the EA can call its public APIs (create checkboxes, set correlation params, update markers, deinit). This must appear at the top of the EA before any use of buttonsEA.
#include <TradingButtons.mqh>
#include <Trade\Trade.mqh>
#include <Canvas\Canvas.mqh>
#include <ChartMiniTiles.mqh>   // <-- CTM class include (make sure this file is in MQL5/Include/)
2.2. User inputs for correlation—expose tuning to the trader.
Expose timeframe, window, max lag and threshold so users can tune how sensitive/stable correlation detection should be. These are read in OnInit() and passed to the header.
// Correlation tuning exposed to EA
input group "Correlation (TradingButtons)"
input int CorrTimeframe = PERIOD_M1;
input int CorrWindow = 40;
input int CorrMaxLag = 3;
input double CorrThreshold = 0.60;
2.3. Create pair UI (checkboxes)—anchor points for correlation markers
Create the pair checkboxes (this also gives the header the UI coordinates it needs to place dots and values next to each symbol). Do this early during initialization so the header can query checkbox positions.
// Create pair checkboxes aligned below the canvas lanes:
int checkboxY = InpTopOffset + (InpSeparateLanes ? 8 : 28) * lineH + 6; // same as before
buttonsEA.CreatePairCheckboxes(majorPairs, pairSelected, checkboxY);
2.4. Pass correlation params and force initial draw
After creating the checkboxes, hand the EA inputs to the header and force an initial marker refresh so the correlation UI appears immediately on start.
// Set correlation params in TradingButtons
buttonsEA.SetCorrelationParams(CorrTimeframe, CorrWindow, CorrMaxLag, CorrThreshold);

// Force initial correlation markers
buttonsEA.UpdateCorrelationMarkers();
2.5. Event forwarding & layout-change handling
Forward chart events to the header so checkbox clicks and UI interactions are handled there. Also respond to chart layout changes (CHARTEVENT_CHART_CHANGE) by reflowing both the mini-tiles and correlation markers to keep positions correct.
void OnChartEvent(const int id, const long &lparam, const double &dparam, const string &sparam)
{
   // Let the tiles class handle object clicks (toggle button). If handled, stop processing.
   if(tiles.HandleEvent(id, sparam))
      return;

   // Forward to the TradingButtons header afterward
   buttonsEA.HandleChartEvent(id, sparam, majorPairs, pairSelected);

   // Also respond to chart change events for CTM layout
   if(id == CHARTEVENT_CHART_CHANGE)
   {
      tiles.UpdateLayout();
      buttonsEA.UpdateCorrelationMarkers();
   }
}
2.6. Timer-driven refresh—keep correlation markers current
On each timer tick the EA performs many periodic tasks and then asks the header to recompute and redraw correlation markers so dots/values reflect recent price changes.
// Keep CTM updated every tick (timer-driven)
tiles.UpdateLayout();

// Keep correlation markers fresh — call the header's public updater
buttonsEA.UpdateCorrelationMarkers();
2.7. Cleanup—header deinitialization removes correlation objects
When the EA stops, call the header Deinit/cleanup so the header can remove all correlation marker objects, recommendation label and title. At the EA level you call buttonsEA.Deinit(). Internally the header should delete each marker—example header cleanup function:
void OnDeinit(const int reason)
{
   EventKillTimer();
   buttonsEA.Deinit();

   // ... other UI destruction ...

   // delete CTM tiles and toggle button
   tiles.Delete();
}
Testing and Results
Deploying the updated News Headline EA on a live MetaTrader 5 chart is the most effective way to test its functionality, since many of its features rely on real-time data and cannot be fully validated in the Strategy Tester.
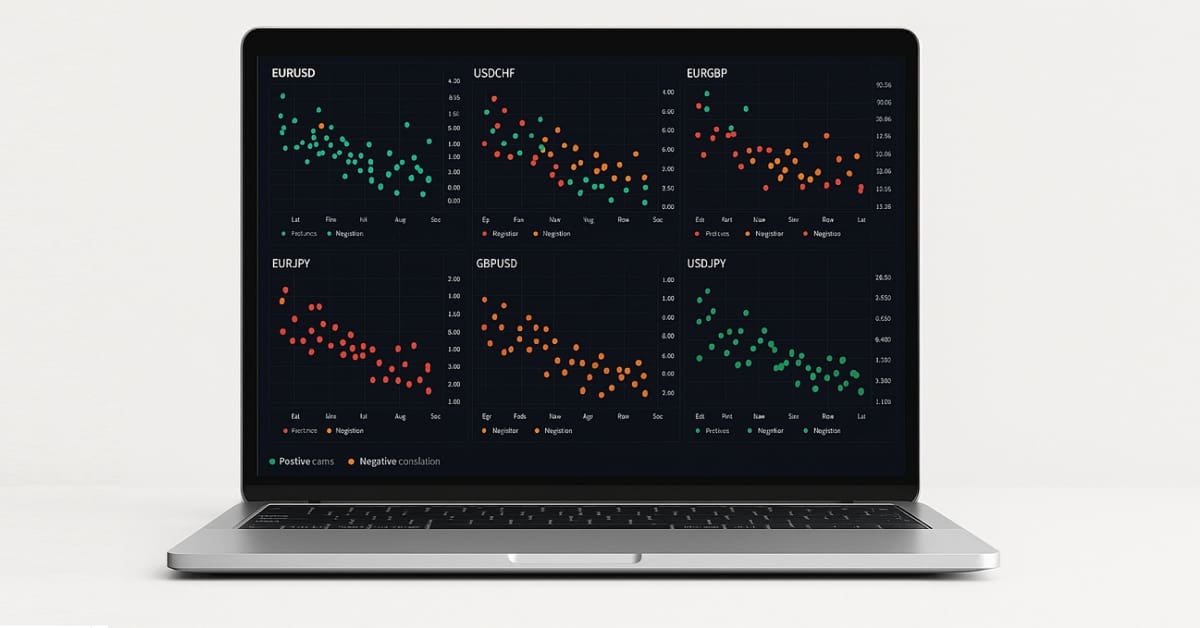
The test results are shown in the images below. Each major symbol label now displays a correlation value along with a colored dot: red for negative correlation and lime green for positive correlation. The numerical values, ranging from -1 to +1, represent the strength and direction of correlation relative to the current chart pair, which acts as the leader. A positive correlation indicates that the pair tends to move in the same direction as the leader, while a negative correlation suggests movement in the opposite direction.

Figure 1: Testing Correlation on GBPAUD using the updated News Headline EA
As illustrated in the images, correlation values fluctuate slowly, as they are influenced not only by market volatility but also by the size of the correlation window. This behavior reflects the natural lag in statistical relationships, making correlation analysis a stable complement to real-time trading decisions.
Conclusion
Financial correlation can be a powerful tool for filtering out pairs and reducing risk exposure when trading multiple instruments during high-impact events. We have successfully implemented this concept within the News Headline EA to improve efficiency in multi-symbol trading under volatile conditions.
The goal is not simply to enable trading across all pairs simultaneously, but to use correlation as a statistical guide for making more decisive and informed choices. By analyzing how pairs move in relation to one another, the EA allows traders to focus on the opportunities that align with their strategy while avoiding redundant or overly risky positions.
While there is still much more that can be derived from this concept, our current implementation already represents a significant step forward. As shown in the image below, I can now select which pairs to trade simultaneously, guided by the displayed correlation values.

Figure 2: Using Correlation to Decide Which Pairs to Trade Simultaneously.
This concept opens the door to many more strategies, and implementing them in MQL5 is entirely possible. All source code and key components are attached and partially documented in the table of attachments below. You are welcome to join the discussion—share your thoughts, ideas, and suggestions as we continue to expand our MQL5 tools into practical, winning strategies.
Key Lessons
| Lesson | Description: |
|---|---|
| Purposeful Integration | Correlation should be treated as a feature that informs trading decisions, not as a standalone signal. Integrating correlation into the UI and workflow (checkboxes, markers, recommendations) makes statistical information actionable during news-driven, multi-symbol trading. |
| Work with Returns, Not Raw Prices | Compute correlation on period-to-period returns (relative price changes) so comparisons are scale-free across symbols. Using returns avoids level effects and makes Pearson correlation meaningful for instruments with different price ranges. |
| Pearson Correlation Implementation | Implement the Pearson coefficient carefully: compute means, covariance (sum of paired deviations), and normalize by the product of standard deviations. Guard against zero variance to avoid division-by-zero errors. |
| Window Length Trade-off | Choose correlation window length deliberately: short windows react quickly but are noisy; long windows are smoother but slower. Provide the window as a runtime parameter so users can tune responsiveness versus stability. |
| Lag and Leader–Follower Detection | Test small positive and negative lags when computing cross-correlation to identify leading instruments. The lag with the peak absolute correlation indicates whether another pair leads or lags the current chart, enabling leader recommendations. |
| Thresholding for Decisions | Apply a tunable threshold to decide when to mark a pair as “correlated.” This prevents over-marking and lets traders control sensitivity (typical thresholds range from 0.5 to 0.8 depending on tolerance for false positives). |
| Compact, Non-Intrusive Visualization | Display correlation as a small colored dot plus a numeric value near existing symbol labels, and add a concise title like “Correlation.” Compact markers convey information without cluttering the chart or obstructing trading controls. |
| Anchor Markers to UI Elements | Position correlation markers relative to existing UI anchors (for example, the symbol checkboxes) so markers remain aligned across chart resizes and panel changes. Update positions whenever layout changes occur. |
| Use Correlation to Reduce Exposure | Leverage correlation to filter out redundant pairs when opening multi-pair positions. Avoid taking similar directional trades on highly correlated pairs to reduce aggregated risk during high-impact events. |
| Expose Runtime Tuning | Make timeframe, window, maximum lag and threshold available as inputs. Allowing traders to tune these at runtime increases flexibility and helps adapt the algorithm to different market regimes and user preferences. |
| Timer-Driven Refresh and Performance | Recompute and redraw correlation markers on a controlled timer to keep values current while bounding CPU and API usage. Balance update frequency against computation cost so UI is timely but not resource-heavy. |
| Handle Missing or Degenerate Data Gracefully | Detect insufficient history or zero-variance series and skip or mark such pairs conservatively. Returning safe defaults instead of crashing keeps the EA robust across brokers and symbol lists. |
| Clean Up Objects on Deinitialization | Remove all correlation markers, title and recommendation labels during Deinit to avoid leaving orphaned objects on the chart. Proper cleanup ensures a tidy chart after the EA is removed or reloaded. |
| Modular, Header-Based Design | Encapsulate correlation logic and drawing inside a reusable header/class (for example, expanding the trading-button utility). This keeps the EA code focused, simplifies testing, and enables reuse across projects. |
| Prefer Live-Chart Testing for Real-Time Features | Test correlation and UI interactions on a live chart rather than the Strategy Tester, because correlation relies on real-time tick dynamics and interactive UI placement that the tester does not fully replicate. |
Attachments
The table below lists the source files that were updated to add correlation capability. Each row shows the filename, the current file version (where applicable), and a short description of what changed—focusing on correlation calculations, marker/UI updates, public API hooks, and integration points with the main EA. | Filename | Version | Description |
|---|---|---|
| TradingButtons.mqh | 1.01 | Trading UI header expanded to include correlation utilities. Adds Pearson and lagged cross-correlation calculations, configurable parameters (timeframe, window, max lag, threshold), and efficient timer-driven updates. Visual changes include compact correlation markers (colored dot + numeric value), a “Correlation” title above the block, placement adjustments (moved slightly lower and shifted right), and removal of duplicate symbol text so only dots and values appear next to existing labels. Exposes public API functions for the EA: SetCorrelationParams, UpdateCorrelationMarkers, CreatePairCheckboxes, HandleChartEvent, and Deinit (cleanup). Handles degenerate data and cleans up all created objects on deinitialization. |
| NewsHeadlineEA.mq5 | 1.15 | Main EA integrating calendar, news, AI insights, the TradingButtons UI, and mini-chart tiles. Updated to pass correlation inputs into the TradingButtons header, call UpdateCorrelationMarkers on init, timer, and chart-change events, and position the correlation UI to avoid overlap with trading controls and CTM. It also integrates ChartMiniTiles for multi-symbol mini-charts and reserves the top area for the trading UI. Ensures graceful cleanup of correlation markers and CTM tiles on deinit. |
| ChartMiniTiles.mqh | 1.0 | Reusable mini-chart tiles class for embedding multiple symbol charts inside the main chart. |
Warning: All rights to these materials are reserved by MetaQuotes Ltd. Copying or reprinting of these materials in whole or in part is prohibited.
This article was written by a user of the site and reflects their personal views. MetaQuotes Ltd is not responsible for the accuracy of the information presented, nor for any consequences resulting from the use of the solutions, strategies or recommendations described.

- Free trading apps
- Over 8,000 signals for copying
- Economic news for exploring financial markets
You agree to website policy and terms of use